1. Introduction
The aqueous carbon cycle plays an essential role in the global carbon cycle, and the aqueous carbon pool is a crucial link between the various carbon pools (Gao et al. Reference Gao, Jia, Lu, Yang, Lyu, Shi, Zhou and Yu2021; Tranvik et al. Reference Tranvik, Cole and Prairie2018). Among the carbon pools of inland water bodies, river systems are key exchange reservoirs linking the terrestrial, marine, and atmospheric carbon pools (Moreira-Turcq et al. Reference Moreira-Turcq, Bonnet, Amorim, Bernardes, Lagane, Maurice, Perez and Seyler2013). The carbon in rivers can be divided into inorganic carbon (IC) and organic carbon (OC) (Soria-Reinoso et al. Reference Soria-Reinoso, Alcocer, Sánchez-Carrillo, García-Oliva, Cuevas-Lara, Cortés-Guzmán and Oseguera2022; Striegl et al. Reference Striegl, Dornblaser, Aiken, Wickland and Raymond2007). Dissolved organic carbon (DOC) generally refers to OC with particle size < 0.7 μm, which is an important active component of water column carbon, representing the level of biological activity in the water column, as well as an energy substance or food source for phytoplankton (Keaveney et al. Reference Keaveney, Reimer and Foy2015a, Reference Keaveney, Reimer and Foy2015b). Changes in its concentrations and isotopic values can visually reflect variations in regional carbon cycle patterns (Liu and Wang Reference Liu and Wang2021). Studying the sources of river DOC is crucial for a more comprehensive recognition of the river carbon cycle and for exploring the biogeochemical processes of river carbon (Battin et al. Reference Battin, Lauerwald, Bernhardt, Bertuzzo, Gener, Hall, Hotchkiss, Maavara, Pavelsky and Ran2023; Ni and Li Reference Ni and Li2022).
There are two main sources of river DOC, endogenous and exogenous (Fu et al. Reference Fu, Tang, Li, Zhao, Zhong and Zeng2014; Wen et al. Reference Wen, Xiao, Chen, Zhang and Yue2023). Endogenous sources mainly include degradation of water column particulate organic carbon (POC), fixation by aquatic photosynthetic plants and plankton such as algae (characterized by measuring carbon isotope values of water column dissolved inorganic carbon [DIC]) (McCallister et al. Reference McCallister, Bauer, Cherrier and Ducklow2004), etc. Exogenous sources primarily consist of sediments (weathering products of soils, river sands, and bedrock around the catchment) and biological byproducts introduced by erosion and scouring of external sources consisting of organic matter (OM) of terrestrial origin, atmospheric precipitation, sewage discharge, and land use (Dong et al. Reference Dong, Li, Kong, Zhang and Xi2020). Various methods have been tried to trace OC sources, such as fluorescence spectroscopy (Ma and Li Reference Ma and Li2020), biomarker compound method (Amon et al. Reference Amon, Rinehart, Duan, Louchouarn, Prokushkin, Guggenberger, Bauch, Stedmon, Raymond and Holmes2012), C/N ratio method (Takaki et al. Reference Takaki, Hattori and Yamashita2022). However, the above methods may be affected by OM activities and are not stable enough. With the rise of isotope tracing, this method can be used to determine the source of carbon as long as the carbon is fractionated during the flow and the carbon isotope is fractionated at the same time (Dong et al. Reference Dong, Li, Kong, Zhang and Xi2020). However, many potential end-members are difficult to differentiate because of their signal overlap, a single δ13C value does not permit adequate identification of river DOC (Wakeham et al. Reference Wakeham, McNichol, Kostka and Pease2006). Along with the rapid development of AMS analytical testing techniques, the radiocarbon isotope 14C can fill this gap. The dynamic variation interval of Δ14C (–1000‰ to +250‰) is much larger than the δ13C range (–32‰ to –12‰) (McCallister et al. Reference McCallister, Bauer, Cherrier and Ducklow2004), which has become one of the OC source tracers (Fu et al. Reference Fu, Xu, Druffel, Wang, Sun, Luo, Zhang and Fan2022; Heaton et al. Reference Heaton, Bronk Ramsey, Butzin, Köhler, Muscheler, Reimer and Wacker2021) and can additionally provide unique information such as age and residence time of the associated OM (Raymond and Bauer Reference Raymond and Bauer2001b). The joint application of radiocarbon isotope Δ14C values and stable carbon isotope δ13C values effectively avoids problems such as signal overlap, resulting in high-resolution analysis of OM sources (Fu et al. Reference Fu, Xu, Druffel, Wang, Sun, Luo, Zhang and Fan2022). Both Δ14C and δ13C are linear variables that not only provide qualitative insights into the sources of OC but also enable direct calculations in isotope mixing models, facilitating the quantitative resolution of carbon sources. This approach has been applied across diverse aquatic systems, including rivers and estuaries (McCallister et al. Reference McCallister, Bauer, Cherrier and Ducklow2004; Raymond and Bauer Reference Raymond and Bauer2001a), lakes (Zigah et al. Reference Zigah, Minor, Werne and McCallister2011, Reference Zigah, Minor and Werne2012), oceans (Guo et al. Reference Guo, Santschi, Cifuentes, Trumbore and Southon1996; McCarthy et al. Reference McCarthy, Beaupré, Walker, Voparil, Guilderson and Druffel2011; Zigah et al. Reference Zigah, McNichol, Xu, Johnson, Santinelli, Karl and Repeta2017), and reservoirs and artificial lakes (Kang et al. Reference Kang, Kim, Ryu and Shin2020; Li Reference Li2022).
However, in quantitative assessments of riverine DOC sources, where sedimentary total organic carbon (TOC) is considered a source of riverine DOC, the interpretation of sources may be misinterpreted due to the signal interference of old carbon. Thereby underestimating the contribution of exogenous or sedimentary sources to the riverine DOC pool. According to Marwick et al. (Reference Marwick, Tamooh, Teodoru, Borges, Darchambeau and Bouillon2015), river DOC is a readily decomposable component, mainly derived from the degradation of young OM, which is mostly contributed by the primary productivity of watershed plants (Mayorga et al. Reference Mayorga, Aufdenkampe, Masiello, Krusche, Hedges, Quay, Richey and Brown2005; Schiff et al. Reference Schiff, Aravena, Trumbore, Hinton, Elgood and Dillon1997). With water transport, DOC is continuously exchanged between various carbon pools, and the turnover time is relatively quick. In addition, the OC contained in the bulk sediment is usually an inhomogeneous mixture from different sources (Wang et al. Reference Wang, Burr, Wang, Lin and Nguyen2016). Several scholars have found that TOC in sediments can be divided into different fractions produced by combustion at various temperatures (Cheng and Fu Reference Cheng and Fu2020; Cheng et al. Reference Cheng, Zhou, Wang, Lu and Du2013, Reference Cheng, Burr, Zhou, Chen, Hou, Du, Fu and Lu2020, Reference Cheng, Dong, Zhou, Song, Zhou, Fan, Lan, Xian, Hou and Chen2022; McGeehin et al. Reference McGeehin, Burr, Jull, Reines, Gosse, Davis, Muhs and Southon2001; Rosenheim et al. Reference Rosenheim, Day, Domack, Schrum, Benthien and Hayes2008; Wang et al. Reference Wang, Hackley, Panno, Coleman, Liu and Brown2003, Reference Wang, Burr, Wang, Lin and Nguyen2016). The young, labile bioorganic matter was discovered to be the primary source of low-energy/low-temperature OC fractions by Cui et al. (Reference Cui, Mucci, Bianchi, He, Vaughn, Williams, Wang, Smeaton, Koziorowska-Makuch and Faust2022), who investigated the reactivity of sedimentary OC by analyzing the distribution of activation energies needed to destroy OC by thermochemical decomposition (Hemingway et al. Reference Hemingway, Rothman, Rosengard and Galy2017; Rosenheim et al. Reference Rosenheim, Day, Domack, Schrum, Benthien and Hayes2008). Therefore, we focused on the contribution of low-temperature organic fractions as the source of river DOC and applied the stepped-combustion method to separate TOC from river sediments.
Current studies on DOC concentration, sources, and flux in Chinese rivers have involved the Yangtze (Li et al. Reference Li, Meng, Zhao, Gu, Spencer, Álvarez-Salgado, Kellerman, McKenna, Huang and Yang2023; Wang et al. Reference Wang, Ma, Li, Song and Wu2012), Yellow River (Ma et al. Reference Ma, Jin, Wu, Yang, Wang, Luo, Huang, Li, Li and Serban2022; Xue et al. Reference Xue, Zou, Ge and Wang2017), and Pearl River (He et al. Reference He, Dai, Zhai, Wang, Wang, Chen, Lin, Han and Xu2010; Wei Reference Wei2003) basins. Nonetheless, there is an urgent need to examine the long-term observation data of additional Chinese rivers. As the “central water tower” of the Yangtze and Yellow River systems in China, the Qinling Mountains have always been significant for their water reserves, which total more than 22 billion m3 and make up about one-third of the water of the Yellow River and half of the total water resources in Shaanxi (Wohlfart et al. Reference Wohlfart, Kuenzer, Chen and Liu2016; Zhao et al. Reference Zhao, Pan, Li, Zheng, Zhu, Zhang and He2020). The Tianyu River catchment, situated within the Qinling Mountains, stands out as a prominent hotspot for plant diversity within China’s temperate regions (Shen et al. Reference Shen, Zhang and Chen2001). This unique ecosystem offers an ideal setting for investigating the dynamics of river carbon cycling and carbon neutrality. Consequently, we have selected it as the focal point of our research endeavors.
This paper is the first long-term observation of rivers in the Qinling Mountains, China. By measuring river DOC concentration, dual carbon isotope values (Δ14C-δ13C) of DOC and its source end-members, the obtained results are compared and analyzed to qualitatively explain the distribution and sources of DOC, and semi-quantitatively analyze the contribution of each source end-member using Isosource software. It provides fundamental data for revealing the response of the river carbon cycle to regional climate change and is crucial to clarify the role of rivers in the global carbon cycle.
2. Location description and sampling
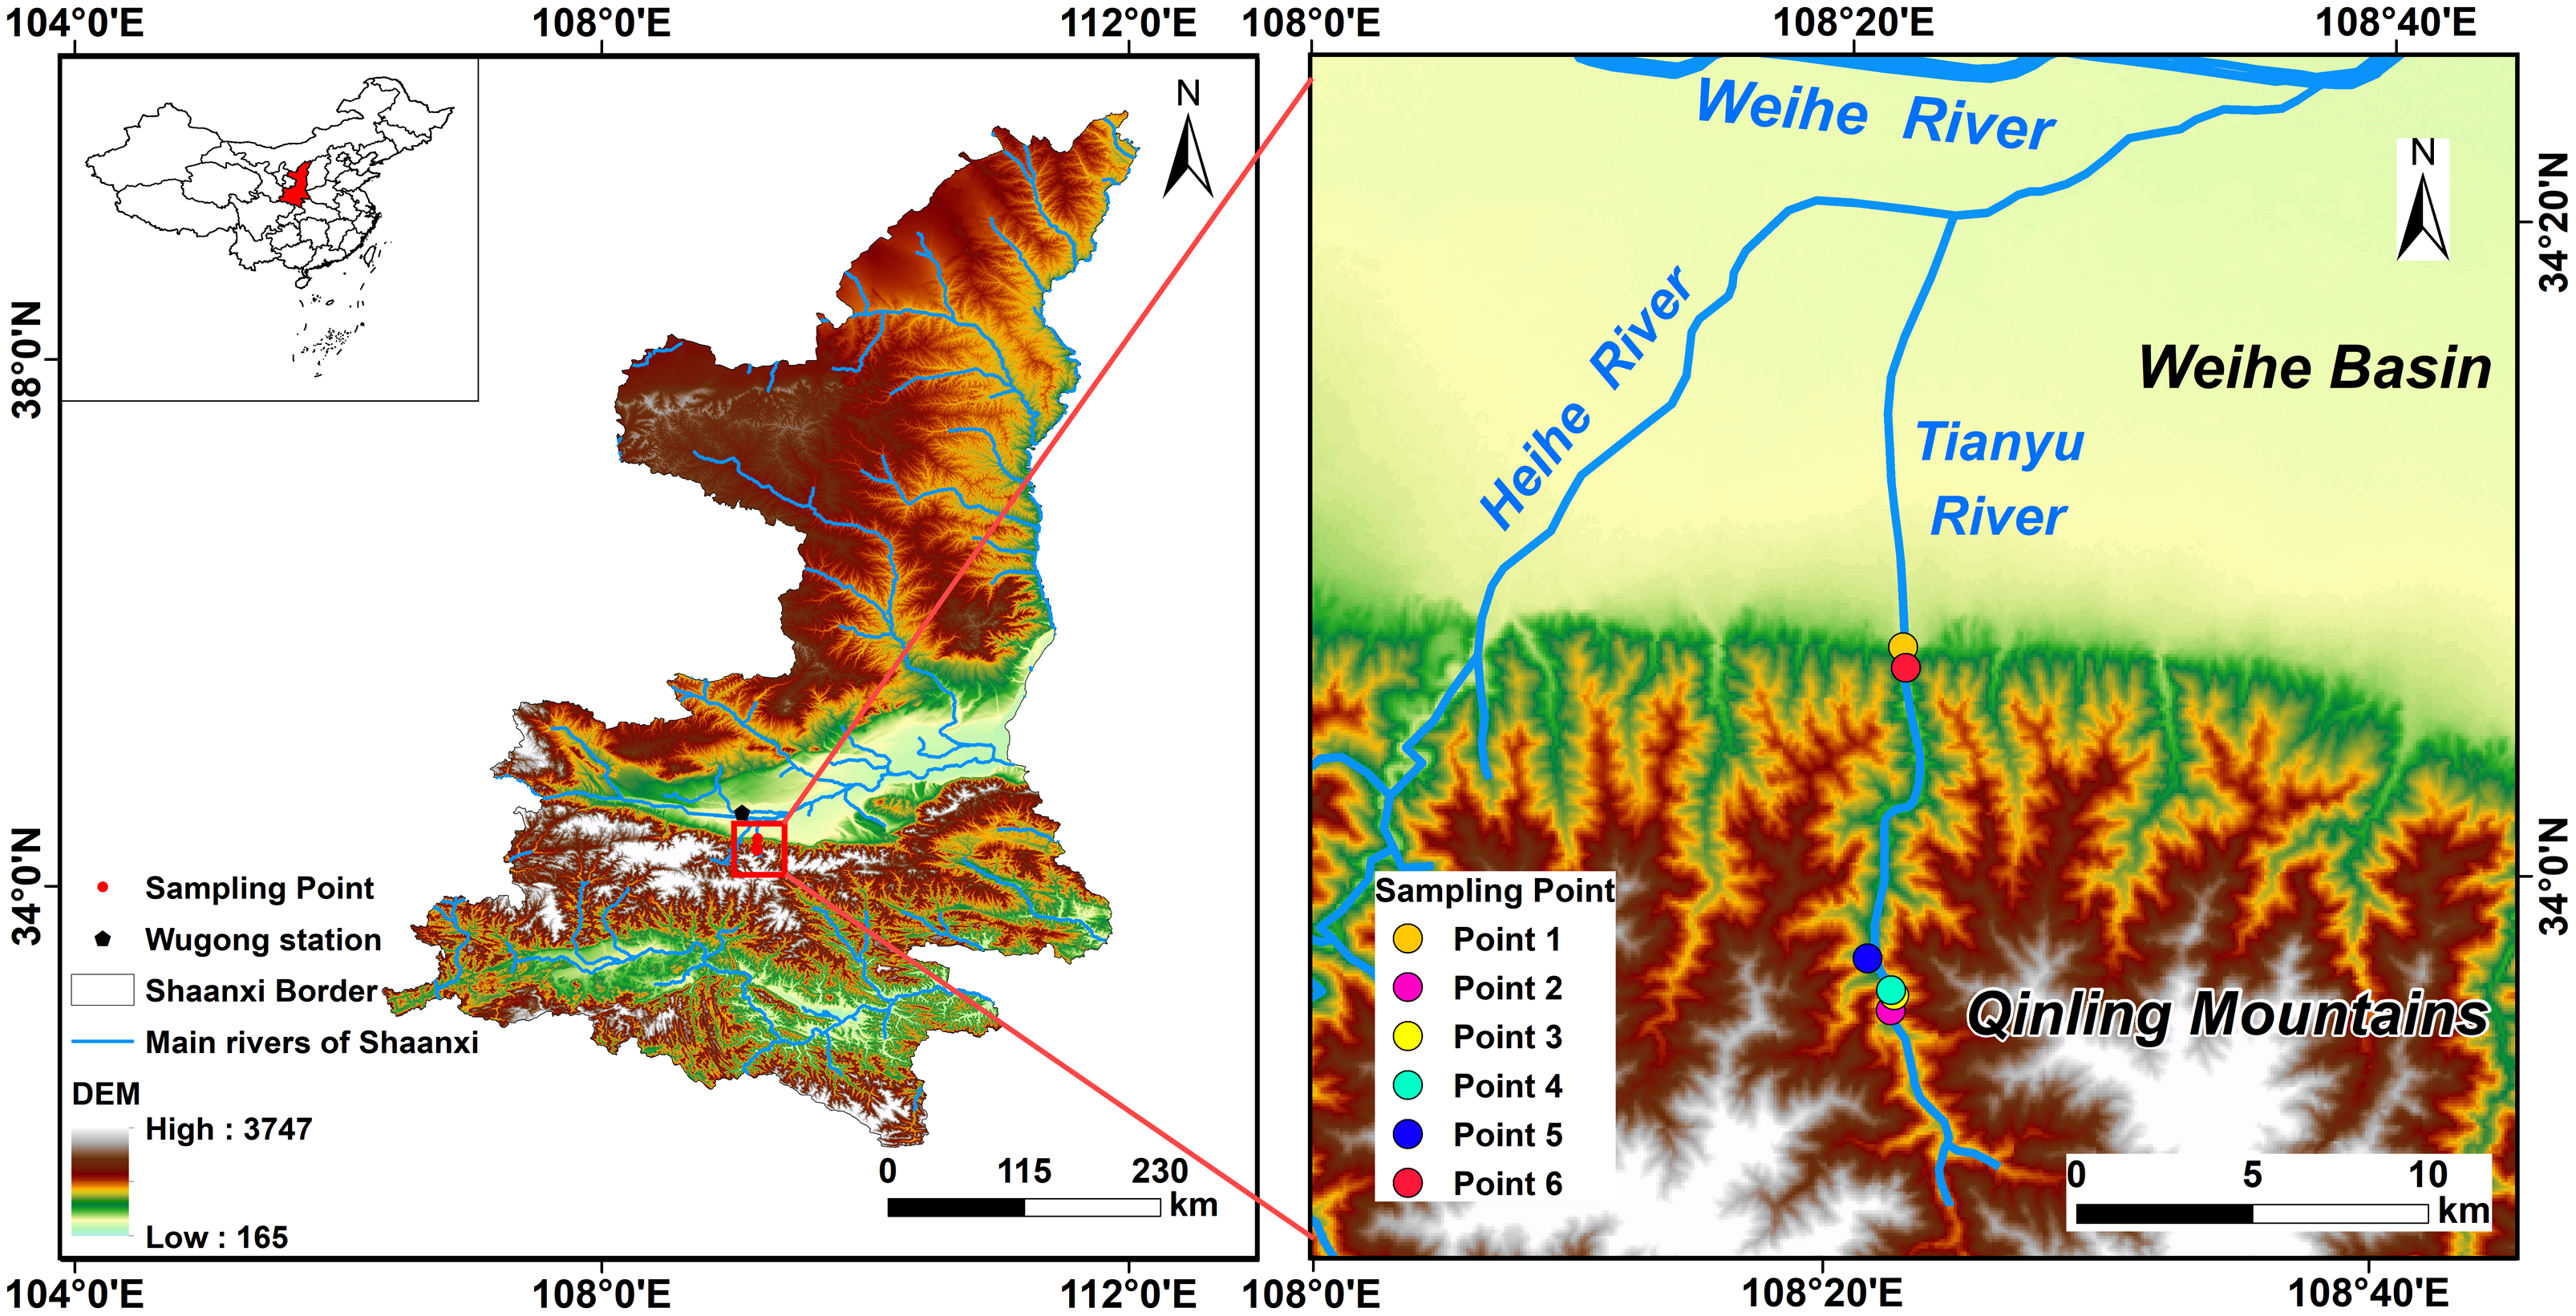
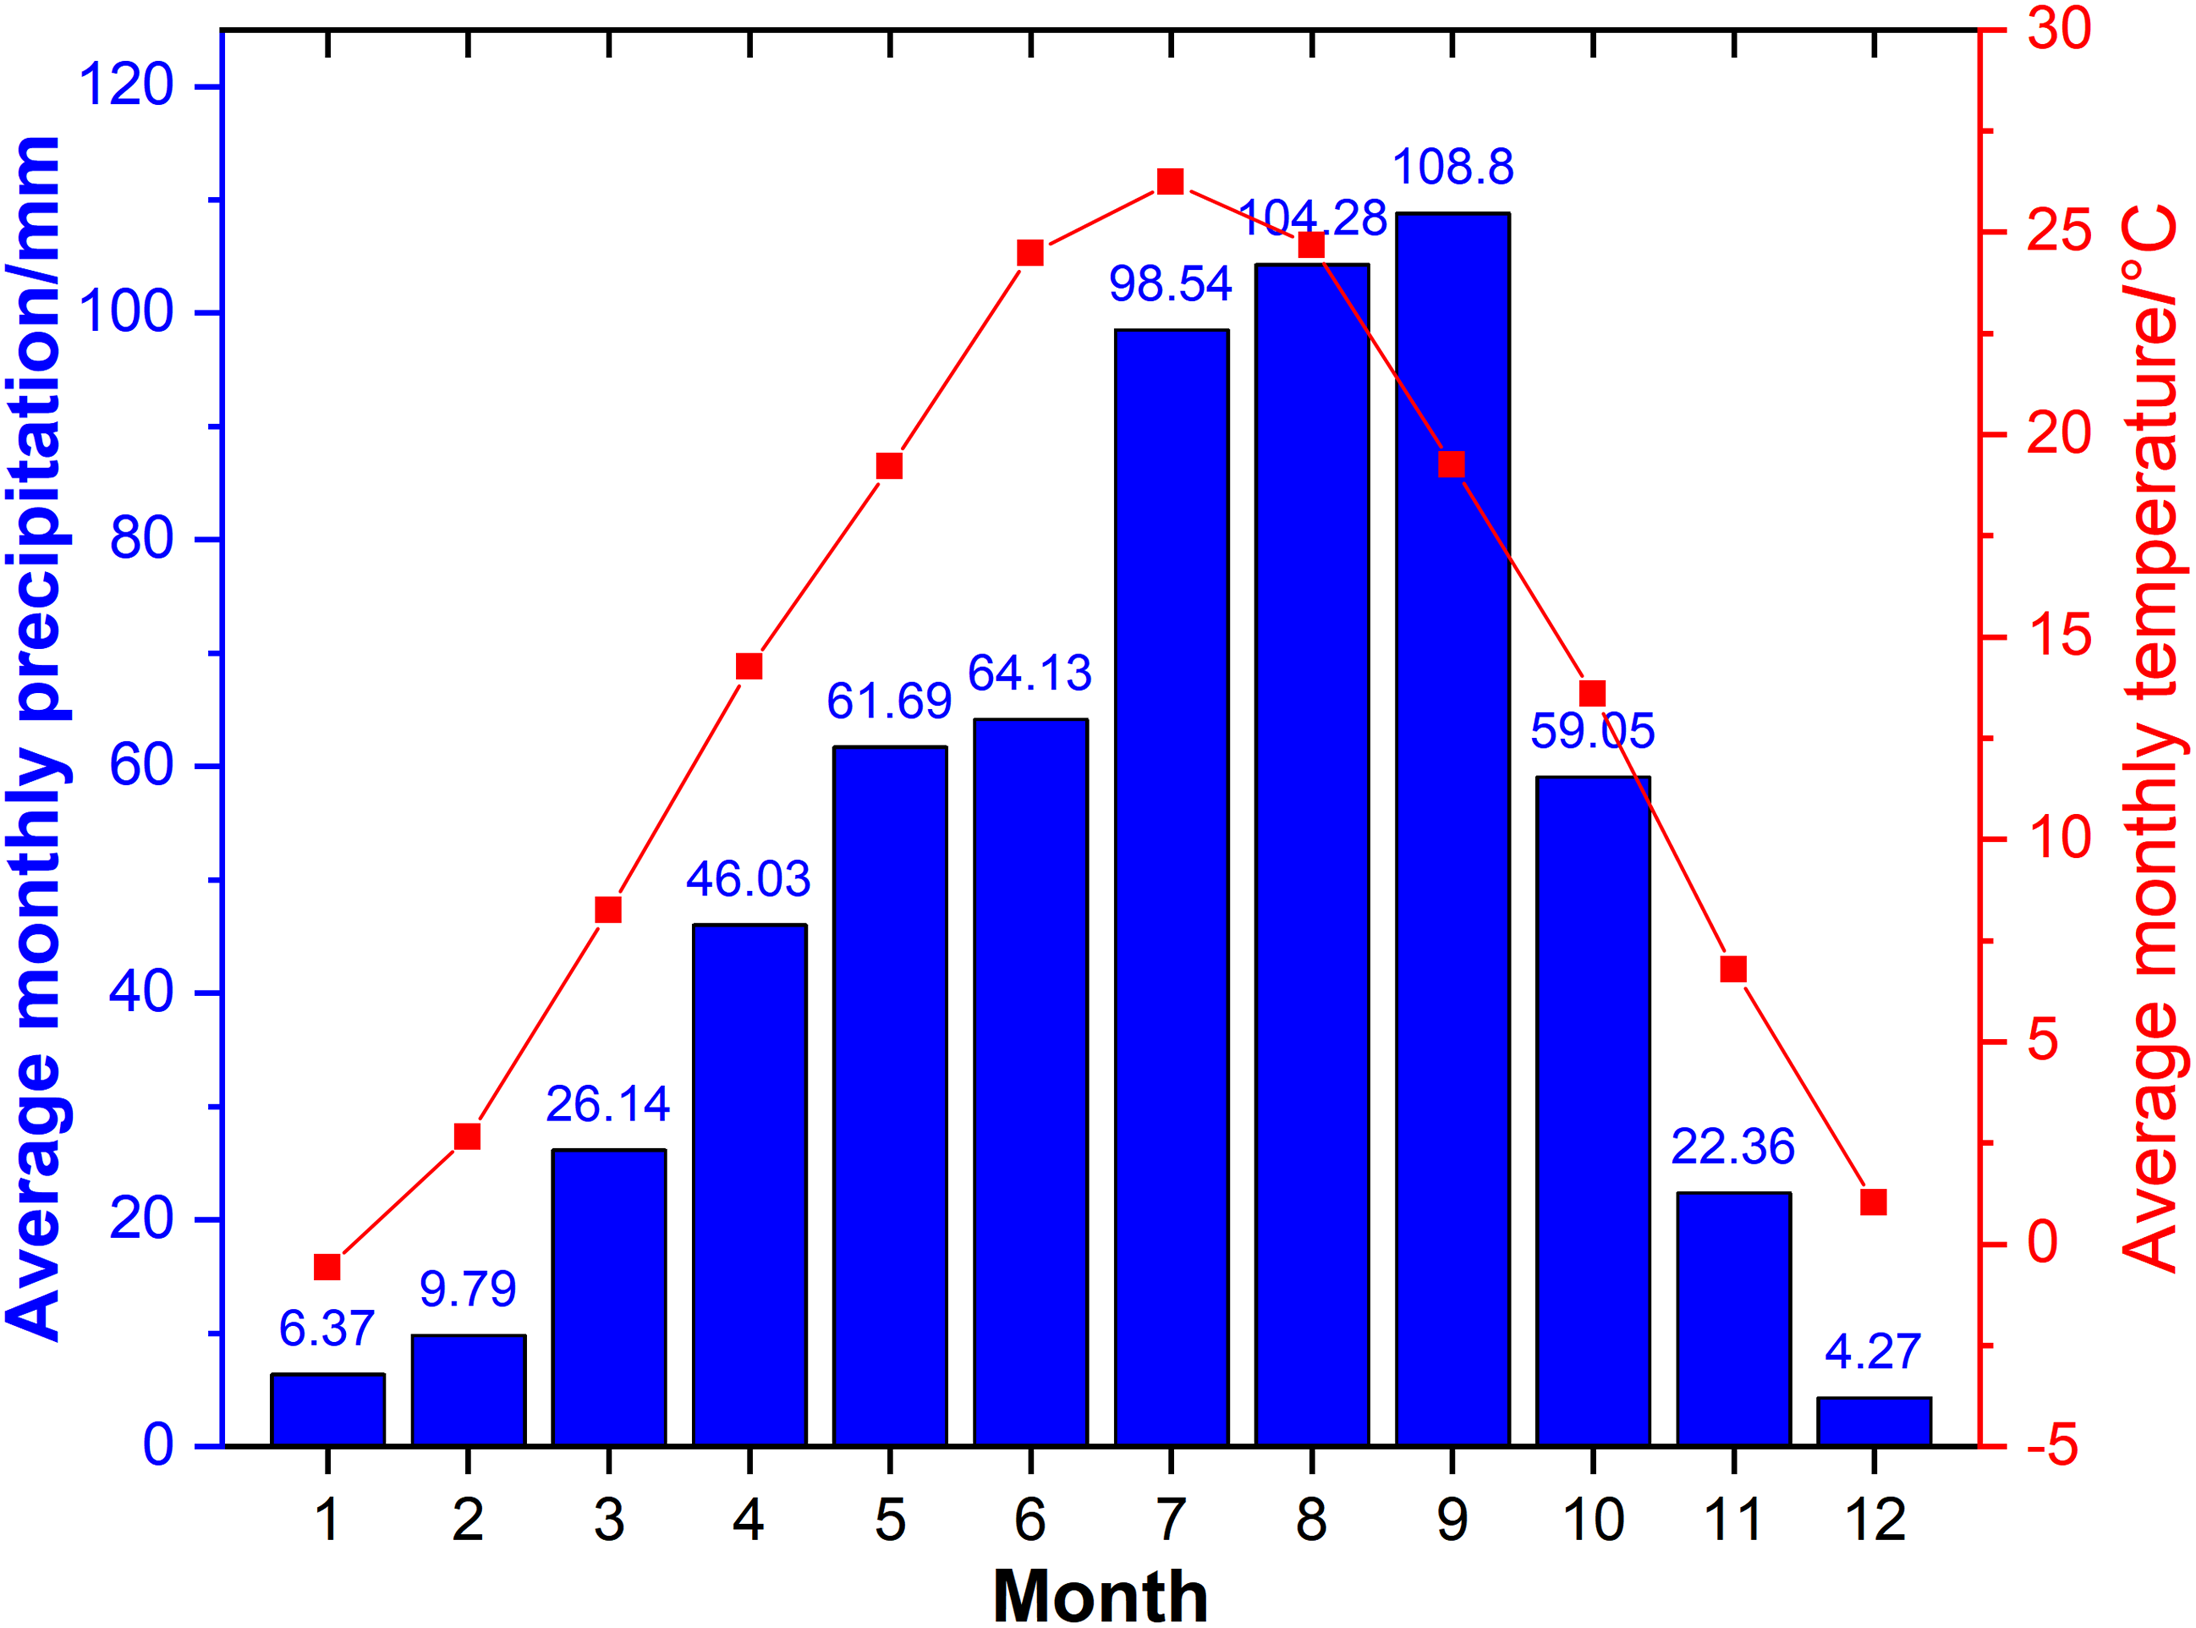
The Tianyu River in the Qinling Mountains is located in the town of Zhongnan, Zhouzhi County, Shaanxi Province, between 33°47'–34°05'N and 108°15'–108°44'E, and originates from the northern foot of the Qinling Mountains (Long Reference Long2007) (Figure 1). The watershed area is 267.6 km2, and the average annual runoff is about 109 m3 (Yang Reference Yang2012). The main river in the mountains is 36 km long, and the river outside is 12 km long. With abundant water quantity and clear water quality, it is the core area of the Qinling Botanical Garden in China. The Tianyu River is inland, and the landform type of the drainage includes plains, hills, and mountains, with the highest point having an elevation of about 2996 m, and the terrain is high in the south and low in the north (Lan Reference Lan2018) (Figure 1). The study area is at mid-latitude with a warm-temperate semi-humid continental monsoon climate. According to the records of the nearest Wugong meteorological station (1951–2020) in this study area, the precipitation distribution is very uneven in different seasons, with 70%–80% of the annual precipitation concentrated in summer and autumn, and the highest average precipitation in September, during which there are often heavy rains (Figure 2). The average annual precipitation is 600–700 mm, and the average annual temperature is 13–14°C.
Sketch map of the geographical location of the Tianyu River in the Qinling Mountains (including the distribution position of sampling points).

Average precipitation and average temperature for each month from 1951 to 2020 (Data from the nearest Wugong weather station in the study area).

Following the regional and field surveys, Sampling Point 1 was designated as a fixed location for long-term water sample collection from July 2020 to February 2022, with sampling occurring 1–2 times per month (Figure 1). Concurrently, river flow measurements were taken, and each sampling site was precisely geolocated using GPS. The obtained water samples should be transported back to the lab for filtration while being kept cool and shielded from light. To exclude the influence of external interfering carbon, filtration was performed using Whatman GF/F glass fiber membranes with a pore size of 0.7 μm that had been fired for 4 hr in a muffle furnace (temperature set to 450°C) (Yoro et al. Reference Yoro, Panagiotopoulos and Sempéré1999). Filter membrane and filtrate for further use.
End-member samples were collected from each source. River sediments (mud and sand) in the drainage basin were collected at Sampling Points 1, 2, 3, and 5 on February 23, 2022; vegetation (moss) samples were collected at Sampling Point 3; and water samples from the tributaries of Tianyu River were collected at Sampling Points 4 and 6. The specific sampling scheme is shown in Appendix Table 1.
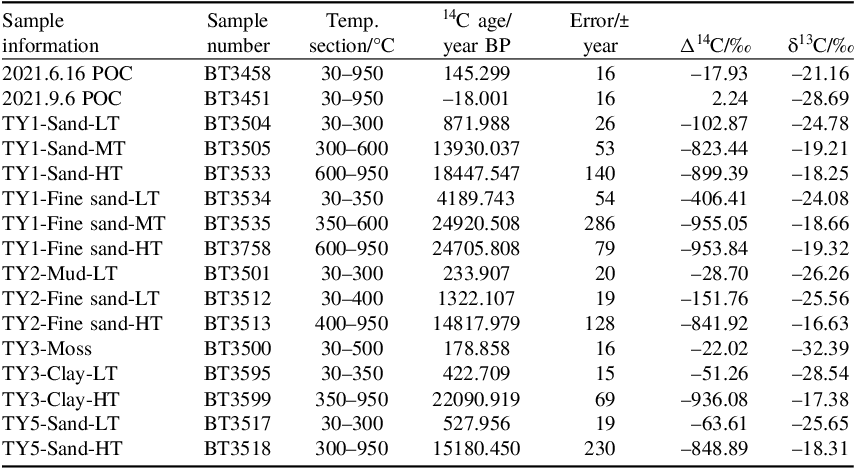
Sediment 14C age and Δ14C-δ13C characteristic values*

* LT represents the low temperature section; MT represents the medium temperature section; HT represents the High temperature section.
3. Method
3.1. Pretreatment and measurement
3.1.1. Treatment of POC in water
The IC was removed by treating the filter membrane with 50% phosphoric acid. After washing to neutral, CO2 was released using a stepped combustion device, directly heated to 950°C under vacuum conditions (10-2 torr). The carbon content was purified and recorded by the freezing method. A part of CO2 was made into a graphite target for the determination of the Δ14C value, and the other part was used to determine the δ13C value. Appendix Figure 1 shows CO2 purification, collection system, and stepped-combustion device.
3.1.2. Treatment of DIC in water
An appropriate amount of filtrate was taken and acidified by adding 85 % analytical pure phosphoric acid under vacuum conditions (10–2 torr). The generated CO2 was frozen and purified, and the CO2 gas was collected to determine the Δ14C value and δ13C value (Liu et al. Reference Liu, Zhou, Cheng and Burr2018).
3.1.3. Treatment of DOC in water
DOC in water was extracted by a wet chemical oxidation method improved by Wang (Reference Wang2020). Under vacuum conditions (10–2 torr), we used oxidant Na2S2O8 solid (purity ≥ 99.0%) and carbon-free water (Milli-Q ultrapure water treated by phosphoric acid with a purity of 85 % and Na2S2O8 solid) to extract DOC from water. The generated CO2 was purified by freezing and collected CO2 gas. The carbon amount was then recorded, along with the Δ14C value and δ13C values.
3.1.4. Treatment of river sediment samples
After picking out the grass roots in river sand and mud with clean forceps, 1 mol L–1 HCl was added and soaked in a 75°C water bath for 48 hr, during which it was shaken until the carbonate reaction was complete and no bubbles were generated, then washed with ultrapure water to neutral and dried. CO2 was obtained by heating and burning the organic components at different temperature bands using the stepped-combustion method (see section 3.2 for details), and the dual carbon isotope values were purified, collected, and determined as above.
3.1.5. Moss samples
Washed with ultrapure water, added 1 mol L–1 HCl 75°C water bath soaked for 48 hr, then washed with Milli-Q ultrapure water to neutral and dried, using the stepped-combustion method for further processing, and determine the dual carbon isotope values.
3.1.6. Determination of δ13C and Δ14C values
The δ13C values of all samples in this study were measured in a MAT-251 stable isotope mass spectrometer at the Laboratory of Stable Isotope Biogeochemistry, Institute of Earth Environment, Chinese Academy of Sciences (Liu and Xing Reference Liu and Xing2012). The measurement accuracy of δ13C is within 0.05‰. The 14C values were determined on an IonPlus 200 keV MICADAS compact 14C-specific AMS at the Xi’an Accelerator Mass Spectrometry Center with an accuracy of better than 2‰ (Zhou and Chen Reference Zhou and Chen2009; Zhou et al. Reference Zhou, Lu, Wu, Zhao, Huang, Li, Chen and Xin2007). 14C concentration is expressed as Δ14C, which means, the relative difference between the 14C radioactivity ASN obtained from the sample after correction concerning the 14C radioactivity Aabs of the international modern carbon standard (McNichol and Aluwihare Reference McNichol and Aluwihare2007; Stuiver and Polach Reference Stuiver and Polach1977).
 $$\Delta^{14}C = \left( {{{{{A_{SN}}}\over{{{A_{abs}}}}} - 1}} \right) \times 1000$$
ASN is the 14C/12C ratio obtained by isotopic fractionation correction of the actual measured values of the samples; Aabs is the 14C/12C ratio of the absolute international modern carbon standard.
3.2. Stepped-combustion method
The experimental operating system of the stepped-combustion method was obtained from the 14C laboratory of Xi’an Accelerator Mass Spectrometer Center (Cheng et al. Reference Cheng, Zhou, Wang, Lu and Du2013; Cheng et al. Reference Cheng, Burr, Zhou, Chen, Hou, Du, Fu and Lu2020; Cheng and Fu Reference Cheng and Fu2020) (Appendix Figure 1). The operation process can be briefly described as two steps: (1) Combustion of OM in sediments and the drawing of thermal analysis diagrams. An appropriate amount of sample was placed in a vacuum system and high-purity oxygen (99.999) was introduced. The ramp-up procedure was followed from 50°C to 950°C at 10°C min–1. The CO2 was exported from the PRI-501 infrared CO2 gas online analyzer, and a thermal analysis curve spectrum was drawn with CO2 concentration as the vertical coordinate and temperature as the horizontal coordinate (Rosenheim et al. Reference Rosenheim, Day, Domack, Schrum, Benthien and Hayes2008). (2) Stepped-combustion and measurement of dual carbon isotope values. According to the relative positions of CO2 concentration peaks in the thermal analysis map of sediment OM drawn in the previous step, they were divided into corresponding temperature bands. The CO2 gas was collected by combustion, and the Δ14C value and δ13C value were measured after freezing and purification.
The thermal analysis diagrams (Appendix Figure 2a–d) were drawn for some of the sediments that underwent stepped combustion as an example. The specific division schemes of different temperature ranges are shown in Appendix Table 2.
Average contribution ratio of the six-source end-members of the Tianyu River DOC in the Qinling Mountains

3.3. IsoSource software semi-quantitative calculation method
The carbon isotope values of DOC and the carbon isotope values (Δ14C-δ13C values) of each potential source end-member of the water column in the study area were entered into IsoSource software for calculation, which is based on the principle of isotopic mass balance for the analysis of combinations of multiple isotopes (Phillips Reference Phillips2001; Phillips et al. Reference Phillips, Inger, Bearhop, Jackson, Moore, Parnell, Semmens and Ward2014). The software will superimpose all possible percentage combinations of each potential source end-member according to the initially set increment range (Increment), and the weighted average of each combination is compared with the actual measured isotopic values of the mixture (DOC), and the combinations that are within the set tolerance range (Tolerance) (0.01‰–0.05‰) are considered as feasible solutions. Among all feasible solutions, the frequency of occurrence of the percentage contribution of each source end-member was analyzed to obtain the optimal solution.
4. Results
4.1. DOC concentration and carbon isotope distribution characteristics
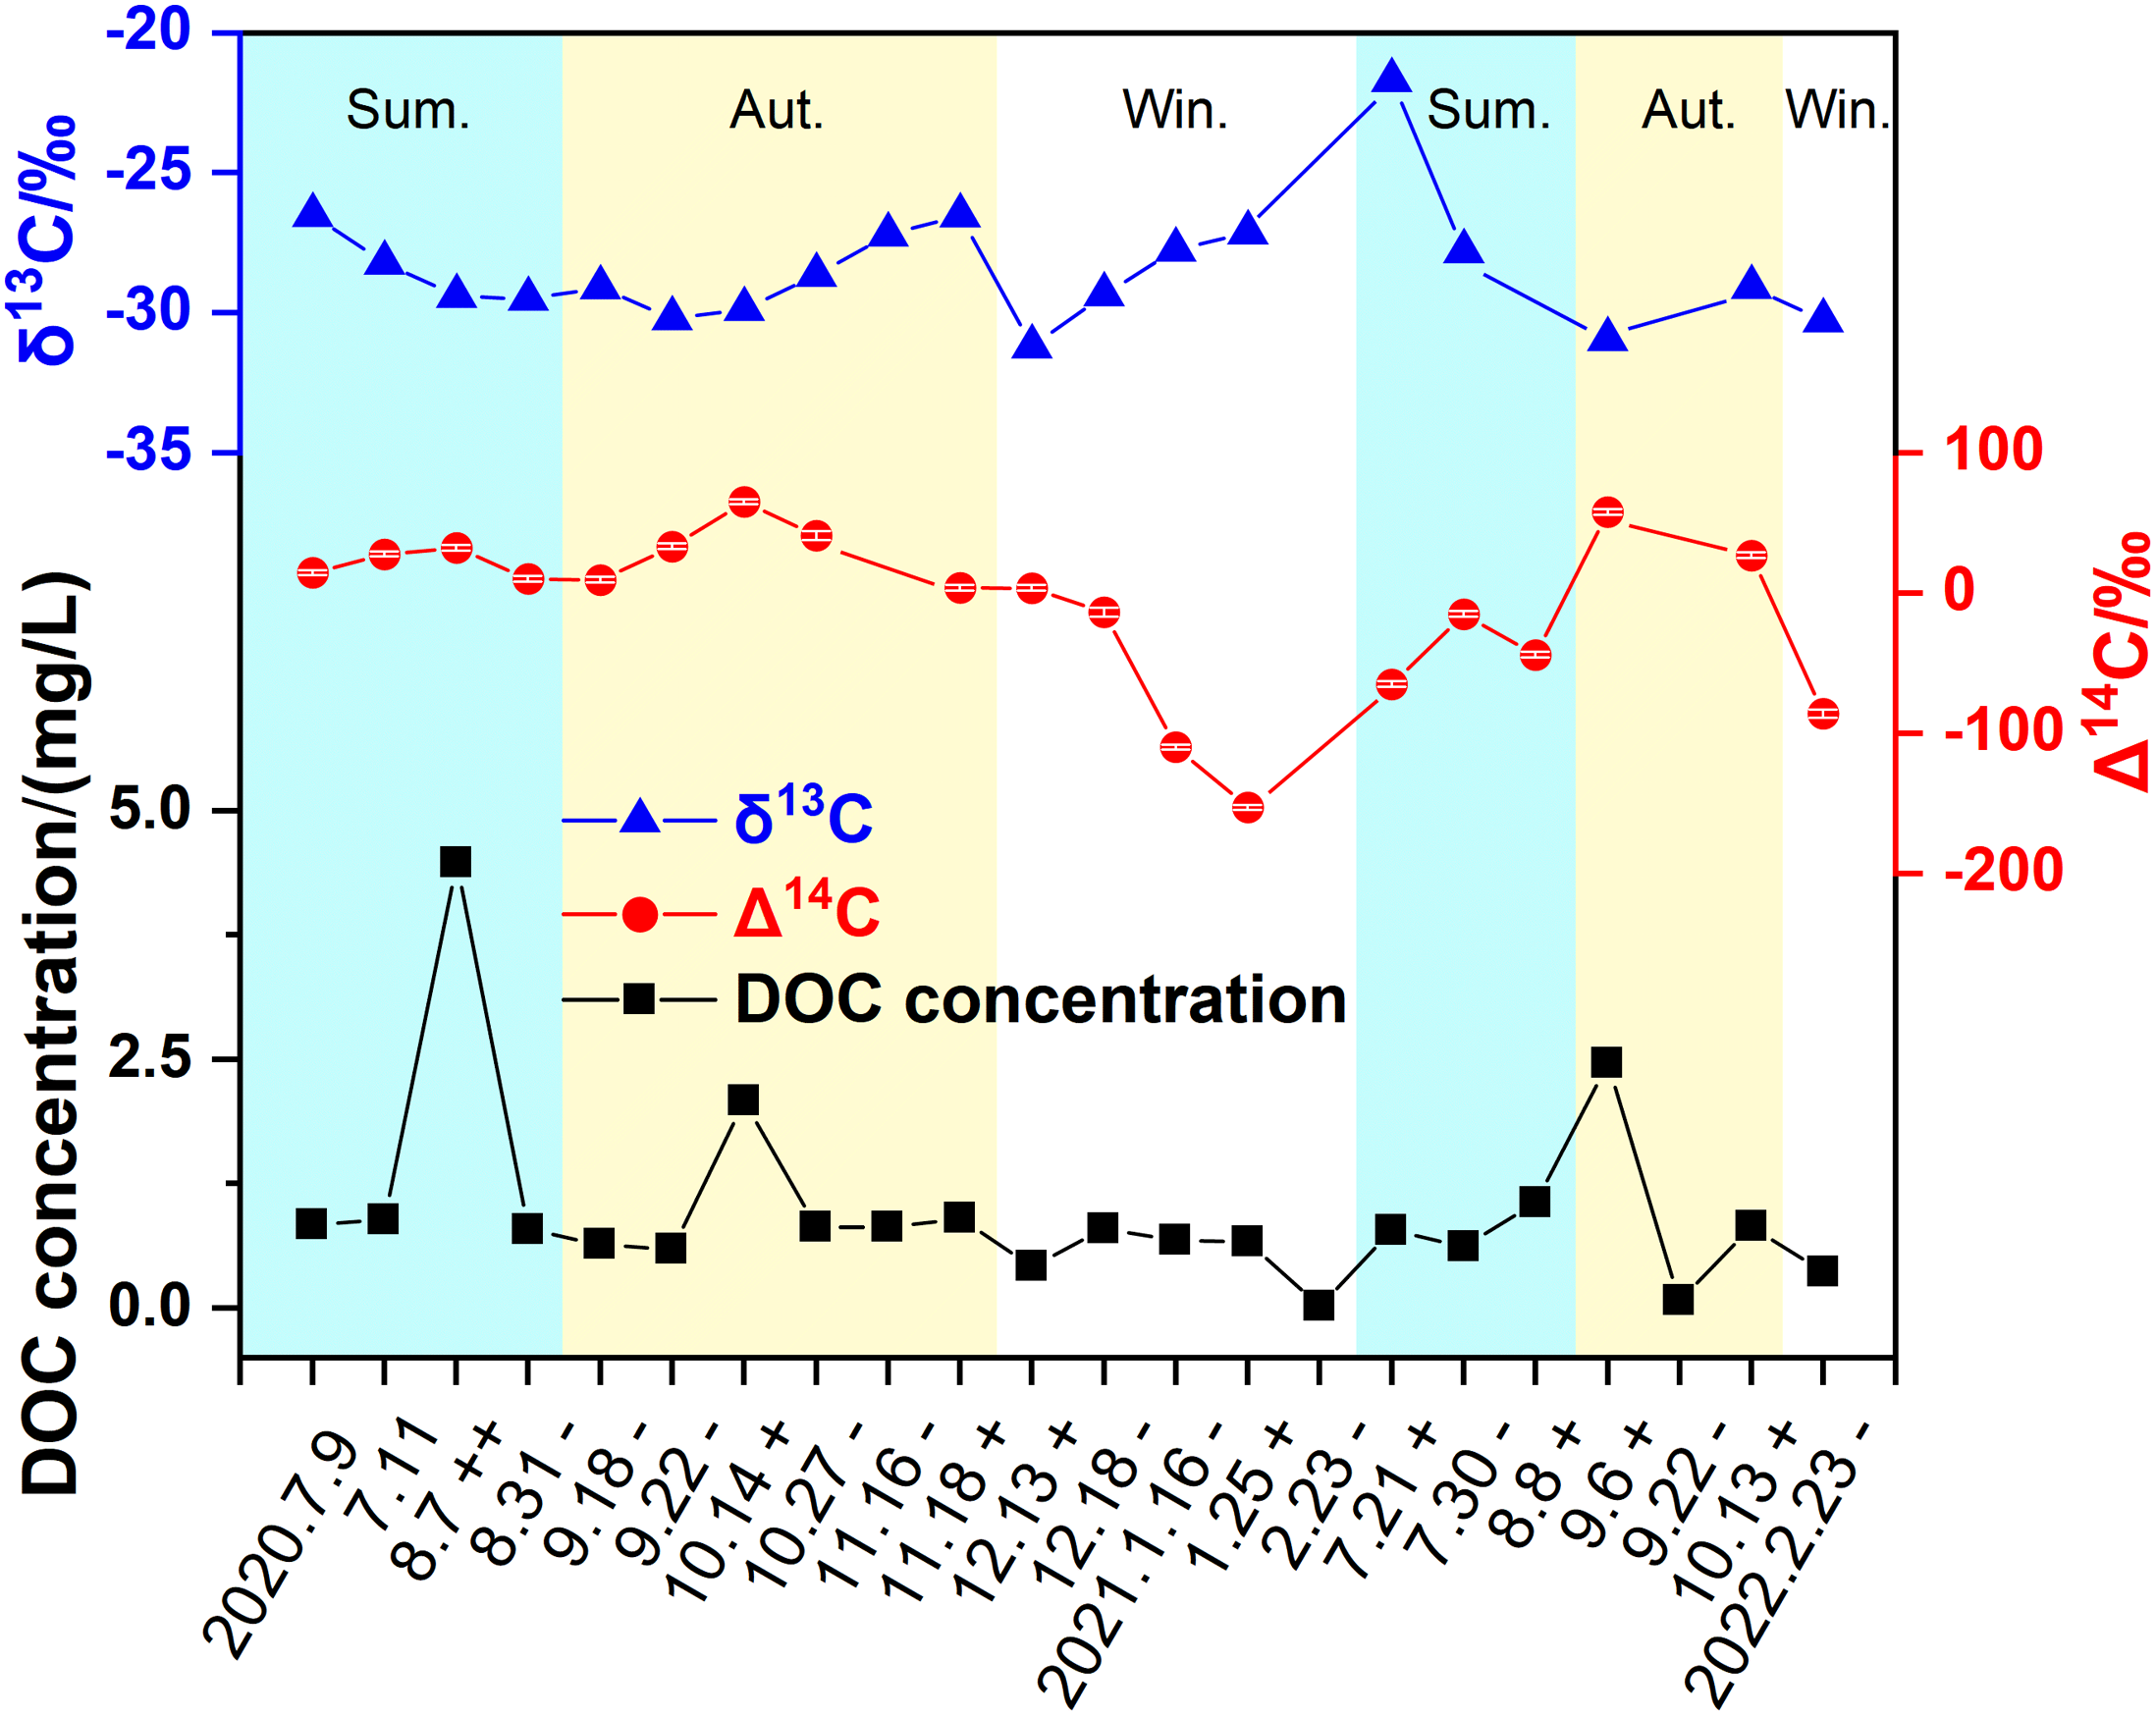
The distribution of DOC concentration and carbon isotope characteristic values in the Tianyu River in the Qinling Mountains is seasonal. The DOC concentration of the water bodies in the study area was highly variable, and the average DOC concentration of the Tianyu River was about 1.17±1.12 (1σ) mg/L in 2020 (including summer, autumn, and winter), which was higher than 0.80±0.71 (1σ) mg/L in 2021.
The DOC concentration in the river was generally higher in summer and autumn than in winter in the Tianyu River of Qinling. The average summer DOC in the Tianyu River in 2020 was about 1.75±1.82 (1σ) mg/L, which was 0.93 mg/L higher than that in 2021 (0.82±0.22 mg/L); the average autumn DOC in 2020 was about 0.97±0.56 mg/L, which was 0.15 mg/L lower than that in 2021 (1.12±1.22 mg/L); the winter DOC (September 2020 to February 2021 and February 2022) averaged 0.52±0.31 mg/L and 0.36 mg/L, respectively (Figure 3).
Seasonal variation of DOC concentration—Δ14C value – δ13C value in Tianyu River, Qinling Mountains. The horizontal coordinate ++ indicates flood; + indicates rain; – indicates no rain; black solid squares indicate DOC concentration; red solid circles indicate DOC Δ14C value; blue solid triangles indicate DOC δ13C value.

The overall distribution of stable carbon isotope δ13C eigenvalues of the Tianyu River DOC was less different but still showed a trend of gradually becoming negative from summer to winter. The mean δ13C values of the river DOC in the summer, autumn, and winter of 2020 and 2021 were not very different, about –28.80‰ and –27.40‰, respectively. From summer to winter in 2020, the δ13C values of river DOC varied less, while the seasonal variation of δ13C values of river DOC in 2021 was relatively significant, with δ13C characteristic values of –24.74‰, –30.01‰ and –30.27‰ from summer to winter, respectively (Figure 3).
The characteristic radiocarbon Δ14C values of river DOC not only had seasonal fluctuations but also showed complexity. Overall, the Δ14C values of water DOC in summer and autumn were remarkably positive compared with winter Δ14C values, and more positive in autumn (Figure 3). The average Δ14C values of river DOC in summer, autumn, and winter were about 20.79‰ and –43.11‰ in 2020 and 2021, respectively. The Δ14C value of the Tianyu River DOC in 2020 was about 21.35‰ in summer and 28.02‰ in autumn and was notably negative in winter (December 2020 to February 2021), about –68.20‰. The Δ14C value of DOC in summer 2021 was about –41.33‰, while it was positive in autumn, about 42.57‰, and in winter (February 2022), –86.40‰. The Δ14C value of DOC of the water body collected at the tributary of point 4 on February 23, 2022, was –29±3‰, and the Δ14C value of DOC of the tributary of the waterfall at point 6 was –23.82±2‰. In addition, we believed that the overall significant positive Δ14C value of the average DOC in 2020 indicated a strong nuclear explosion signal, which increased the complexity and unreliability of the quantitative tracing, so the subsequent quantitative calculations were mainly based on the period since 2021.
4.2. Isotopic composition of DOC and each source end-member
The potential endogenous includes DIC and POC end-members, and the latent exogenous includes river sediments, plant debris and remains, and the contribution of each tributary, using the Qinling Tianyu River DOC as a mixed end-member. Due to the complexity of the sediment end-member, it was gradually heated and burned, and the carbon released during combustion at low temperatures and medium/high temperatures was then further separated into various end-members. The results are presented in detail (Table 1). It should be noted that the Qinling Tianyu River is one of the water sources for drinking water sources in Shaanxi Province, which has a weak level of human activity. Therefore, we have not assumed that human activities have little impact on carbon sources.
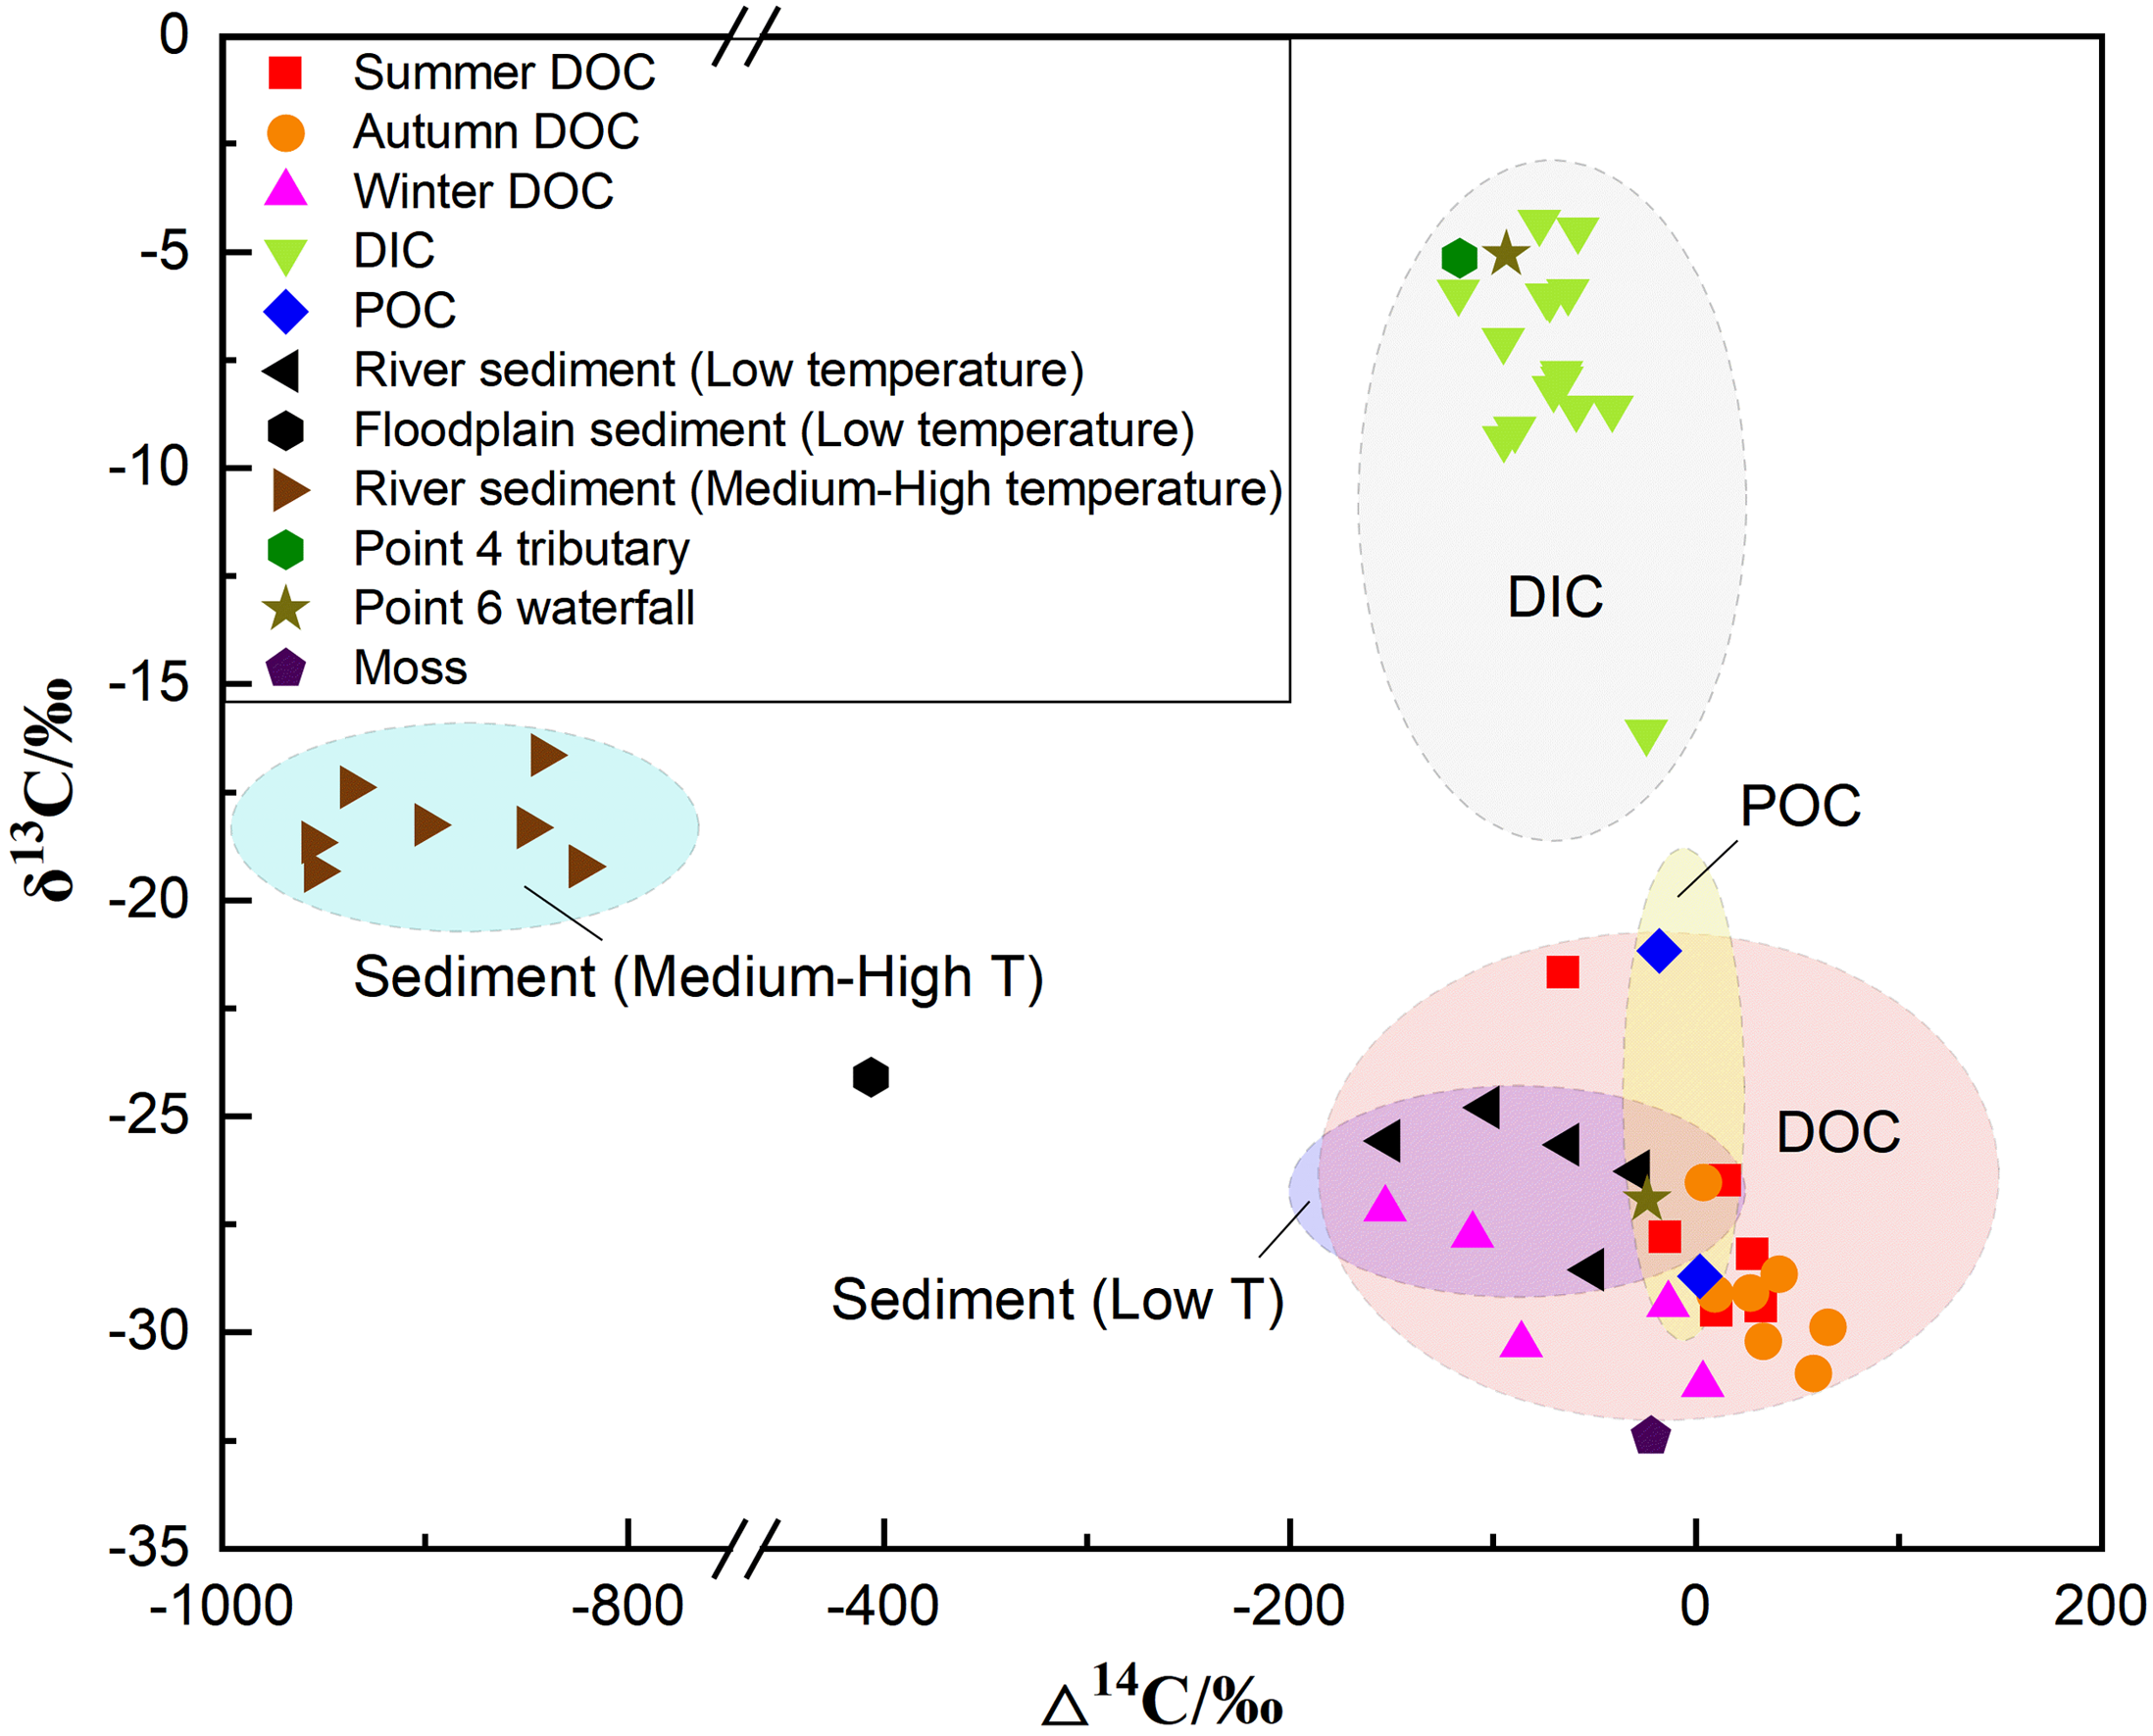
From January 2021 to February 23, 2022, the Δ14C values of DOC in the Tianyu River of the Qinling Mountains were between –152.67‰ and 58.29‰, with an average of –48.52‰, and the δ13C values ranged from –30.94‰ to –21.69‰, with a mean value of –27.81‰. The Δ14C values of DIC end-member in the Tianyu River ranged from –117.10‰ to –54.05‰ and δ13C values ranged from –15.83‰ to –2.89‰, with mean values of –76.65‰ and –6.65‰, respectively. Furthermore, the mean values of DIC end-member Δ14C and δ13C were –61.28‰ and –8.79‰ in summer, –79.05‰ and –7.97‰ in autumn, and –117.10‰ and –4.56‰ in winter, respectively. The mean values of carbon isotopes (Δ14C and δ13C) of the POC end-member in Tianyu River were separate –7.84‰ and –24.92‰.
The Δ14C values of low-temperature burning of river sediments ranged from –151.76‰ to –28.70‰, and the δ13C values were between –28.54‰ and –24.78‰, with mean values of –79.64‰ and –26.16‰, respectively; the Δ14C and δ13C values of low-temperature combustion of floodplain sediments were respectively –406.41‰ and –24.08‰; the Δ14C values of high-temperature combustion in sediments ranged from –955.05‰ to –823.44‰, with an average of –894.09‰, and the δ13C values ranged from –19.32‰ to –16.63‰, with the mean value of –18.25‰. The Δ14C and δ13C values of the moss samples were separate –22.02‰ and –32.39‰. Additionally, the dual carbon isotope values of DIC in the Point 4 tributary and DOC and DIC in the Point 6 waterfall tributary were shown in Appendix Tables 4 and 6. The mean values of Δ14C and δ13C for tributary DOC were respectively calculated to be –23.82‰ and –26.92‰. The tributary DIC were –104.83‰ and –5.08‰, respectively.
5. Discussion
5.1. The seasonal variability of DOC concentrations and carbon isotopes
Variations of DOC concentrations are influenced by annual mean precipitation, vegetation type, soil type, permafrost degradation, and river size (Chaplot and Mutema Reference Chaplot and Mutema2021; Liu and Wang Reference Liu and Wang2021). The DOC concentrations in global rivers exhibit significant variability, with an average of 10.4 mg/L (Liu and Wang Reference Liu and Wang2021). Specifically, in China, the DOC concentrations in the Yangtze and Yellow Rivers—two of the largest rivers by basin area—range from 0.7 to 10.1 mg/L and 1.6 to 12.4 mg/L, respectively (Lai et al. Reference Lai, Zhong, Wang, Yi, Chen and Xu2021). While the DOC concentration of the Tianyu River in the Qinling Mountains (0.02–4.48 mg/L) was much lower than the world average, indicating that the watershed area or river size played a non-negligible role in controlling the total DOC concentration. In addition, the average concentration of DOC in Tianyu River showed significant seasonal variation, and the concentration in summer and autumn was generally higher than that in winter. This may indicate that river DOC is regulated by regional climate factors (precipitation and temperature) to a certain extent (Borken et al. Reference Borken, Ahrens, Schulz and Zimmermann2011; Couture et al. Reference Couture, Houle and Gagnon2012; Lee et al. Reference Lee, Hsu, Lee, Shih, Lin, Jien, Hein, Zehetner, Shiah and Huang2019). Wei et al. (Reference Wei, Li, Shen and Guo2011) believed that the large amounts of dead leaves in the valley during the flood season flooded into the river and decomposition led to extremely high values of DOC concentration in the river. Consistent with previous studies, the DOC concentration in rivers is generally higher during rainfall events compared to periods without rain (Figure 3). The most representative one was on August 7, 2020, when the DOC concentration of the collected flood samples was as high as 4.48 mg/L, much higher than the DOC concentration in other months. The next highest value was on September 6, 2021, which also met the conditions of abundant precipitation. Precipitation in the study area predominantly occurs during the summer and autumn months, providing favorable conditions for the growth of most vegetation. The availability of OM is ample, and rainwater effectively transports significant quantities of OM to the river system (Dosskey and Bertsch Reference Dosskey and Bertsch1994; Zhang Reference Zhang2012). In contrast, winter conditions characterized by lower temperatures, reduced precipitation, diminished surface runoff, and decreased vegetation cover collectively limit the transport of organic carbon to the river. Chen et al. (Reference Chen, Zhong, Li, Liu, Wang, Xu and Li2021) observed a positive correlation between DOC concentrations and runoff in the Minjiang River, which originates from the Qinghai-Tibet Plateau. This relationship was attributed to a pronounced flushing effect, whereby substantial quantities of soil organic carbon (SOC) are mobilized and transported into the river system. Consequently, the 'flushing effect’ induced by precipitation in this study area, potentially serves as the primary driver of seasonal variations in DOC concentration in the water body (Gao et al. Reference Gao, Shen, Sun and Yi2001; Yadav and Pandey Reference Yadav and Pandey2017). Meanwhile, temperature fluctuations may act as an indirect factor influencing these changes in DOC concentration (Zhang Reference Zhang2008).
In view of the carbon isotope characteristics of DOC in the Tianyu River, we found that the δ13C-DOC values are distributed between –31.20‰ and –21.69‰, which is slightly positive compared with the δ13C-DOC values of world rivers (–30‰ to –25‰) (Marwick et al. Reference Marwick, Tamooh, Teodoru, Borges, Darchambeau and Bouillon2015). However, the Δ14C-DOC values are distributed between –152.67‰ and 65.25‰ and are at a relatively old level in the concentrated distribution of Δ14C-DOC values (–200‰ to 200‰) in world rivers (Marwick et al. Reference Marwick, Tamooh, Teodoru, Borges, Darchambeau and Bouillon2015). Additionally, the distributions of δ13C and Δ14C in China’s Yellow, Yangtze, and Pearl Rivers were comparable (between –29.0‰ to –24.7‰ and –264‰ to –50‰, respectively) (Shan et al. Reference Shan, Qi, Luo, Fu, Xue and Wang2020). In contrast, the δ13C-DOC values of the Tianyu River did not significantly differ from the world average or the three major rivers in China. However, the Δ14C-DOC value is older at the world level, while it is significantly positive in Chinese rivers, and the carbon age is relatively young.
Furthermore, while the δ13C-DOC values of the river exhibited relatively minor variations, they demonstrated a gradual negative trend from summer to winter. This seasonal shift may be influenced by the turnover of vegetation types at different temperatures, potentially altering the δ13C values of OC transported to the river (Gu et al. Reference Gu, Liu, Xu, Han, Yang, Ding and Liu2003; Hanba et al. Reference Hanba, Kobayashi and Enomoto2010; Yamori et al. Reference Yamori, Hikosaka and Way2014). However, the seasonal variation in the characteristic value of DOC Δ14C of water was more sensitive to the response of precipitation, with the most precipitation in autumn relative to other seasons. The results further indicated that the Δ14C value of DOC in autumn was the highest, followed by that in summer. During winter, reduced precipitation, diminished surface runoff, and decreased vegetation cover result in lower plant-derived carbon inputs. Moreover, the resuspension of older river sediments may be the main reason for the negative value of DOC Δ14C in winter (Raymond and Bauer Reference Raymond and Bauer2001b; Lal Reference Lal2013). In addition, we found that, unlike DOC concentration, the occurrence of flood events (August 7, 2020, and September 6, 2021) did not cause significant changes in the dual carbon isotope values. We speculate that this is due to the better protection of vegetation in the Qinling Mountains in summer and autumn. Floods did not cause a large-scale loss of soil old carbon (Hamilton Reference Hamilton1992; Swift Reference Swift2001). The above demonstrated that regional climatic variations were the main cause of changes in DOC concentration and carbon isotope composition of water (Zhang Reference Zhang2008, Reference Zhang2012).
5.2. Analysis of DOC sources
5.2.1. Sources of river sediments
As one of the main sources of river DOC, the composition of river sediment needs to be further subdivided. According to the difference in thermal stability of OM components, the OM of river sediments was ramped combustion according to the temperature section divided by the thermal analysis diagram and further divided into relatively stable components and relatively active components. The 14C dating of the various components reveals that the very active components burned at low temperatures were relatively young—only a few hundred or thousands of years—and might represent the most recent turnover/exchange time of OC in river surface sediments as of the present (Table 1). It is preliminary determined that plant and degradable soil OM may be the main source of low-temperature components when combined with earlier research findings (McGeehin et al. Reference McGeehin, Burr, Hodgins, Bennett, Robbins, Morehead and Markewich2004; Wang et al. Reference Wang, Hackley, Panno, Coleman, Liu and Brown2003, Reference Wang, Burr, Wang, Lin and Nguyen2016). On the contrary, the age of the relatively stable components burned at medium/high temperatures was older, about 13–25 ka BP (Table 1), which might represent the time when the OM from the pre-aged soil was protected by mineral/biological matrix (Hemingway et al. Reference Hemingway, Rothman, Grant, Rosengard, Eglinton, Derry and Galy2019; Repasch et al. Reference Repasch, Scheingross, Hovius, Lupker, Wittmann, Haghipour, Gröcke, Orfeo, Eglinton and Sachse2021) or the time when the OC was separated from the parent rock/weathering crust, that is, the earlier turnover/exchange time (Cheng et al. Reference Cheng, Dong, Zhou, Song, Zhou, Fan, Lan, Xian, Hou and Chen2022).
The carbon isotope values of sediment samples analyzed without stepped combustion were excessively negative, resulting in an apparent older age. Our findings align with the report by Rosenheim and Galy (Reference Rosenheim and Galy2012), which highlights the complex age structure of OC in river-suspended sediments, resulting from the mixing of young, biologic OC and aged, petrogenic OC. This discrepancy can introduce significant deviations in the calculation of the source contribution ratio. Therefore, it is crucial to consider the relatively reactive OC released during the low-temperature combustion of soil and river sand samples as a distinct source of riverine DOC.
5.2.2. DOC sources
The Δ14C and δ13C characteristic values of the mixed end-member DOC and its various potential source end-members were plotted as a scatterplot (Figure 4), from which it could be seen that the Δ14C values showed a trend of winter < summer < autumn, while the distribution of δ13C values of river DOC was relatively concentrated. The distribution of Δ14C-δ13C values of DIC end-members in the mainstream, tributary Point 4 and Point 6 waterfall of the Tianyu River were also more concentrated, with δ13C values being positive relative to the DOC of the water body and Δ14C values being slightly negative, suggesting that they might make a small contribution to the DOC of the water. One of them stood out because the dual carbon isotope values of the DIC in the flood sample on August 7, 2020, were extremely similar to the carbon isotope values of the DOC of the river, and the proportion of its contribution was assumed to be greater than that of the other months. In addition, the sediments (TY1 fine sand) taken from the floodplain were utilized as independent end-members for the low-temperature combustion components.
Distribution of DOC sources in Tianyu River, Qinling Mountains

The Δ14C values of the sediment (medium/high-temperature section) end-member were far more negative than the mixed end-member, and the δ13C values were also positive, confirming that the carbon released from the combustion of sediment under medium/high-temperature conditions made almost no contribution to the water DOC, so it was not added to the quantitative calculation of the contribution ratio.
The carbon isotope values (Δ14C-δ13C) of DOC in the study area since 2021 and the carbon isotope values of each potential source end-member were input into IsoSource software, with an incremental range of 1% and a tolerance range of 0.05‰. In all feasible solutions, the frequency of each end-member contribution percentage was examined to obtain the optimal solution.
The sources of riverine DOC were categorized into six end-members: summer DIC, autumn DIC, winter DIC, POC, moss, and river sediment (low-temperature section), where the average contribution of exogenous sources—moss samples and river sediment (low-temperature section)—was as high as 49.0% and 39.4%, respectively, accounting for 88.4% (Table 2). Among the endogenous sources, the average contribution of POC was 4.6%, and the contribution of DIC in summer, autumn, and winter was separately 2.5%, 2.3%, and 2.3% (Table 2).
Furthermore, the river DOC sources were classified into seven end-members: DIC, POC, moss, river sediment (low-temperature section), floodplain sediments (low-temperature section), tributary DOC, and tributary DIC (Table 3). Compared to Table 2, the DIC end-member was combined and the floodplain sediment end-member and confluent tributary end-member were added. Among them, the endogenous sources DIC and POC contributed 3.1% and 11.1% on average; while the exogenous sources contributed 85.8% in total, moss contributed 47.9%, river sediment (low-temperature section) contributed 15.2%, floodplain sediment (low-temperature section) contributed 3.9%, tributary DOC contributed 15.8%, and tributary DIC only accounted for 3.0%. Because of the addition of the floodplain sediment end-member and the tributary end-member, the percentage contribution of bryophytes, river sediment, and DIC end-member relatively decreased, while the percentage contribution of POC increased.
Average contribution ratio of the seven-source end-members of the Tianyu River DOC in the Qinling Mountains*

* LT represents the low temperature section.
In summary, the data indicated that the DOC in the Tianyu River of the Qinling Mountains mainly came from exogenous sources, and the contribution ratio was between 85.8% and 88.4%. The OC produced by plants and the relatively active and exchangeable carbon produced by low-temperature combustion of sediments were the key sources, and most of the carbon produced by low-temperature combustion of sediments came from young bio-organic matter (Rosenheim and Galy Reference Rosenheim and Galy2012). Vegetation coverage and regional climate change in the Qinling Mountains were major factors affecting the concentration, behavior, and source of DOC in rivers. Shan et al. (Reference Shan, Qi, Luo, Fu, Xue and Wang2020) identified modern vegetation as the predominant source of DOC in four major Chinese rivers: the Yangtze, Yellow, Pearl, and Heilongjiang. This carbon is prone to rapid degradation, resulting in a relatively short residence time within aquatic systems. Our findings corroborate this observation, demonstrating that river DOC primarily comprises young organic carbon derived from contemporary plant material. When biological OC enters the mountain river system, it is first used by aquatic organisms and discharged into the atmosphere. After that, it is used by terrestrial plants and, after the plants have decomposed and wilted, delivered to the rivers. According to this model, carbon emissions can be limited and will not explicitly affect the ecosystem (Srivastava et al. Reference Srivastava, Shetti, Reddy, Kwon, Nadagouda and Aminabhavi2021), resulting in a beneficial carbon cycle system in the Qinling region. This concept is related to the idea of “carbon neutrality” (Liu et al. Reference Liu, Deng, He, Wang, Zhang, Lin, Qi and Liang2022).
6. Conclusion
In this paper, we analyzed the seasonal distribution characteristics of DOC concentration and carbon isotope composition (Δ14C-δ13C) of the rivers in the Qinling area by taking the Tianyu River as an example and analyzed the sources of DOC in a qualitative-semi-quantitative manner. Particularly, we treated river sediments using a new method of stepped combustion and used activated carbon released at low temperatures as an independent source of DOC. The data showed that the concentration of DOC and the corresponding Δ14C-δ13C values in the Qinling Tianyu River were modulated by regional climatic factors. Overall, DOC concentrations were generally higher in summer and autumn compared to winter, reflecting the seasonal variability in precipitation and temperature. The Δ14C values showed a variation pattern of autumn > summer > winter, reflecting a strong sensitivity to regional precipitation dynamics. The gradual negative δ13C values from summer to winter might be related to the seasonal alternation of vegetation types at different temperatures. DOC of the Tianyu River predominantly originated from contemporary vegetation and riverine sediments, with a contribution ratio of about 85.8%–88.4%. These findings provide a critical foundation for assessing the role of carbon sinks and sources, as well as for advancing the understanding of carbon cycling processes in the Qinling Mountains. Despite the environmental conditions in several regions being different, the principles that drive and regulate the biogeochemical processes of carbon are the same. Therefore, the findings on the sources of OC in the Tianyu River within the Qinling Mountains can serve as valuable references for other regional river systems.
However, this study has limitations that warrant attention. Specifically, it only includes samples from summer, autumn, and winter, with a notable absence of spring data, leading to an incomplete temporal series. Future research should focus on the inert carbon fraction in sediments, particularly those from the medium and high-temperature sections, to address these gaps.
Supplementary material
For supplementary material accompanying this paper visit https://doi.org/10.1017/RDC.2025.24
Acknowledgments
The authors would like to express sincere thanks to the staff of the Xi’an AMS Center for their support. This research was jointly supported by the Strategic Priority Research Program of Chinese Academy of Sciences (XDB40000000), the National Natural Science Foundation of China (41991252, 42103026), the Methods Develop technical innovation projects, CAS (lz2023gl02), the Eco-geological environment system evolution and hazard risk management in the Qinling Mountain (42341101), and the Xi’an Institute for Innovative Earth Environment Research Fund (XAIIEER2304). We thank the anonymous reviewers and the editor for their insightful comments, which significantly improved this paper.
Author contributions statement
Mengyu Zang (co-first author): conceptualization, data curation, methodology, resources, validation, visualization, investigation, formal analysis, writing—original draft; Huachun Gu (co-first author): conceptualization, data curation, formal analysis, visualization, investigation, resources; Peng Cheng: conceptualization, funding acquisition, resources, supervision, validation; Yan Hu: investigation, resources, validation; Jie Zhou: resources, visualization; Hua Du: formal analysis, validation; Xuefeng Lu: formal analysis, validation; Zhao Jin: investigation, formal analysis. Yanhong Zheng: formal analysis, validation. Weijian Zhou (corresponding author): conceptualization, funding acquisition, resources, supervision, validation, writing—review and editing.
Declaration of interest statement
The authors declare that there is no conflict of interest.