

Introduction
The Indian sericulture industry has a long history of rearing various species of silkworms such as mulberry silkworm (Bombyx mori L. [Lepidoptera: Bombycidae]), tasar silkworm (Antheraea mylitta Drury), oak tasar silkworm (Antheraea proyeli Jolly), muga silkworm (Antheraea assamensis [Helfer]) and eri silkworm (Samia ricini (Donovan) [all Lepidoptera: Saturniidae]). Among these silkworm species, B. mori is completely domesticated and accounts for more than 90% of the world silk production. Currently, more than 4000 silkworm races of B. mori are maintained by traditional sericulture countries, namely China, Japan, France, India, Italy and South Korea (Nagaraju, 2002; Kumaresan et al., Reference Kumaresan, Sinha, Mohan and Thangavelu2004). Based on the number of generations produced annually, these races are categorized into univoltines (one generation in a year), bivoltines (two generations in a year) and polyvoltines (four to five generations in a year). Both univoltine and bivoltine silkworms are confined mostly to the temperate regions. Economically, bivoltines are the most desired as they produce the best silk fibre (Kamble et al., Reference Kamble, Rao, Basavaraja, Joge, Premletha and Nirmalkumar2007). Attempts have been made to improve the less productive tropical silkworm races, using both conventional and modern breeding methods. Lack of adequate knowledge on the total genetic make-up and the diversity present in the breeding stock remains a major bottleneck. Earlier attempts to delineate the relationship between polyvoltine tropical silkworm breeds and the bivoltine temperate silkworm breeds revealed considerable differences in their genetic make-up (Reddy et al., Reference Reddy, Nagaraju and Abraham1999). However, information on the interrelationships among only the tropical silkworm races/breeds is lacking. Likewise, information on the association of environmentally and developmentally stable markers with economically important traits is also needed to enable early identification of races with the desired traits. Keeping these requirements in view, the present study was undertaken to elucidate the genetic diversity among selected races of tropical silkworms and also identify molecular markers associated with economically important traits to add impetus to the breeding programmes.
Among the molecular markers that have been used for silkworm genome analysis (Reddy et al., Reference Reddy, Nagaraju and Abraham1999; Sharma et al., Reference Sharma, Sharma and Machii2000; Chatterjee et al., Reference Chatterjee, Vijayan, Roy and Nair2004; Mahendran et al., Reference Mahendran, Padhi, Ghosh and Kundu2006; Vijayan et al., Reference Vijayan, Tikader, Kar, Srivastava, Awasthi, Thangavelu and Saratchandra2006; Vijayan, Reference Vijayan2007), simple sequence repeats and single-nucleotide polymorphism are the most preferred marker systems due to their higher reproducibility, co-dominant inheritance and easy amenability to high-throughput automation (Vijayan, Reference Vijayan2007). Nonetheless, considering the easiness to handle, economic viability and least health hazard (no need of using radioactive isotopes and the neurotoxic compound, acrylamide), random amplified DNA polymorphism (RAPD) and inter simple sequence repeats (ISSR) markers are still being used for genetic diversity and marker-trait association analyses in silkworms (Srivastava et al., Reference Srivastava, Vijayan, Awasthi, Kar, Thangavelu and Saratchandra2005; Awasthi et al., Reference Awasthi, Kar, Srivastava, Rawat, Vijayan, Pradeep and Urs2008; Vijayan et al., Reference Vijayan, Nair and Urs2010). Hence, for this study, 19 RAPD and 20 ISSR primers, selected on the basis of earlier reports (Srivastava et al., Reference Srivastava, Vijayan, Awasthi, Kar, Thangavelu and Saratchandra2005; Awasthi et al., Reference Awasthi, Kar, Srivastava, Rawat, Vijayan, Pradeep and Urs2008; Vijayan et al., Reference Vijayan, Nair and Urs2010), were used.
Cocoon and shell weights are the major parameters being used for estimating the quantity of silk fibre present in a cocoon. Since these characteristics are quantitatively inherited and are thus difficult to monitor morphologically during the early developmental stages, identification of hybrids using stable and easily observable markers such as DNA markers helps speed up the selection procedure in any breeding programme. Therefore, molecular markers having strong association with cocoon traits are highly desirable (Gaviria et al., Reference Gaviria, Aguilar, Serrano and Alegria2006; Srivastava et al., Reference Srivastava, Kar, Awasthi and Urs2007). Recent advances in statistical analyses have made such early identification of marker-trait association possible (Bovenhuis et al., Reference Bovenhuis, van Arendonk, Davis, Elsen, Haley, Hill, Baret, Hetzel and Nicholas1997; Hoeschele et al., Reference Hoeschele, Ulimari, Grignola, Zangh and Cage1997). Discriminant function analysis (DFA) is one such statistical method by which marker-trait relationships can be unravelled with great precision. Earlier attempts with this tool in silkworms have identified some markers for important traits such as larval duration, filament length and larval weights (Chatterjee and Pradeep, Reference Chatterjee and Pradeep2003; Chatterjee and Mohandas, Reference Chatterjee and Mohandas2003; Mohandas et al., Reference Mohandas, Sethuraman, Saratchandra and Chatterjee2004; Gaviria et al., Reference Gaviria, Aguilar, Serrano and Alegria2006; Srivastava et al., Reference Srivastava, Kar, Awasthi and Urs2007). Therefore, attempts were also made in this study to identify markers associated with important cocoon characteristics.
Materials and methods
Silkworm races
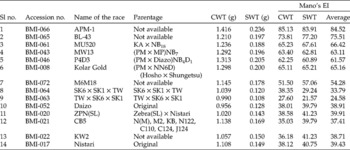
Based on Mano's index estimated from an average cocoon weight [(wt. of 25 male (g)+25 female cocoons (g))/50] and cocoon shell weight [(wt. of 25 male (g)+25 female cocoon shells (g))/50] using the formula: EI = (A − B)/C × 10+50, where EI is evaluation index, A = value obtained for a trait in a breed, B = mean value of a trait of all the breeds, C = standard deviation of a trait of all the breeds, 10 = standard and 50 = fixed value (Mano et al., Reference Mano, Nirmalkumar, Basavaraja, Malreddy and Datta1993; Kumaresan et al. Reference Kumaresan, Sinha, Mohan and Thangavelu2004), 14 tropical silkworm accessions (Table 1) were selected for the study. While sampling the accessions for this experiment, care was taken to include silkworm accessions with the highest, lowest and moderate values in all characteristics, especially of those related with economically important ones (Table 1). These silkworm accessions are being maintained by following standard rearing practices under similar conditions in the gene bank of the Central Sericultural Germplasm Resources Centre, Hosur, Tamil Nadu, India (www.silkgermplasm.com).
Details of the 14 tropical races selected for the study

CWT, cocoon weight; SWT, shell weight.
DNA extraction and polymerase chain reaction (PCR)
Genomic DNA extraction and PCR amplification were carried out as described earlier by Srivastava et al. (Reference Srivastava, Vijayan, Awasthi, Kar, Thangavelu and Saratchandra2005, Reference Srivastava, Kar, Awasthi and Urs2007). Briefly, the moths were frozen in liquid nitrogen and ground in a pre-chilled pestle and mortar. Five millilitres of the extraction buffer (100 mM Tris-HCl, pH 8.0, 50 mM EDTA and 1% SDS) and proteinase K (100 μg/ml) were added and incubated at 37 °C for 2 h with occasional shaking. Saturated phenol (pH 8.0) was added, centrifuged and the supernatant transferred to a fresh tube. The above procedure was repeated with phenol–chloroform–isoamylalcohol (25:24:1) and chloroform–isoamylalcohol (24:1). From the supernatant, DNA was precipitated by adding three volumes of double-distilled ethanol. The DNA was hooked out of the solution, dried at room temperature and dissolved in TE buffer (10 mM Tris-HCl, 1 mM EDTA, pH 8.0). RNA contamination was removed by incubating the DNA with RNase-A (100 μg/ml) at 37 °C for 1 h. The DNA was re-extracted with phenol–chloroform, chloroform and precipitated with ethanol. The extracted DNA was dissolved in TE buffer and diluted to 10 ng/μl working solution through quantification on 0.8% agarose gel using uncut λ-DNA (10 ng/μl) as a standard.
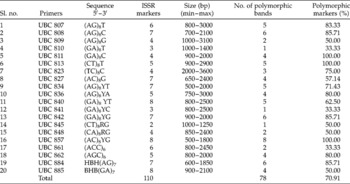
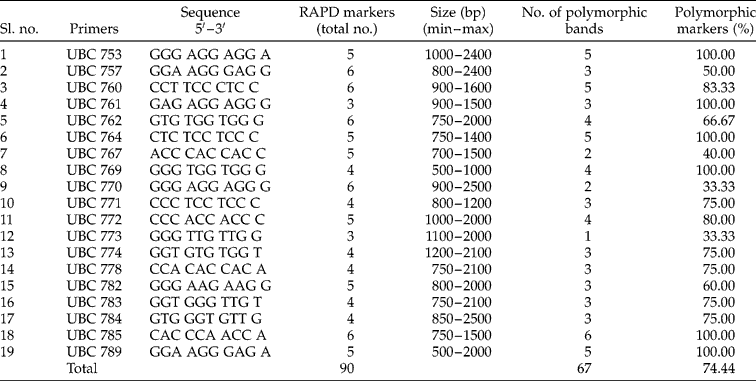
Twenty ISSR primers from the University of British Columbia, Canada (ISSR Kit no. 9) were used for the study (Table 2). PCR amplification was done in an MJ Research Thermal-Cycler, PTC200, using 20 μl reaction mixture containing 30 ng DNA, 2.0 μl of 10 × PCR Buffer of Genei, Bangalore, India, 0.2 mM dNTP, 2.5 mM MgCl2, 0.15 μM individual ISSR Primer and 1 U of Taq DNA polymerase. The PCR schedule was 94 °C for 2 min followed by 40 cycles of 94 °C for 30 s, 50 °C for 30 s, 72 °C for 2 min and a final extension for 10 min at 72 °C. Likewise, 19 RAPD primers from Operon Technologies Inc., Alameda, CA, USA (Table 3) were used for PCR amplifications of genomic DNA following Srivastava et al. (Reference Srivastava, Vijayan, Awasthi, Kar, Thangavelu and Saratchandra2005, Reference Srivastava, Kar, Awasthi and Urs2007), using 20 μl of reaction mixture containing 1 × PCR buffer (MBI, Fermantas, Hanover, MD-21076, USA) 0.2 mM each of dGTP, dATP, dCTP and dTTP; 2.0 mM MgCl2; 100 pM Primer; 10 ng genomic DNA and 1 U Taq polymerase. The PCR schedule followed was 93 °C for 2 min followed by 35 cycles of 93 °C for 1 min, 36 °C for 1 min, 72 °C for 2 min and a final incubation at 72 °C for 15 min.
ISSR primers used for PCR amplification, number of markers obtained and the status of polymorphism

Single letter abbreviations for mixed base positions: R = (A, G); Y = (C, T); B = (C, G, T) (i.e. not A); H = (A, C, T) (i.e. not G).
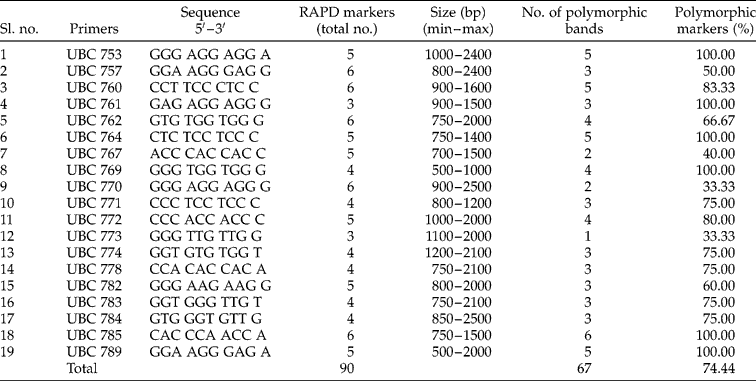
RAPD primers used for PCR amplification, number of markers obtained and the status of polymorphism
The PCR products were resolved on 1.5% agarose (GIBCO; Bethesda Research Laboratory, Paisley, UK) gel in Tris-boric acid/EDTA buffer (1 × TBE) using 0.6 cm thick gel of 20 cm (w) × 25 cm (l) and electrophoresis was done at a constant voltage of 60 V using power supply units EPS 400/200 (Amersham Pharmacia, Hanover, MD-21076, USA) for 3 h. Gels were stained with ethidium bromide (0.5 μg/ml) and photographed with a gel documentation system (Syngene Corporation, Frederick, MD, USA).
Statistical analysis
Markers were scored following standard procedures (Srivastava et al., Reference Srivastava, Vijayan, Awasthi, Kar, Thangavelu and Saratchandra2005, 2007) and pair-wise genetic similarity (GS) coefficients were calculated as 2N ij/N i+N j, where N ij is the number of common bands in ith and jth accessions and N i and N j are the number of bands for accessions i and j, respectively. 1 − GS is used to derive the dissimilarity index (Nei and Li, Reference Nei and Li1979). Unweighted pair group method using arithmetic average in PHYLIP 3.5c (Felsenstein, Reference Felsenstein1993) was used for deriving the dendrogram (Sneath and Sokal, Reference Sneath and Sokal1973). DFA was conducted using squared Mahalanobis distance (Mahalanobis, Reference Mahalanobis1936) using SPSS/PC+10.0 programs (M.J. Norusis; SPSS Inc., Chicago, IL, USA).
Step-wise multiple regression analysis (MRA) was used to identify markers associated with the cocoon and shell weights. The analysis was based on the model Y = a+b 1m 1+b 2m 2+···+b jm j+···+b nm n+d+e, which relates the variation in the dependent variable (Y = accession means for yield attributes) to a linear function of the set of independent variables m j, represented by the markers. The b j terms are the partial regression coefficients that specify the empirical relationships between Y and m j, d represents between-accessions residual, which is left after regression and e is the random error of Y that includes environmental variation (Virk et al., Reference Virk, Ford-Lloyd, Jackson, Pooni, Clemeno and Newbury1996). To select independent variables for the regression equation, F-values with 0.045 and 0.099 probabilities, respectively, were entered and removed (Roy and Bargmann, Reference Roy and Bargmann1958). Markers identified by MRA were further tested with linear curve fitting using linear models for confirming the significance of β-statistics for each of the bands identified by MRA. β can be defined as standardized regression coefficient = BSx/Sy, where B is the regression coefficient or slope, and Sx and Sy are the standard deviations of independent (x) and dependent (y) variables.
Results
Variability in quantitative traits of silkworm accessions
The tropical silkworms used in this study showed considerable variation in yield attributes (Table 1). The average cocoon weight, estimated from three replications and in each replication 50 individual cocoons, varied from 0.99 g in TW × SK6 × SK1 to 1.416 g in APM-1. The shell weight was in the range of 0.108 g (TW × SK6 × SK1) to 0.236 g (APM-1). Mano's EI for cocoon weight and shell weight was found to be highest in the accession APM-1 (85.13 and 83.91, respectively) with an average value of 84.52. Similarly, the lowest Mano's index value for cocoon weight (27.60) and shell weight (21.57) with an average of 24.58 was recorded in the silkworm TW × SK6 × SK1.
Genetic polymorphism
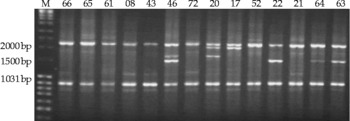
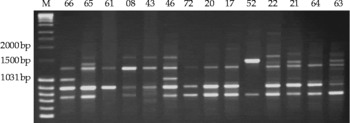
The ISSR primers generated PCR products ranging from 500 to 3600 bp (Fig. 1). The number of bands produced by each primer varied from 2 (UBC 845) to 8 (UBC 840) and the percentage of polymorphism varied from 33.33% (UBC 810, 841 and 861) to 100% (UBC 811, 813 and 857). The total percentage of polymorphism was 70.91%. The size of the RAPD-PCR products was in the range of 500–2500 bp (Fig. 2). The number of bands produced by each primer varied from 3 (UBC 761) to 6 (UBC 757, 760, 762, 770 and 785). The extent of polymorphism ranged from 33.33% (UBC 770, 773) to 100% (UBC 753, 761, 764, 769, 785 and 789) and the total polymorphism was 74.7%.
PCR products of the ISSR primer UBC-861 resolved on 1.5% agarose gel and stained with ethidium bromide. Numbers represent 14 tropical silkworm races used for the study as shown in Table 1 and ‘M’ denotes the molecular weight marker.

PCR products of the RAPD primer UBC-785 resolved on 1.5% agarose gel and stained with ethidium bromide. Numbers represent 14 tropical silkworm races used for the study as shown in Table 1 and ‘M’ denotes the molecular weight marker.

Genetic relationships among diverse silkworm strains
The genetic distance between silkworm races varied from 0.115 (TW × SK6 × SK1 and SK6 × SK1 × TW) to 0.481 (MU520 and DAIZO). The average genetic distance among the 14 races was 0.369 ± 0.083. Similarly, with the RAPD markers, the genetic distance ranged from 0.143 (BL-43 and APM-1) to 0.549 (SK6 × SK1 × TW and BL-43) with an average value of 0.451 ± 0.087.
Cluster analysis
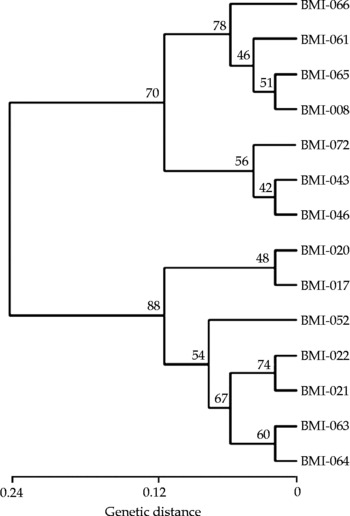
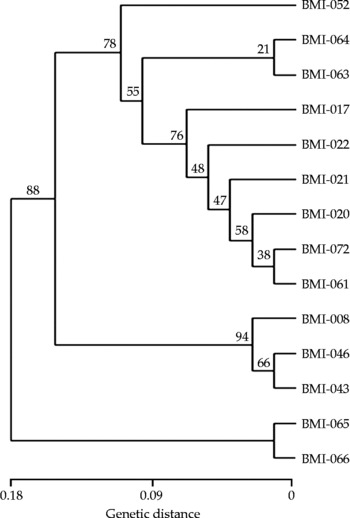
The dendrogram with ISSR markers resolved the 14 silkworm races into two major groups (Fig. 3). Those silkworms that had a temperate genetic background clustered as a separate group, i.e. BMI-043, BMI-046, BMI-072, while those with pure tropical genetic background formed another distinct group. The groupings in the dendrogram with RAPD markers also showed a similar pattern to that of ISSR markers (Fig. 4).
Dendrogram of 14 tropical silkworm races generated from ISSR markers. Numbers represent 14 tropical silkworm races used for the study as shown in Table 1.

Dendrogram of 14 tropical silkworm races generated from RAPD markers. Numbers represent 14 tropical silkworm races used for the study as shown in Table 1.

DFA
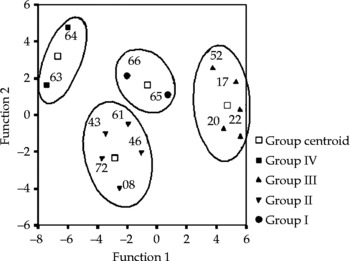
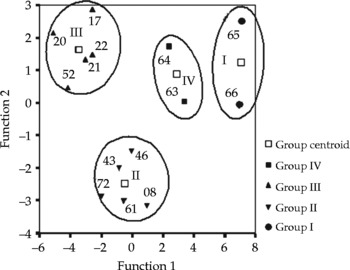
DFA identified three functions for ISSR markers and two in RAPD markers. The first function of ISSR explained 77.8% of the variance (Table 4). The canonical correlation value was 0.984 (eigenvalue = 29.980; Wilk's λ = 0.001; χ2 = 57.059; P < 0.001). The plot developed on the matrix of discriminant function 1 against function 2 revealed formations of four distinct groups, which was in accordance with the Mano's index values (Fig. 5). The accessions BMI-065 and BMI-066 with highest Mano's index values grouped together in the region between 0.4 and − 3.0 on the X-axis and between 1.0 and 2.4 on the Y-axis, whereas those races with pure genetic background, viz., BMI-017, BMI-020, BMI-022 and BMI-052 grouped in the region between 3.0 and 6.0 on the X-axis and between − 2.0 and 3.0 on the Y-axis. In the case of RAPD markers, the first function itself explained 86.1% of the variance with a canonical correlation of 0.933 (eigenvalue = 6.722; Wilk's λ = 0.062; χ2 = 27.770; P < 0.001), which is highly significant (Table 4; Fig. 6).
Summary of canonical discriminant function realized from the arbitrary grouping of 14 tropical silkworms based on average Mano's index for cocoon and shell weights

100% of cases were classified correctly.
Minimum partial F to enter is 3.84 and maximum partial F to remove is 2.79.
Spatial distribution of 14 tropical silkworm races based on a canonical discriminant function analysis of ISSR markers against grouping with Mano's average EI on cocoon and shell weights. Numbers represent 14 tropical silkworm races used for the study, as shown in Table 1.

Spatial distribution of 14 tropical silkworm races based on a canonical discriminant function analysis with Mano's average EI of cocoon weight and shell weight and RAPD markers. Numbers represent 14 tropical silkworm races used for the study, as shown in Table 1.

Identification of markers through step-wise MRA
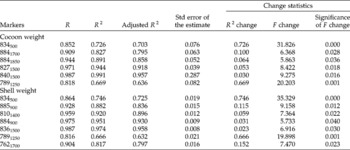
The MRA identified six ISSR markers, namely 834500, 8841700, 8841850, 8271500, 8401500 and 7891250 for higher cocoon weights (R = 0.818–0.987, F = 0.000–0.036) and seven markers, viz., 834500, 885900, 8101400, 884900, 8361500, 7891250 and 7621700 for shell weights. Out of these markers, 834500 was found to be associated with both cocoon and shell weights (Table 5).
Summary of step-wise multiple regression analysis for association of ISSR and RAPD markers with cocoon and shell weights

Discussion
The silkworm genetic resource consists of a large number of ecotypes, synthetic inbred lines, hybrids, land races, mutants and genetically tailored ones. Hence a high degree of genetic diversity can be expected to be present within the gene pool. To effectively utilize this genetic variability in the gene pool, it is essential to have thorough knowledge on the pattern and distribution of the genetic diversity among the accessions. Genetic diversity assessment provides information on the genetic make-up of a population and molecular markers are known to be superior to morphological and biochemical markers in terms of reproducibility, polymorphism, robustness, etc. (Gupta and Varshney, Reference Gupta and Varshney2000). In the present study, genetic diversity among silkworm races of tropical India was estimated using these stable markers and the findings were in corroboration with the results of earlier studies, wherein ISSR markers exhibited high resolving capabilities in temperate silkworm races (Chatterjee et al., Reference Chatterjee, Vijayan, Roy and Nair2004; Kar et al., Reference Kar, Vijayan, Nair, Mohandas, Saratchandra and Thangavelu2005; Srivastava et al., Reference Srivastava, Vijayan, Awasthi, Kar, Thangavelu and Saratchandra2005; Vijayan et al., Reference Vijayan, Nair, Kar, Mohandas, Saratchandra and Urs2005). Reddy et al. (Reference Reddy, Nagaraju and Abraham1999) also assessed the genetic diversity among six diapausing (temperate) and seven non-diapausing (tropical) silkworm races and found considerable genetic diversity between these two groups. They also elucidated genetic diversity among the temperate silkworm races for developing commercial silkworm hybrids to harness the hybrid vigour. In India, rearing of silkworm hybrids is in vogue to get better cocoon yield. Since bivoltine silkworm hybrids cannot survive the harsh climatic conditions in the tropics, especially during the summer and rainy months, hardy tropical silkworm hybrids need to be developed. To harness the hybrid vigour, genetically divergent parents need to be used. Thus, in this study, ISSR and RAPD markers were used to deduce the genetic relationships within a group of tropical silkworm races having commercial potential. The results of the present study suggest the existence of adequate genetic diversity, which can be used for breeding to enhance the silk productivity via hybrid vigour. As BMI-066, BMI-064 and BMI-052 are genetically much diverged, they have the potential to be used for hybrid preparation (multi × multi). High-yielding tropical silkworm hybrids are highly desirable to rear in the hot and humid regions of the tropical sericulture belts as silkworms with temperate genetic backgrounds often succumb to the harsh climatic conditions prevailing in these regions. Hence silkworm hybrids with tropical genetic backgrounds are essential to sustain the silk industry in these regions.
DFA is mainly used for testing the veracity of linear relationships between independent variables and groups (Press and Wilson, Reference Press and Wilson1978). In the present study, DFA was employed to test the correlation between molecular markers and the grouping based on morphological traits. The contribution of the first two canonical functions, their significant correlation, and the distribution of the silkworm groupings on the canonical discriminant plot on the basis of the genetic diversity among the silkworms confirmed the high genetic variability among these silkworm races. The position of BMI-064 and BMI-063 away from BMI-061, BMI-072, BMI-008, BMI-046 and BMI-043 revealed that these races are genetically much more divergent than the others; hence, they can be used for hybrid preparation. Further, the non-overlapping of the groups obtained in the DFA clearly indicated that the grouping made on the basis of Mano's index received good support from the molecular markers.
The MRA with ISSR and RAPD markers for cocoon and shell weights identified six markers (834500, 8841700, 8841850, 8271500, 8401500 and 7891250) with positive correlations. Similarly, seven markers showed strong association with shell weight (834500, 885900, 8101400, 884900, 8361500, 7891250 and 7621700). MRA was proved to be one of the most reliable tools to identify marker-trait associations (Rafalski et al., Reference Rafalski, Tingey and Williams1991; Fang and Roose, Reference Fang and Roose1997; Nagaoka and Ogihara, Reference Nagaoka and Ogihara1997). Chatterjee and Pradeep (Reference Chatterjee and Pradeep2003) and Chatterjee and Mohandas (Reference Chatterjee and Mohandas2003) in a similar study with B. mori identified a few ISSR and RAPD markers for silk yield attributing traits. Further testing of these markers for inheritance revealed that the markers identified through MRA followed Mendelian inheritance. Hence, the marker identified through MRA in this study can be used for marker-assisted selection and breeding in B. mori. Since RAPD and ISSR markers are anonymous in nature and the reproducibility of them has often been questioned, sequencing and characterization of these markers to translate them into stable, informative and reproducible sequence characterized amplified regions markers is essential. Such attempts are underway in our laboratory. Stable, reproducible and informative markers associated with important traits can expedite the breeding programme considerably, as in traditional breeding selecting an individual silkworm with the desired combination of traits needs thorough observation right from brushing of the young silkworm to silk-fibre testing. This is a long and tedious process. Most of these traits are of quantitative nature and are under the control of several genes or quantitative trait locus (QTLs). Thus if molecular markers associated with these traits are available, it is possible to cut short this selection procedure. In this direction, attempts have also been made using QTL mapping. Lu et al. (Reference Lu, Li, Zhao and Xiang2004) used a backcrossed population (BC1) of silkworms to identify amplified fragment length polymorphism (AFLP) markers associated with QTLs for the whole cocoon weight, cocoon shell weight, ratio of cocoon shell and weight of pupae. Lie et al. (Reference Lie, Cheng, Fang-yin and Shou-min2010) identified nine putative major QTLs for cocoon traits, five QTLs of whole cocoon weight, four QTLs of cocoon shell weight, six QTLs of pupa weight and four QTLs of cocoon shell rate, scattered across nine linkage groups. Xu et al. (Reference Xu, Wei, Tang, Zhu, Sima and Lou2011) used a mixed linear model including QTL main effects, epistatic effects and QTL × sex interaction effects for mapping QTLs in an F2 population of silkworms and found that a sample size of 100 individuals was sufficient to get markers stably associated with QTLs. These markers, along with the marker identified in this study, can be used for marker-assisted selection breeding.
In conclusion, the present study, for the first time, estimated the genetic diversity among the tropical silkworms with high commercial exploitation. The genetically divergent silkworm races can be used for developing hybrids with better silk productivity and adaptability. The molecular markers identified through MRA would be of much use in silkworm breeding. Thus the study generated useful information on tropical silkworm races that can be used for both breeding as well as conservation purposes.