I. INTRODUCTION
Semiconductors in microelectronics and optoelectronics are preferably used as single crystalline materials to get the most precise control on fabrication and operation of the devices. In microelectronics, single crystalline silicon (Si) substrates gained the dominance Reference Kasper, Muessig and Grimmeiss1 for a bundle of reasons but other semiconductors may perform better for specific functions. The growth of thin single crystalline layers of defined orientation and different chemical compositions on a substrate is called heteroepitaxy. The heteroepitaxy of group IV elements (carbon C, germanium Ge, tin Sn) or of their alloys on Si substrates is especially attractive because these materials of the same chemical group (4 electrons in their outer shell) as Si are not able to create doping centers in the other material. Cross contamination with doping centers is the main problem for an otherwise also very attractive heteroepitaxy system: Group III/V semiconductors on Si. There, small contaminations of 1 ppm creates an unintentional doping of about 5 × 10¹⁶/cm3 in the other material.
In Si microelectronics, the SiGe heteroepitaxy found entry into the manufacturing of specific circuits (e.g., microwave circuits with SiGe heterobipolar transistor) or of the source/drain regions of the dominant digital circuits technology, the complementary metal oxide semiconductor circuit. In nearly all high performance processors, the p-type MOS transistors are pushed in their performance by SiGe heteroepitaxy induced elastic stresses.
The need for heteroepitaxy is even higher in Si photonics because transparent waveguides are combined with optoelectronic devices, which should have a good light matter interaction for light generation, detection, or modulation.
Transparency in semiconductors is primarily defined by the band gap. All wavelengths λ higher than a cut-off wave length λc are not covered by the fundamental band to band absorption. The cut off wave length is given by
 $${\lambda _{\rm{c}}} = {{hc} \over {{E_{\rm{g}}}}} = {{1.24\,\mu {\rm{m}}} \over {{E_{\rm{g}}}}}\left( {{\rm{eV}}} \right)\quad ,$$
with h as Planck constant, c as speed of light, and E g as band gap energy.
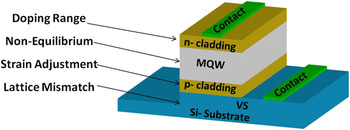
Si is transparent in the near infrared (NIR), optoelectronic devices which interact with NIR light should have a lower band gap E g than Si (E g = 1.12 eV at room temperature). Ge and GeSiSn alloys are the mainly considered materials for heteroepitaxy on Si for photonics. The basic heteroepitaxy questions are summarized on the example of a very demanding device; a future heterostructure laser on Si (Fig. 1). The laser is built on a virtual substrate (VS) which consists of a strain relaxed buffer (SRB) on top of the Si substrate. The VS offers to the following layers a lattice spacing (the lattice spacing of the buffer material) which is different to that of the Si substrate. The following thin layers of the device will be elastically strained if their lattice spacing differs from that of the VS. Elastic strain is a very effective method to modify the electronic and optical properties of a semiconductor, which is explained in more detail in Sec. II. The active laser material consists in the given example of multiple quantum wells (MQWs) which are embedded into cladding layers that should confine the light and the injected electrical carriers to the laser region. Sun, Soref, and Chen Reference Sun, Soref and Cheng2 gave a first proposal of a GeSn laser on an silicon on insulator substrate with electrical stimulation of the light emission. In their proposal, the active layer consisted of an MQW with GeSn wells (10% Sn content) and GeSiSn barriers (15% Si and 10% Sn content, respectively) and the cladding layers were made from GeSiSn on a relaxed GeSn VS. The band offsets at the heterointerface GeSiSn/GeSn follow an electronic band ordering that is called type I. In type I QWs, both, electrons and holes are collected in the lower band gap material which is GeSn in the given material choice. The few realized Si based laser attempts Reference Liu, Sun, Camacho-Aguilera, Kimerling and Michel3–Reference Wirths, Geiger, von den Driesch, Mussler, Stoica, Mantl, Ikonic, Luysberg, Chiussi, Hartmann, Sigg, Faist, Buca and Grützmacher6 used either simpler structures (Ge as active material, either directly on Si or on a Ge VS) with lower efficiencies or the easier applicable optical stimulation. The laser structure of Fig. 1 contains the material science related phenomena that have to be addressed in-group IV heteroepitaxy on Si: (i) Lattice mismatch. (ii) Strain adjustment. (iii) Non-equilibrium. (iv) Doping range. All these phenomena are linked to the occurrence of various defects and the deviation of their density from equilibrium. Defects are a topic of their own significance; they are not treated systematically in this report but mentioned if necessary for the understanding.
Generalized scheme of a Si based heterostructure laser. Reference Sun, Soref and Cheng2 The active laser material (here shown as MQW) is embedded between cladding layers which support ideally three laser requirements, namely, electrical injection, carrier confinement, and optical confinement. This general laser structure is placed on top of a VS which accommodates different lattice spacings and provides strain adjustment.

II. SiGe AS A MODEL SYSTEM FOR LATTICE MISMATCH ACCOMMODATION AND STRAIN ADJUSTMENT
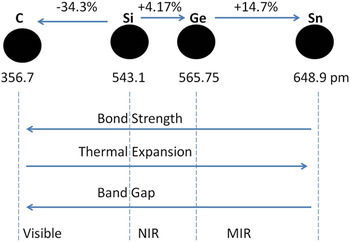
Generally, the heteroepitaxial material couple may differ in many facets with respect to lattice structure, lattice size, bonding type, and bonding strength, surface energy. Within the group IV elements and alloys, we consider here the cubic diamond lattice structure, which is the only stable one for bulk Si and Ge. Figure 2 shows the size of the lattice cell of the semiconducting group IV elements and the qualitative change of bond strength, thermal expansion, band gap within this material series. Below is the transparency given which moves from the visible (C diamond), to the NIR for Si and Ge, and further to the mid-infrared (MIR) for GeSn alloys. The lattice mismatch f between Ge and Si is about 4.2%, and the alloy SiGe is completely miscible. That means the SiGe on Si structure allows on adjustment of the lattice mismatch f between zero and 4.2% by simply changing the chemical composition of the alloys (Ge content: x). For a simple assessment of the lattice mismatch a linear interpolation may be used (Vegard's law) but for a more precise determination a slight parabolic derivation has to be considered. Reference Herzog7 The alloy lattice mismatch to Si is given by
 $$f\left( {{\rm{S}}{{\rm{i}}_{1 - x}}{\rm{G}}{{\rm{e}}_x}} \right) = {{\alpha - {\alpha _0}} \over {{\alpha _0}}} = 3.67 \times {10^{ - 2}}x + 5.4 \times {10^{ - 4}}{x^2}\quad ,$$
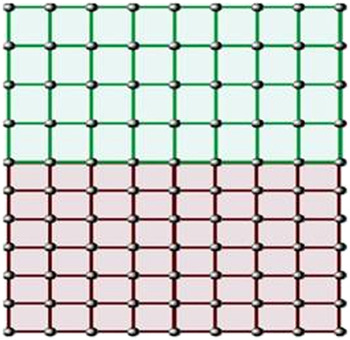
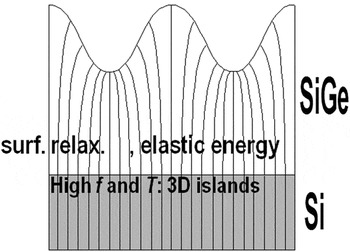
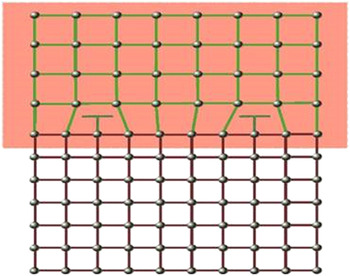
with α and α0 as lattice constants of alloy and substrate, x as molar Ge fraction, and f as lattice mismatch. The lattice constant of the SiGe alloy is larger than that of Si, which gives a positive lattice mismatch; the sign of the mismatch is negative for epitaxy of SiGe on Ge. Accommodation of lattice mismatch mainly happens by three different mechanisms (Figs. 3–5). Very thin layers are elastically distorted to get full registry of the atomic planes at the interface (Fig. 3). The atomic layer registry delivers the optimum interface energy, but the elastic distortion adds strain energy to the layer (Note: we assume a much thicker substrate i.e., nearly unstrained by the thin film). Layers with this atomic planes registry are called pseudomorphic or coherent. The strain energy increases linearly with the film thickness resulting in an unfavorable high-energy demand for thicker layer. Above a critical thickness, two other mechanisms of mismatch accommodation compete with uniform elastic distortion. One is simply surface roughening (Fig. 4) which allows the lattice planes to relax beyond the interface region which reduces the elastic energy. However, this is opposed by the additional surface energy created. This roughening can be understood from the Asaro-Tiller-Grinfeld instability Reference Asaro and Tiller8,Reference Grinfeld9 which has been derived in the context of strained layer epitaxy by Srolovitz. Reference Srolovitz10 Balancing the strain energy versus the surface energy gives a condition for which minimum wave length L min the perturbation is stable
 $${L_{\min }} = {{\left( {2\mu \pi \gamma } \right)} \mathord{\left/ {\vphantom {{\left( {2\mu \pi \gamma } \right)} {\left( {\left( {1 - \nu } \right){\sigma ^2}} \right)}}} \right. \kern-\nulldelimiterspace} {\left( {\left( {1 - \nu } \right){\sigma ^2}} \right)}}\quad ,$$
with µ as shear modules, ν as surface energy, γ as Poisson's ratio, and σ as film stress.
Group IV materials used in Si based heteroepitaxy. The lattice mismatch values (in percent) and the diamond lattice constants (1 p.m. = 10−12 m, 1A°=100 p.m.) are given in the upper two lines. The next three lines show the systematic trends in bond strength, thermal expansion, and band gap. The arrow head points to the direction with higher values. The lower line shows the wave length regime for transparency which spans from ultraviolet to visible to NIR and MIR for C, SiC, Si, Ge, GeSn, respectively.

Lattice mismatch accommodation by elastic strain. The larger film lattice on top is elastically distorted (tetragonal distortion) for a registry of atomic planes at the interface. The thin film is biaxially stressed parallel to the interface, the thick substrate is undistorted (Note: This is fully correct for infinite substrate thickness. The force and angular momentum balance requests a slight substrate curvature for finite substrate thicknesses).

Stress driven surface corrugation. Lattice plane expansion on the hills reduces the strain energy on the cost of increased surface energy. The Srolovitz condition [Eq. (3)] allows surface corrugations with wavelengths larger than a critical length L c. Low epitaxy temperatures suppress the surface corrugations because of the need for mass transport from the valleys to the hills.

Misfit dislocation network at the film–substrate interface. Thicker films above a critical thickness t c get partial strain relief by plastic deformation via dislocation movement from surface nucleation sites to the interface. The lattice plane registry is periodically interrupted by misfit dislocations which have a missing atom row on one side.

Equation (3) means that each surface of a strained material is unstable against perturbation of a wave length larger than L min. The perturbations need a mass transport from the valley position to the hill position. That is the reason that in an experiment, perturbation is only seen if the conditions of high stress σ (σ is proportional to the mismatch f) are fulfilled, which lead to short wavelengths. With Ge epitaxy on Si at medium or high temperatures (>450 °C), the surface breaks up into islands after growth of a thin (<1 nm) wetting layer, a growth mode which is called Stranski–Krastanov growth. That growth mode is utilized for preparation of self-organized Ge islands which function as quantum dots (QDs) if the size is small (<50 mm). Surface templating can provide precise positioning and improved size homogeneity versus randomly nucleated QDs. Reference Duska and Floro11
Generation of a misfit dislocation network is the third mechanism of lattice mismatch accommodation which will dominate for thicker layers. Here, atomic planes that end at the interface (Fig. 5) periodically interrupt the registry of lattice planes. Such an arrangement of atoms is called a dislocation that is well known from the theory and observation of plastic relaxation in metals and semiconductors. Basic elements of a dislocation are the Burger's vector
 $\overrightarrow b$
, which describes the deformation around the dislocation line, the dislocation line direction
 $\overrightarrow l$
, and the glide plane. A dislocation can easily move within glide planes, which are the 〈111〉 planes in the diamond lattice. Dislocations my not end within the crystal bulk; they are either closed loops or they end on surfaces.
As can be easily seen from Fig. 5, the misfit dislocation at the interface leads to less lattice planes at the larger lattice constant film (SiGe) compared to the substrate. A reduction of film strain results from these dislocations. The residual film strain
 $\varepsilon$
is related to the lattice mismatch f by
 $$\varepsilon = - f + {{b'} \over p}\quad ,$$
where b′ is the effective amount of the Burgers vector and p is the mean distance between the misfit dislocation. The amount of the Burger's vector in a diamond lattice is given by
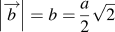 $\left| {\overrightarrow b } \right| = b = {a \over 2}\sqrt 2$
e.g., in Si b = 0.38 nm. The effective amount b′ for strain reduction is smaller than b if the Burger's vector is inclined to the interface, e.g., for a frequent 60° dislocation where the angle between line and Burger's vector is 60°. The (111) glide plane of the dislocation contains both, the line vector and the Burger‘s vector. First dislocations appear at a critical thickness t
c, their density increases (their distance p decreases) and the strain finally vanishes (ε = 0). The critical thickness is rather easy to calculate from relations about strain energy and dislocations energy if the surface is planar.
Reference Frank and Van der Merwe12–Reference Kasper14
 $$\left( {{{{t_{\rm{c}}}} \over b}} \right) \cdot f = 5.78 \times {10^{ - 2}}\,\ln \left( {{{{t_{\rm{c}}}} \over b}} \right)$$
The numerical pre-factor depends slightly on assumption about the dislocation type. Here we have chosen the value for 60° dislocations.
The SiGe layer is compressively (ε < 0) strained below the critical thickness. Above the critical thickness strain relief sets in [Eq. (4)] and finally the strain vanishes at higher thickness when the dislocation spacing p tends toward (b′/f). This dislocated layer is called SRB in Si-based electronics and photonics because the main application targets to a VS with a thick Si substrate the surface of which offers different lattice spacing by the SRB. In III/V technology strain relaxed layers are often used as device structure, they are named as metamorphic layers. Reference Richardson and Lee15
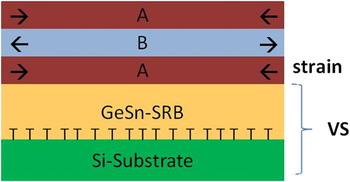
The VS acts as global strain platform. Each thin layer grown on top fits to the lattice spacing offered by the VS (Fig. 6).
Strain management by a VS. The VS consists of a rather thick Si wafer (0.5–1 mm) with large diameter (10–30 cm) on which a SRB layer (e.g., from SiGe, Ge. GeSn) is grown. The term “virtual substrate” refers to the usage of a common Si wafer but with a surface lattice spacing which can be varied. A following pseudomorphic device structure (here shown as a single quantum well B between barriers A) is strained as given by the lattice mismatch between the layers and the VS. The figure shows the stable symmetrical strain distribution with changing sign of the strain (compressive, tensile, compressive).

A pseudomorphic layer structure ABA (pseudomorphic with respect to the VS, not to the Si substrate) will be strained according to the lattice differences between A, B, and the VS. In the given example, the lattice constants of the materials A and B are larger and smaller, respectively, as that of the VS. Therefore, the layer A is compressively strained and the layer B is tensile strained. What are the benefits of such strain adjusted structure? The benefits are 2-fold; improved material structure stability and artificial tailoring of the semiconductor properties are obtained. Symmetrical strain distribution
Reference Kasper, Herzog, Daembkes and Abstreiter16
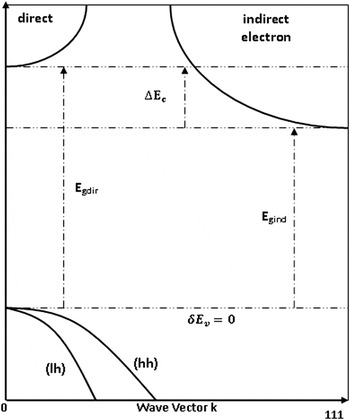
of pseudomorphic layer stacks (the order ABA may be repeated several times—MQWs—or even very often—strained layer superlattices) allows total thickness for stacks otherwise strain relaxed from misfit dislocation networks. Strain symmetrized structures are obtained, e.g., by a Si0.75 Ge0.25 VS on which compressive strained Si0.5 Ge0.5 layers B and tensile strained Si layers A are grown. With this technique, one gets strained Si layers on a Si substrate. Strain adjustment influences strongly the semiconductor properties and it may be used to increase the variation width of properties from a selected choice of material. Semiconductors are essentially prone to strain influences because of their band structure. This is shortly explained with the help of the band structure of tensile strained (100) Ge. In this scheme, the band structure is simplified to two subbands for each band. These subbands are heavy hole (hh) and light hole (lh) subbands within the valence band, and the indirect electron and direct electron subbands within the conduction band. Applied strain shifts the energies of all subbands, these shifts result in a different band gap E
g of the semiconductor and in different band offsets at heterostructure interfaces. The degeneracy of the heavy and light hole subband at the wave vector k = 0 is lifted by the energy difference
 $\delta {E_{\rm{v}}}$
, in the case of tensile strain the light hole subband is the higher one.
Reference Kasper and Oehme17
The energy separation
 $\Delta {E_{\rm{c}}}$
of the direct and indirect conduction band is changed; in the case of tensile strain, it is reduced. These effects have strong influence on the cut-off wave length (via E
g), on the quantum confinement, on the occupation statistics, on the mobility and on the effective density of states. For example, the compressive strained SiGe on Si creates an interface with vanishing conduction band offset that means that holes are collected on the SiGe side whereas electrons move easily across the interface. The pseudomorphic Si/SiGe/Si-substrate structure is used as quantum well for holes with unstrained Si as barrier; it cannot be used as electron quantum well for electrons because of the vanishing barrier. However, tensile strained Si (s-Si) on unstrained SiGe creates a so called type II interface with electron confinement on the Si side (Si is the large band gap semiconductor in the Si/SiGe material couple) allowing for an electron quantum well with SiGe barriers. Tensile strain increases the ratio of direct electrons to indirect ones because it reduces the separation between direct and indirect conduction subbands and it favors by splitting of the valence subbands the light holes (lh) which have higher mobility than heavy holes (hh). Tensile strain causes the Fermi energy to touch the valence band edge at lower concentrations of holes because the effective density of states for the light hole subband is smaller as that of the heavy hole subband.
III. NON-EQUILIBRIUM MATERIAL PREPARATION
Many basic rules of lattice mismatched heteroepitaxy could be explored with the material couple SiGe on Si. The obtained results stimulated interest to expand the choice of materials toward SiC and GeSn. The incorporation of C into Si and Sn into Ge seems much more difficult because of the large atomic size differences (−34.3% for C in Si, +14.7% for Sn in Ge) but the main obstacle was the low equilibrium solid solubility (for both mentioned material systems below 1%). Progress in advanced epitaxy methods (molecular beam epitaxy, MBE, and chemical vapor deposition, CVD) allowed to reducing the growth temperatures far below the melting points of Si (1687 K) and Ge (1211 K).
Epitaxial growth temperatures Reference Aubin, Hartmann, Bauer and Moffat18 were reduced to about half or less of the melting point temperature T m [T m/2 = 843 K (570 °C) for Si and 605 K (332 °C) for Ge]. At these low growth temperatures, the diffusion of atoms in the bulk is very low but the surface diffusion of adatoms is high enough that impinging adatoms are able to search and find correct lattice positions for epitaxial growth. These are good preconditions to realize non-equilibrium conditions for short times at the surface and then freeze in the state by overgrowing. Roughly on monolayer (ML) of atoms is grown at each second in a typical low temperature growth process. A ML is about 0.13 nm thick (a/4 on the (100) oriented diamond lattice). That means that the surface is covered each second by a new ML and the layer before is covered and buried in the bulk. In a simplified picture of the low epitaxy growth process, we assume that the fresh surface has only a limited time t ML to get into equilibrium otherwise it will be covered and frozen in
 $${t_{{\rm{ML}}}} = {a \over {4R}}$$
(a lattice constant; R growth rate).
Recently, strong advances in material preparations were obtained by non-equilibrium growth of thin heteroepitaxial structures. High strain values not available in bulk material, doping levels far beyond the saturation limit and materials like Si:C or GeSn far outside their limits in phase diagrams are the most prominent examples of the progress in low temperature epitaxy.
A. Metastable strained layers
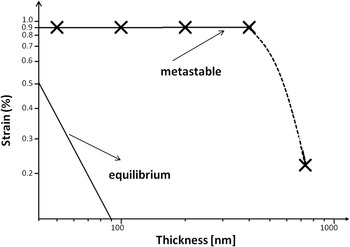
Covalent bonding in the diamond lattice results in hard materials. Diamond, silicon carbide, silicon, and germanium are brittle at room temperature but are plastically deformable by dislocation movement like metals at higher temperature. They can be strained to high values in equilibrium up to a critical thickness t c [Eq. (5)]. But this critical thickness is very thin for strong strain values, e.g., below 10 nm for a strain of 1%. This is thick enough for some electronic applications but not for photonic devices which require several hundred nanometer thickness. Two mechanisms are responsible that strain relieving plastic deformation does not work easily at low epitaxy temperature. Movement of dislocations along glide planes is slow and nucleation of dislocations is hard to force on nearly defect free silicon substrate. A unified kinetic model for misfit strain relaxation that incorporates both nucleation and propagation was then developed, Reference Houghton19 which is applicable for heterostructures and thermal cycles in the low dislocation density regime. The number of nucleation sites is an empirical value that depends strongly on wafer surface quality, on pre-epitaxial cleaning schemes, and on dust-free clean room conditions. The high-energy barrier for dislocation nucleation on smooth, clean, dislocation free wafer surfaces will only be overcome on heterogeneous nucleation sites, e.g., micro scratches, dust particles. Reference Kasper, Burle, Escoubas, Werner, Oehme and Lyutovich20 Even at moderate epitaxy temperatures (550–650 °C) several hundred nanometer thick strained layers may be grown with strain values not available for that thickness under equilibrium conditions. The group of J.M. Hartmann Reference Hartmann, Abbadie and Favier21 has revisited the critical thickness for plastic relaxation of SiGe on Si (001) under clean conditions typical for semiconductor manufacturing. They found pseudomorphic SiGe epitaxy layers even thicker than in earlier investigations. Strain as function of thickness is compared in Fig. 7 for equilibrium and for low temperature epitaxy on a strain versus thickness scale. A large metastable fully strained regime is visible up to 400 nm thickness (compared to an equilibrium critical thickness of about 8 nm!) for the given strain (0.9%) example.
Metastable strained SiGe epitaxial layers grown at low temperatures. Strained layers are the equilibrium state for very thin lattice mismatched layers. Full strain is obtained up to much higher device relevant thicknesses for low growth temperatures. The figure compares strain as function of thickness for equilibrium theory (lower curve) with experimental values from growth of 0.9% mismatched SiGe on Si (550 °C growth temperature Reference Kasper, Burle, Escoubas, Werner, Oehme and Lyutovich20 ). A fully strained thickness region up to about 50 times thicker than the predicted equilibrium critical thickness could be obtained.

The metastable regime may be extended to even higher thicknesses by lower growth temperatures. Care has to be taken for high temperature annealing or processing as these processing steps can stimulate dislocation nucleation on the surface. A clear stabilization against dislocation nucleation at post growth anneal is obtained with a surface cover of unstrained material. Then annealing temperatures substantial higher than growth temperatures are allowed.
B. High doping levels beyond the solid solubility limit
The group III materials B, Al, Ga are acceptors (p-type doping) in group IV materials with B as the mainly used p-dopant. The group V materials (N) P, As, Sb are donors (n-type doping). The small atomic size element nitrogen (N) is only used in the small lattice cell materials SiC and diamond. All these dopant materials have limited solubility in the bulk semiconductor. Reference Sze22,Reference Claeys and Simoen23 The covalent radii of the dopant atoms differ often considerably from those of the matrix elements causing lattice mismatch between highly doped and undoped regions. Outdiffusion of dopants in undoped regions or in insulator layers is observed during high temperature annealing. The solubility curve is temperature dependent with increasing solubility at high temperatures with the exception of about 100 °C below the melting point where the solubility drops (retrograde curve). The maximum solubility in Si Reference Sze22 ranges from several 1019/cm3 (Al, Ga) to 1021/cm3 (P, As, B). The maximum solubility in Ge is an order of magnitude lower for n-dopant (1020/cm3 for P, As, 1019/cm3 for Sb), the p-dopant Ga is better soluble in Ge (several 1020/cm3) than in Si. The majority of data is obtained from bulk growth and long time annealing. The concentration of dopants is beyond the saturation curve if after annealing at the given temperature precipitations were found. This procedure works only at rather high temperature so that no precise values of the saturation at the low epitaxy temperatures are available. Doping at low temperatures seems not a solution of the doping problem keeping in mind the lower equilibrium solubility; however, the kinetic pathway to non-equilibrium and the reduction of bulk diffusion offers new opportunities. In a low temperature epitaxial growth process, the mechanism of surface segregation limits the incorporating of atoms from the surface states. Reference Yurasov, Antonov, Drozdov, Schmagin, Spirin and Novikov24 In a CVD process, reactive gases have to be used to supply adatoms on the surface. In linear theory, the segregation ratio R seg is only dependent on temperature and growth rate for a given dopant/substrate system
 $${R_{{\rm{seg}}}} = {{{n_{\rm{s}}}} \over {n{t_{{\rm{ML}}}}}}\quad ,$$
with n s as the surface density of dopants, n as the bulk density of dopant, and t ML as the thickness of a ML; 0.13 nm for Si(100). The segregation ratio is dimensionless; the pure concentration relation n s/n is called segregation length. The length dimension stems from the surface concentration that is given as atom number per area whereas the bulk concentration is counted in atom number per volume.
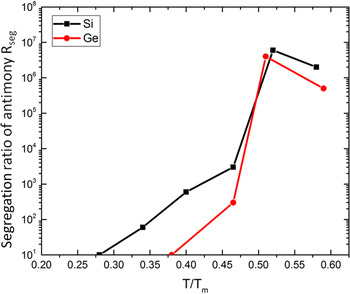
The temperature dependence of the segregation ratio R seg under MBE growth conditions shows two branches (Fig. 8). An equilibrium branch is visible with decreasing ratio R seg with increasing growth temperature at temperatures above about half the melting temperature T m. This is understood from the energy balance between dopant atoms either in the bulk (subsurface) or as adatoms on the surface. At lower temperatures, the segregation ratio decreases strongly because of kinetic suppression of an energetically favorable exchange of the matrix atom with a dopant atom. Reference Jorke25 Numerical values for Sb in Si and Ge are given in Fig. 8 as function of the normalized growth temperature (T/T m) with T as growth temperature, T m as melting temperature. Growth conditions with low segregation ratio are necessary to obtain doping levels above 1020/cm3. In MBE for Sb on Ge that means growth temperature below 340 °C, Reference Oehme, Werner and Kasper26 under CVD conditions the segregation ratio is individually influenced by gas adsorption on the surface (surfactant) but recently also high doping levels could be demonstrated. Reference Xu, Senaratne, Kouvetakis and Menendez27,Reference Shimura, Srinivasan, Van Thourhout and Loo28 Bulk saturation limits can also be overcome in thin extremely high-doped sheets, so called δ layers. Reference Klesse, Scappucci, Capellini, Hartmann and Simmons29,Reference Camacho-Aguilera, Cai, Bassette, Kimerling and Michel30
Surface segregation of dopant atoms. Dopant atoms segregate on the surface during epitaxy because the strongly bonded diamond lattice favors energetically the exchange of a subsurface dopant atom with a surface matrix atom. The figure shows the surface segregation ratio R seg [Eq. (7)] as function of the normalized growth temperature (T/T m) for Sb in Si Reference Claeys and Simoen23 and Ge. Reference Yurasov, Antonov, Drozdov, Schmagin, Spirin and Novikov24 The segregation ratio is high and temperature dependant as expected for temperatures above about T/T m = 0.5. A strong reduction of the segregation ratio sets in for growth below half of the melting point temperature because kinetic limitations are explained in more detail in the text.

C. Metastable alloy formation
For different electronic and optical functions, one would like to expand the choice of group of IV materials toward the lower side of Si with Si:C and SiGeC alloys and to the higher side of Ge with GeSn and SiGeSn alloys. However, for both sides only tiny fractions (below 1%) of C and Sn are possible under equilibrium to form a binary or ternary alloy. With higher fractions of the constituents, the alloy decomposes in two phases creating SiC or Sn precipitation within a rather pure Si or Ge matrix.
1. SiGeC
The covalent radius (quarter of the diamond lattice constant) of C (Fig. 2) is much smaller than that of Si. Hence, already small fractions of C have a large influence on lattice mismatch, band alignment and photoluminescence. Reference Eberl, Brunner, Schmidt, R. Hull and J.C. Bean31 The lattice constant a(y) of the Si1−y C y alloy deviates slightly from the linear Vegard's law. Reference Kelires32
 $$a\left( y \right) = {a_{{\rm{si}}}} - {2.4239_y} + 0.5705{y^2}$$
Pseudomorphic SiC layers on Si are under tensile strain. With the ternary alloy SiGeC strain compensation is obtained for about 8–10 times higher Ge concentration compared to C concentration. Alloys with up to a few percent C could be realized. This is a concentration which is much higher than the very small equilibrium limit of 1017–1018/cm3. Moreover, these metastable layers are very stable against annealing up to 800 °C. Even more attractive as bulk alloys are MQW and superlattice structures. The latter are predicted Reference Augusto and Forester33 to have very fascinating optical properties (pseudo direct band gap, visible emission) if realized with higher C contents.
2. SiGeSn
Metastable GeSn alloys Reference Soref34–Reference Soref36 would offer some tremendous benefits the most important of which are the following:
-
(i) Crossover of indirect-direct semiconductor characteristics at about 8% Sn content. All other group IV semiconductors are of indirect character (the conduction band minimum occurs at nonzero electron momentum). For Si, the direct conduction subband is more than 2 eV above the lowest lying indirect one, for Ge the energy distance between direct and indirect subband is shrunk to 136 meV and this difference ΔEc shrinks further with each Sn alloying (about 17 meV per 1% Sn). Figure 9 shows schematically the basic band structure of Ge and Ge-rich GeSn alloys. The conduction band consists near the band edge of two subbands, the indirect one which has lowest energy at the L-point in [111] momentum direction, and the direct one which has the lowest energy at zero momentum. The energy separation ΔE c of the two subbands determines the fraction of direct electrons in a given electron concentration. This direct electron fraction increases with the Sn content. The crossover (ΔE c = 0) takes place at around 8% Sn content of GeSn. Unstrained GeSn is a direct semiconductor beyond the crossover point. Direct semiconductor characteristics favor high emission from LEDs and laser because radiative recombination does not need phonon momentum transfer. However, the direct electron fraction is in the few percent range even at the crossover point because the effective density of states of the direct subband is much lower (about a factor of fifty) as that of the indirect subband. Full occupation of the direct subband at room temperature is obtained for ΔE c = −100 meV which needs 13–15% Sn content. The valence band consists of the light hole (lh) and heavy hole (hh) subbands which meet (
 $\delta {E_{\rm{v}}} = 0$
) at the Brillouin zone center (wave number k = 0). The effective density of states for the hh subband is higher (about a factor of ten); that means the fraction of heavy holes dominates in the unstrained GeSn.
-
(ii) Shift of absorption and emission into the MIR spectral light range. Reference Soref34 , Reference Kasper, Kittler, Oehme and Arguirov37 The band gap energies E g for the group IV semiconductors (both band gaps, indirect, and direct, are shown in Fig. 9) shrink with larger lattice constant and therefore with higher atomic numbers as the lattice constant increases with atomic number (Fig. 2). In addition, the band gap decreases with temperature correlates with the lattice expansion with temperature. Equation (1) describes the correlation between the band gap energy and the cut-off wave length of absorption which is similar to the light emission wave length from band to band recombination. Ge has a direct subband energy gap of 0.8 eV which reduces toward 0 eV for high Sn contents. The corresponding wavelengths are 1.55 µm for Ge (0.8 eV), and larger for GeSn with increasing Sn content (2 µm for E g = 0.62 eV, 3 µm for E g = 0.41 eV, 4 µm for E g = 0.31 eV).
-
(iii) Strain management for Ge.

Simplified scheme of the band structure of a metastable GeSn alloy. Given is the electron energy as function of the wave number k in [111] direction. Two subbands are shown for each band; direct and indirect conduction subband, light hole (lh) and heavy hole (hh) valence subband. Band gaps and subband energy differences are marked.

Ge is tensile strained on a VS with a larger lattice constant. This VS can be accomplished by a strain relaxed GeSn buffer on a Si substrate. Compressive strain is generated with a SiGe VS which offers smaller lattice content. Strain influences all parameters in the GeSn band gap scheme of Fig. 9. Strain splits the degeneracy of the hh and lh subbands at k = 0. With tensile strain, the lh subband moves up, which is desired for laser operation at low hole concentrations. Tensile strain reduces the indirect/direct conduction band difference ΔE c. Tensile strained GeSn on a GeSn VS with high Sn content would be a good candidate for an efficient room temperature laser. Existing technical solutions of GeSn on Ge VS suffer from an undesired compressive strain. Reference Wirths, Buca and Mantl35
A broader range of lattice constants and band gap energies is available with an extension to a ternary alloy GeSiSn. Reference Moontragoon, Soref and Ikonic38 A strain free growth of a GeSiSn alloy on Ge VS is possible if the molar ratio between Si and Sn meets 4.3.
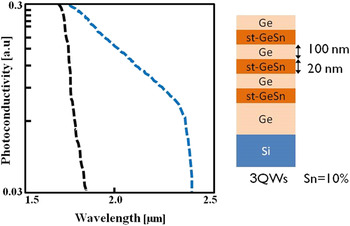
The metastable growth of GeSn alloys on Si or Ge VS was demonstrated with low growth temperature epitaxy methods (mainly MBE and CVD). In the last decade the quality of these GeSn epitaxial layers was improved that serious photonic device work could be started. As an example, a photodetector from a GeSn MQW Reference Gassenq, Gencarelli, Van Campenhout, Shimura, Loo, Narcy, Vincent and Roelkens39 is shown (Fig. 10). This detector used the photoconductivity for easy detection in a metal semiconductor metal (MSM) device. With only 60 nm compressively strained GeSn (s-GeSn) a clear extension of the cut-off wave length from 1.55 µm (Ge) to 2.3 µm could be demonstrated.
Infrared photodetector Reference Gassenq, Gencarelli, Van Campenhout, Shimura, Loo, Narcy, Vincent and Roelkens39 made from metastable GeSn quantum wells. Spectral photoconductivity compared with a stable Ge MSM detector structure. Already thin GeSn layers (3 × 20 nm) demonstrated a clear shift to a longer wave length detection regime. Data extracted from Ref. Reference Gassenq, Gencarelli, Van Campenhout, Shimura, Loo, Narcy, Vincent and Roelkens39.

D. Discussion and outlook
In the last years, the group IV epitaxy community has seen a strong progress in metastable growth of non-equilibrium heterostructures. The fabrication of metastable structures was enabled by a reduction of epitaxy temperature to about T m/2 and below. The bulk diffusion is nearly negligible in this low temperature growth window and the surface mobility of adatoms is high enough for epitaxial growth but low enough to freeze in non-equilibrium states within the timeframe t ML of a ML growth. Strain, doping, and alloy concentrations for beyond their equilibrium values are realized experimentally. Requested is now a better theoretical understanding and a description that needs not only knowledge about the equilibrium but also about the kinetic limitations. Reference Kormos, Kratzer, Kostecki, Oehme, Sikola, Kasper, Schulze and Teichert40,Reference Berbezier, Ayoub, Ronda, Oehme, Lyutovich, Kasper, Di Marino, Bisognin, Napolitani and Berti41 The stability of metastable structures against annealing and processing steps is the most important technological question. The available experiments confirm stability at considerable higher temperature than the growth temperature especially when the surface is protected by a cover layer. This improved stability against post epitaxial annealing is understood from the low speed of diffusion within the bulk. The progress in epitaxy pushed the fabrication of active device (photodetectors, absorption modulator, LED, laser) and the monolithic integration for Ge-on-Si photonics Reference Liu42 in the NIR and MIR. Main targets for the near future are the following:
-
(i) Room temperature operation Reference Camacho-Aguilera, Cai, Patel, Bessette, Romagnoli, Kimerling and Michel4 with low threshold currents for GeSn and strained Ge lasers.
-
(ii) High speed operation of normal incidence and waveguide photodetectors. Reference Michel, Liu and Kimerling43 Zero bias operation reduces dark currents and noise in low band gap semiconductors.
-
(iii) High contrast and high speed of modulators. Reference Reed, Mashanovich, Gardes and Thomson44 Absorption modulators based on Franz–Keldysh effect or quantum confined Stark effect promise small footprint and easy waveguide integration.
Further improvements in epitaxy techniques for non-equilibrium heterostructures will be expected from the following:
-
(i) Additional energy transfer to the surface besides heating the bulk. The nonthermal surface energy allows to modifying the mobility of adatoms without changing the bulk freeze-in. Reactive gas source epitaxy Reference Gruetzmacher, Wirths, Stange, von den Driesch, Buca and Mantl45 cultivates exothermic chain reactions between hydride and halogenide radicals at the surface. The energy transfer provides good crystallinity at elevated growth rates and guarantees freezing of the non-equilibrium crystal composition in the rather cool substrate. Low energy ions produced by electron gun evaporators in Si based MBE may be directed to the wafer by applying a substrate voltage (ion assisted MBE).
-
(ii) Growth of the heterostructures on nanostructured silicon substrate surfaces Reference Duska and Floro11 for ordering, stability improvement, and defect reduction. Preferably, the nanopatterned substrate is fabricated by selfordering Reference Teichert46 or by a nanoimprint Reference Niu, Capellini, Schubert, Niermann, Zaumseil, Katzer, Krause, Skibitzki, Lehmann, Xie, Känel and Schroeder47 process.
-
(iii) Short time annealing reduces the thermal budget or gives the same thermal budget at higher annealing temperatures. It is suggested as the preferred post growth anneal procedure for non-equilibrium epitaxial layers. Reference Rebohle48
ACKNOWLEDGMENTS
Discussions with colleagues about epitaxy techniques (M. Oehme, M. Bauer, D. Grützmacher, R. Loo) and device structures (G. Sun, T. Schroeder) and Si photonics (Y. Ishikawa) are acknowledged.