Implications
The extensive collection of Iberian breeds analysed and the many different methods used to rank them in their contribution to the global genetic diversity makes this study a useful tool for authorities and decision-makers on a local, national or international scale. The results can be combined with other sources of information, such as geographical, economic, historical or cultural, to establish priorities and shares in the allocation of economic resources for diversity conservation. In addition, this data set can be applied in a large-scale analysis of the European cattle, which would probably reveal interesting results about the preservation of peripheral and more variable breeds.
Introduction
The erosion of genetic diversity in many local livestock breeds as a consequence of random genetic drift has become one of the main concerns for animal breeders. In this study, most, if not all, of the breeds included have not suffered any relevant directional selection because of different circumstances: reduced rate of artificial insemination, reduced effective population sizes, which mean low genetic variability to select from, and selection programmes which, when they exist, are not well organised and have been recently implemented (less than four generations). The reduction of genetic diversity can be observed directly from the loss of heterozygosity (He) and of allelic variants, and neutral molecular markers can be used to assess the levels of genetic variation.
The domestication process of taurine cattle (Bos taurus taurus) has driven the formation of subpopulations (breeds; Scherf, Reference Scherf2000), and genetic drift converted part of the original genetic variation into genetic variation between breeds. As this process of subdivision allows for genetic differentiation between breeds, and although loss of genetic diversity occurs faster in small populations, the structure of a species subdivided into genetically isolated breeds can be, under certain conditions, a good strategy to maintain overall genetic variability (Wright, Reference Wright1951). However, many European cattle breeds are in danger of becoming extinct (Scherf, Reference Scherf2000), and are losing genetic variability accumulated during the differentiation process. In this situation, breed conservation can contribute to prevent global loss of diversity and the combination of within and between breed neutral genetic diversity can be used to prioritise genetic resources for conservation purposes (Eding and Meuwissen, Reference Eding and Meuwissen2001).
The Iberian Peninsula constitutes a geographical unit and, for long periods of time, its two countries – Portugal and Spain – also formed a political unit. The permeability along the border contributed to the history of the formation of many of the cattle breeds from this region (Sánchez-Belda, Reference Sánchez-Belda1984). Both countries are characterised by a large number of local cattle breeds, most of which are considered threatened genetic resources. Although many of the breeds included in this study have been previously characterised genetically to some extent together with other breeds (Martín-Burriel et al., Reference Martín-Burriel, García-Muro and Zaragoza1999; Cañon et al., Reference Cañon, Alexandrino, Bessa, Carleos, Carretero, Dunner, Ferrand, García, Jordana, Laloe, Pereira, Sanchez and Moazami-Goudarzi2001; Mateus et al., Reference Mateus, Eding, Penedo and Rangel-Figueiredo2004; Cymbron et al., Reference Cymbron, Freeman, Isabel Malheiro, Vigne and Bradley2005; Martín-Burriel et al., Reference Martín-Burriel, Rodellar, Lenstra, Sanz, Cons, Osta, Reta, De Arguello and Zaragoza2007; Ginja et al., Reference Ginja, Telo Da Gama and Penedo2010a), a comprehensive analysis of the genetic diversity present in the Iberian Peninsula and a source of important bovine genetic resources has never been made.
Under the assumption that the main genetic force acting is genetic drift, with the well-known consequences of increasing both within-population homozygosity and between-populations genetic differences (Falconer and Mackay, Reference Falconer and Mackay1996), neutral markers, such as microsatellites, are the most appropriate to evaluate the relative contribution of each breed to overall genetic diversity (Boettcher et al., Reference Boettcher, Tixier-Boichard, Toro, Simianer, Eding, Gandini, Joost, Garcia, Colli and Ajmone-Marsan2010). The substantial genetic differentiation and relatively high genetic diversity found in Iberian cattle should allow for a relevant analysis of genetic contributions. The estimation of these contributions is not trivial and does not have a unique solution (Caballero et al., Reference Caballero, Rodriguez-Ramilo, Avila and Fernández2010). There is also a conceptual dichotomy with regard to the importance of between-breed, as opposed to within-breed variation.
The objective of this study was to assess the relative importance of each breed in a comprehensive set of 40 out of 52 Iberian cattle breeds for maintenance of genetic diversity, by using a variety of methods to compute conservation priorities according to the estimation of breed contributions to the global diversity. The different methods combine within- and between-breed information in several ways, so as to give decision-makers a wide perspective of the distribution of the genetic variation among all breeds and thus to support conservation policies.
Material and methods
Sampling and genotyping
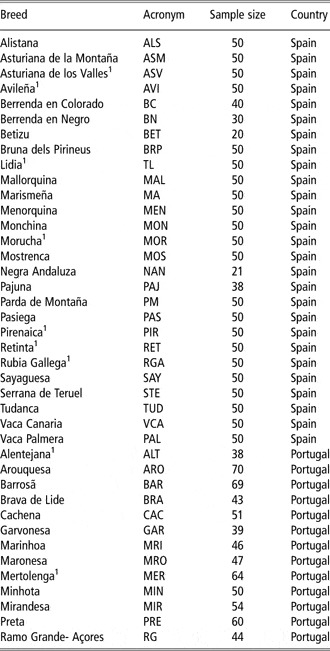
Information about the 40 native breeds analysed in this study is summarised in Table 1. Figure 1 shows breed geographical distribution.
Breed names, acronyms, sample sizes and country of origin for 40 Iberian cattle breeds

1Risk status = not endangered according to their respective National authorities.
Breed geographical distribution.

About 21 microsatellite loci recommended by the Food and Agriculture Organization (FAO, 2004) for use in genetic diversity studies were analysed: BM1818, BM1824, BM2113, CSRM60, CSSM66, ETH3, ETH10, ETH185, ETH225, HAUT27, HEL9, ILSTS006, INRA032, INRA035, INRA037, INRA063, MM12, SPS115, TGLA53, TGLA122 and TGLA227. A total of 30 samples, representing the entire allele ranges for this set of markers, were genotyped by all participating laboratories to assure compatibility of results from different equipment and laboratories. Data for INRA035 and INRA037 were removed due to the presence of null and 1 bp insertion/deletion alleles, respectively.
Further details on sample collection, DNA extraction and genotyping procedures can be found in previous publications (Martín-Burriel et al., Reference Martín-Burriel, García-Muro and Zaragoza1999; Cañon et al., Reference Cañon, Alexandrino, Bessa, Carleos, Carretero, Dunner, Ferrand, García, Jordana, Laloe, Pereira, Sanchez and Moazami-Goudarzi2001; Ginja et al., Reference Ginja, Telo Da Gama and Penedo2010a).
Statistical analysis
First, the Weitzman (Reference Weitzman1992) approach was applied to calculate the partial contributions (PC) of each breed to the total genetic diversity. The Reynolds genetic distance (Reynolds et al., Reference Reynolds, Weir and Cockerham1983) was used in the algorithm. Given the large number of breeds involved, the application of Weitzman's formula is too computationally intensive and not practical. Therefore, an approximation of the algorithm must be used. The method proposed by Garcia et al. (Reference Garcia, Corral and Canon2005) was applied here.
Several thresholds, ranging from 0.4 to 0.25, were used to test the speed of the approximation method and verify the coherence of the results. The threshold corresponds to the coefficient of variation (CV) of the diversity matrix, so that, for each iteration, if the CV is lower than the threshold, the approximation is launched; otherwise the exact algorithm is applied. Therefore, the lower the threshold, the more accurate the results will be, at the expense of computation time. A threshold of 0.25 was finally used to assess breed contributions to the overall diversity. As the approximate and the real results cannot be directly compared, the different thresholds were compared to study their behaviour as the threshold became tighter.
The absence of within-unit information in the Weitzman approach is evident, and has been criticised as an important flaw of this diversity measure (Caballero and Toro, Reference Caballero and Toro2002; Eding et al., Reference Eding, Crooijmans, Groenen and Meuwissen2002). Alternatives to include that information in the final contributions have been suggested (Garcia et al., Reference Garcia, Corral and Canon2005; Ollivier and Foulley, Reference Ollivier and Foulley2005). The aggregate diversity of Ollivier and Foulley (Reference Ollivier and Foulley2005) was used here, but the approach of Garcia et al. (Reference Garcia, Corral and Canon2005) could not be used because accurate effective population sizes were not available.
The Core Set method (Eding et al., Reference Eding, Crooijmans, Groenen and Meuwissen2002) was also applied to take into account within-breed information. Given the absence of genealogical data to calculate within- and between-breed kinships, molecular estimations were used: marker estimated kinships (MEK; Eding and Meuwissen, Reference Eding and Meuwissen2001), its extensions based on log-linear regressions, obtained with the weighted log-linear model (WLM) and weighted log-linear mixed model (WLMM; Eding and Meuwissen, Reference Eding and Meuwissen2003) and average molecular coancestries (f m) based on allele frequencies (Caballero and Toro, Reference Caballero and Toro2002). The kinship distance was used to analyse breed relationships in a hierarchical Neighbour-joining (NJ) tree and as a basis for their order in contour plots of the kinship coefficients.
Strict within-breed diversity contributions were assessed through the individual contributions of each breed to the total heterozygosis and calculated as the proportion of global He lost (or gained) from the removal of each breed (PCHe). Within- and between-breed information was combined according to Ollivier and Foulley (Reference Ollivier and Foulley2005). FST was calculated to weigh the linear combination of the within- and between-breed PCFST. Alternatively, following Chaiwong and Kinghorn (Reference Chaiwong and Kinghorn1999) and Piyasatian and Kinghorn (Reference Piyasatian and Kinghorn2003), more weight was given to the between-breed component, up to a 5 : 1 ratio (PC5 : 1).
Caballero and Toro (Reference Caballero and Toro2002) and Fabuel et al. (Reference Fabuel, Barragan, Silio, Rodriguez and Toro2004), proposed another method for combining within- and between-breed information. Using the same rationale behind the Core Set method, which defines diversity as the opposite of average coancestry, they derived a partition of the coancestry into within- and between-breed components, which can be calculated for each breed using the average within-breed coancestry and the average minimum Nei's distance between that breed and all the others. One important drawback of this approach is that each breed's contribution is weighted by the fraction of the global population size corresponding to that breed, that is, population sizes are needed for all the breeds. In the absence of this information, sample sizes can be used instead, and the more the ratio of the sample size of each breed relative to the total sample size resembles the equivalent population ratio, the more accurate the estimates will be. These estimates were also calculated ignoring sample sizes, as suggested in Fabuel et al. (Reference Fabuel, Barragan, Silio, Rodriguez and Toro2004).
Results
Breed relationships
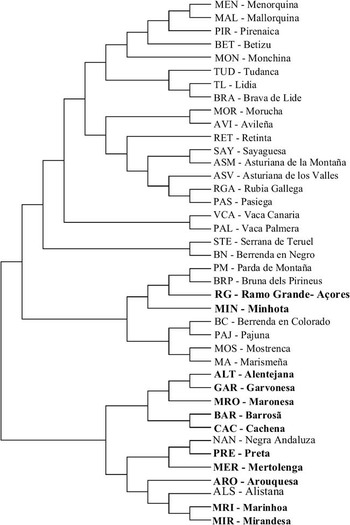
The NJ tree obtained for the 40 breeds using the kinship distance is shown in Figure 2. The clustering pattern fits the regional location of the breeds with some exceptions. The two major clusters correspond roughly to the country of origin. Only three Portuguese breeds clustered out of their group. Brava de Lide and De Lidia were separated from the rest due to the fact that both breeds are related and both share a history of genetic isolation from other breeds (Cañon et al., Reference Cañon, Tupac-Yupanqui, García-Atance, Cortés, García, Fernández and Dunner2008; Ginja et al., Reference Ginja, Telo Da Gama and Penedo2010a). Crossbreeding with other breeds not represented in the data set might explain Ramo Grande (Azores) and Minhota clustering together with Bruna de los Pirineos and Parda de Montaña, although it makes sense that the latter two breeds are close together, as they are closely located geographically. Pirenaica inexplicably grouped with the two breeds from the Balearic Islands, Mallorquina and Menorquina.
Neighbour-joining tree computed with the kinship distance. Breeds from Portugal are shown in bold.

Breeds from Northern Spain (Rubia Gallega, Asturiana de los Valles, Asturiana de la Montaña, Pasiega and Sayaguesa) clustered together accordingly and in close genetic relationship with a cluster of breeds from Western–Central Spain (Morucha, Avileña and Retinta).
One would expect Negra Andaluza to group with the Central–Southern Spanish breeds, but instead it is embedded in the Portuguese cluster, close to the Preta breed, which is distributed in Central Portugal around the Tagus River. Although this result could be due to a bias from the lower sample size of the Negra Andaluza, it might also reflect a common history between these two breeds. The other Spanish breed in the Portuguese cluster is Alistana, which has a shared origin with Mirandesa.
Breed contributions to overall diversity – Weitzman algorithm
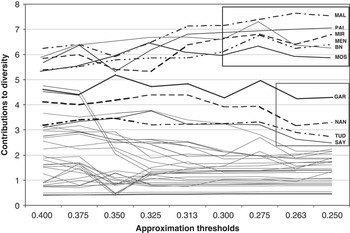
Figure 3 shows the evolution of breed contributions in percentage along the different thresholds.
Evolution of breed contributions (%) along the different thresholds tested (MAL = Mallorquina; PAL = Palmera; MIR = Mirandesa; MEN = Menorquina; BN = Berrenda en Negro; MOS = Mostrenca; GAR = Garvonesa; NAN = Negra Andaluza; TUD = Tudanca; SAY = Sayaguesa).

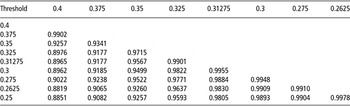
The results show a group of breeds (Mallorquina, Palmera, Mirandesa, Menorquina, Berrenda en Negro and Mostrenca) that consistently had a higher level of contribution and could be prioritised for conservation according to Weitzman's diversity (black box). A second breed group (Garvonesa, Negra Andaluza, Tudanca and Sayaguesa), with contributions ranging from 2.5% to almost 4% at the 0.25 threshold, could be considered as having a second level of conservation priority (grey box). The remaining 30 breeds had lower contributions (<2.5%, unboxed) to diversity. To assess the consistency of these results, pairwise correlation coefficients were calculated between breed contributions for each pair of thresholds. As shown in Table 2, these were high enough (>0.88 between the two extreme thresholds, >0.99 between consecutive thresholds from 0.35 to 0.25) to consider the results consistent.
Pairwise correlation coefficients between breed contributions to Weitzman's diversity

Partitioning of the genetic diversity into within- and between-breed components
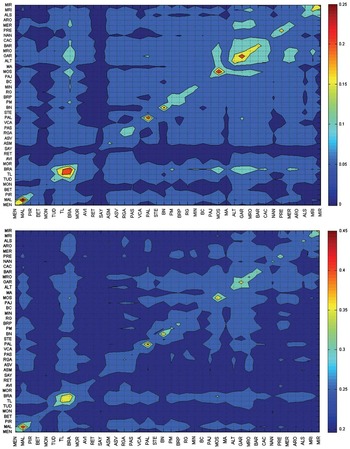
As described in the ‘Material and methods’ section, different procedures were applied to estimate within- and between-breed kinships in order to obtain breed contributions to the core set. Figure 4 shows contour plots of the MEKs obtained from individual genotypes (top) and from average coancestries calculated with allelic frequencies (bottom). In these plots, redder areas indicate higher kinship values. The breeds were arranged in the same order as in the NJ tree of Figure 2 for a better view of the clusters. The two clusters formed by Brava de Lide and Lidia and by Mallorquina and Menorquina were the most inbred. Vaca Palmera, Berrenda en Negro and Garvonesa also showed higher levels of within-breed kinship. With the possible exception of the Brava/Lidia pair, the Mostrenca breed not only had high within-breed kinship, but was more related than any other breed, to the Portuguese breed group of Alentejana, Garvonesa, Maronesa, Barrosã and Cachena, which clustered together very clearly. A certain level of relatedness was also detected among this Portuguese breed group and the Arouquesa, Mertolenga, Preta and Negra Andaluza breeds. Two other breed clusters were confirmed by the Kinship analysis: the Alistana/ Mirandesa/Marinhoa and the Berrenda en Negro/Parda de Montana/Bruna de los Pirineos/Ramo Grande/Minhota groups. Contrary to expectations that breeds with high levels of within-breed kinships such as Brava, Lidia or Mallorquina, would show low between-population values, their between-breed kinships were remarkably uniform and moderately high with all other breeds, especially when allelic frequencies were used in the calculations.
Contour plots of MEKs (marker estimated kinships; Eding and Meuwissen, Reference Eding and Meuwissen2001; top) and average coancestries, f m (bottom).

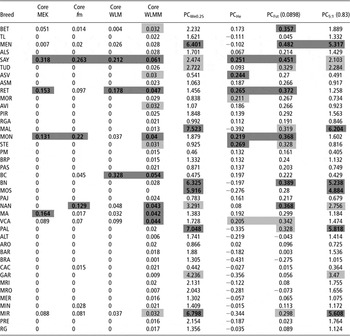
Table 3 shows breed contributions to the core set according to the different kinship matrices (Core MEK, Core f m, Core WLM and Core WLMM), Weitzman's diversity with a 0.25 threshold for the approximation (PCWe0.25), expected Hes (PCHe) and linear combinations of the latter two approaches, using FST and (1−FST) to weight the between- and within-breed contributions, respectively (FST = 0.0898), and alternatively a 5 : 1 ratio favouring the between breed component (PCFST and PC5 : 1, respectively). A disadvantage of the Core Set method is that sampling errors or populational effects can lead to negative contributions to the core set (Eding et al., Reference Eding, Crooijmans, Groenen and Meuwissen2002). As a solution, the authors proposed to iteratively make the contribution of the breed with the lowest value (most negative) zero and recalculate all contributions excluding that breed. Eventually, the algorithm will reach a suboptimal solution where there are no negative contributions. In this case, the solution was reached after zeroing 32 breeds, so that only eight breeds showed positive values. Similarly, only 12 and 10 breeds showed positive values with the average coancestry and WLM matrices, respectively. Highly prioritised breeds are easily identified, but there is no way to discriminate among breeds with null contributions. The WLMM was developed to prevent this situation, and adjusts the matrix so that there can be as few as only one breed contributing to zero.
Breed contributions to the core set using different kinship matrices, to the Weitzman diversity, to the global expected He and linear combinations of the latter two approaches, using FST and a 5 : 1 ratio to weight between- and within-breed diversity. Highly prioritised breeds are bold and shaded dark and moderately prioritised breeds are shaded light

He = heterozygosity; MEK = marker estimated kinships; f m = average molecular coancestries; WLM = weighted log-linear model; WLMM = weighted log-linear mixed model; PC = partial contributions.
Sayaguesa consistently appeared as the breed contributing most in three of the four core set applications, and in the fourth it ranked second. Furthermore, its contribution to the Weitzman diversity, ranked in the top 10. Retinta was among the top three and Monchina ranked second, fourth and seventh in three of the four Core Set methods. Berrenda en Colorado had the highest contribution to the core set according to the WLM method, and ranked second with the WLMM, but had little contribution using the average coancestries and none with the plain MEKs. Similarly, Marismeña had the second largest contribution using MEKs and ranked sixth with the WLMM model, but had little contributions under the WLM model and with the average coancestry matrix. Negra Andaluza and Vaca Canaria also had noticeable contributions to the different core sets, with Negra Andaluza ranking second when using average coancestries and fifth with the WLMM, where Vaca Canaria was fourth. This breed also had positive contributions in all the other cases, but not much higher than half the contribution of the next higher contributing breed. The WLMM model allowed for comparison among all the 40 breeds, so that a true ranking could be established. In this case, a second group of moderately contributing breeds could be distinguished that included Betizu, Asturiana de Valles, Avileña, Serrana de Teruel and Mirandesa.
As expected due to the nature of the method, Weitzman contributions prioritised breeds that were not particularly favoured by the Core Set methods. Of the top five breeds (Mallorquina, Vaca Palmera, Mirandesa, Menorquina and Berrenda en Negro), only Menorquina and Mirandesa had positive contributions to the first three core sets, and these were rather low.
Contributions to the overall expected He set Sayaguesa again as one of the most prioritised, ranking third, with Serrana de Teruel and Retinta above it. Mochina and Asturiana de los Valles also appeared highly ranked. One of the main drawbacks of calculating the loss of He when removing a breed from the pool is that there will always be many breeds with negative contributions, as all contributions must sum zero. Thus, the removal of a breed actually results in a gain in average He. According to this approach, all Portuguese breeds showed negative values, except for Arouquesa that had a very low but positive contribution.
The linear combination of the Weitzman (between-breed component) and the He (within-breed component) contributions, when weighted by the FST, generated more balanced results than each of these estimates alone. It ranked the breeds prioritised under both the Core Set and the Weitzman methods as high, with the exception of Berrenda en Colorado and Marismeña. Breeds favoured in the average He approach also ranked high with the linear combination, except Asturiana de los Valles. This combination of diversity components therefore represents a balanced intermediate ranking of breed contributions to overall diversity that incorporates most of the important breeds under either within- or between-breed approaches alone. The 5 : 1 ratio, however, does not really provide any additional information to that observed with the Weitzman contributions alone. Indeed, the correlation between them is virtually one (>0.999).
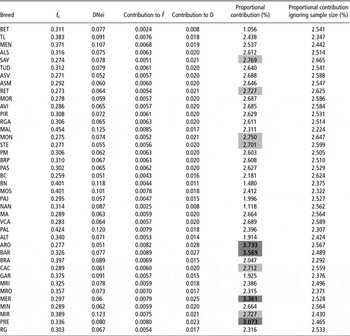
The results of the calculations of breed contributions following Caballero and Toro (Reference Caballero and Toro2002) and the estimates obtained when sample size was ignored (Fabuel et al., Reference Fabuel, Barragan, Silio, Rodriguez and Toro2004) are shown in Table 4. Contrary to the results shown in Table 3, the most prioritised breeds were the Portuguese, with Arouquesa, Barrosã, Mertolenga and Preta as the top four. Sayaguesa ranked as the fifth most contributive breed. Retinta, Monchina and Serrana de Teruel ranked moderately high here too, as they did before. However, these results are only valid if the sample structure reflects the real population structure, that is, if the ratio of breed sample size to total sample size approaches the ratio of breed population size to total population size. In this case, and because most breed sample sizes were similar, those few breeds with larger samples could be favoured, as appears to be the case of the four top ranking breeds.
For each breed, f ii, DNei with rest of the breeds, absolute contribution to the global coancestry, absolute contribution to diversity, proportional contribution to gene diversity and proportional contribution to diversity ignoring sample sizes are shown. Highly prioritised breeds are bold and shaded dark and moderately prioritised breeds are shaded light

f ii = average within-breed coancestry; DNei = average Nei-distance;  = global coancestry.
The contributions obtained ignoring the sample sizes were more uniform, with only slight differences among breeds, which is not very useful for practical prioritisation purposes. It is also arguable whether ignoring sample sizes is much better than using them to obtain biased contributions (see Fabuel et al., Reference Fabuel, Barragan, Silio, Rodriguez and Toro2004 for additional discussion on corrections in the weight).
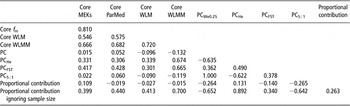
The linear correlation coefficients calculated for pairwise contributions obtained with the different prioritisation methods are shown in Table 5. As expected, there is a strong negative correlation between the Weitzman and the He contributions (−0.635), and the correlations of the PC5 : 1 with all other methods are almost equal to those of the Weitzman approach, because of the excess weighting given to the between-breed component (i.e. Weitzman) in the linear PC5 : 1 combination. Correlations with the Core Set methods are not too meaningful, because of the many null contributions. Only the values obtained with the WLMM matrix can lead to some conclusions, like the relatively high correlation of these with the contributions to the global He.
Pairwise correlation coefficients between the contributions obtained with the different methods, in the same order as shown in Table 3 and Table 4

MEK = marker estimated kinships; WLM = weighted log-linear model; WLMM = weighted log-linear mixed model; PC = partial contributions; f m = average molecular coancestries.
The proportional contributions from Table 4 do not correlate much with those from other methods, except for a moderate negative correlation with the Weitzman and the PC5 : 1 contributions. As for the proportional contribution obtained ignoring sample size, their correlation with other methods was similar to those from the average He contributions.
Discussion
Many of the diversity studies published over the past two decades had the objective of estimating genetic differences between breeds and, as a consequence, priorities for conservation were mainly based on genetic distances (Hodges, Reference Hodges1992), thus ignoring genetic variability and its distribution within breeds.
Management of the genetic diversity in subdivided populations and the prioritisation of breeds for optimal allocation of resources, in order to maximise the global variation, have been the subject of several more recent publications (see review by Toro and Caballero, Reference Toro and Caballero2005). Both methodological and field studies have been widely published in recent years (Bennewitz and Meuwissen, Reference Bennewitz and Meuwissen2004; Fabuel et al., Reference Fabuel, Barragan, Silio, Rodriguez and Toro2004; Mateus et al., Reference Mateus, Eding, Penedo and Rangel-Figueiredo2004; Garcia et al., Reference Garcia, Corral and Canon2005; Bennewitz et al., Reference Bennewitz, Kantanen, Tapio, Li, Kalm, Vilkki, Ammosov, Ivanova, Kiselyova, Popov and Meuwissen2006; European Cattle Genetic Diversity Consortium, 2006; Hayes et al., Reference Hayes, He, Moen and Bennewitz2006; Tapio et al., Reference Tapio, Varv, Bennewitz, Maleviciute, Fimland, Grislis, Meuwissen, Miceikiene, Olsaker, Viinalass, Vilkki and Kantanen2006; Boettcher et al., Reference Boettcher, Tixier-Boichard, Toro, Simianer, Eding, Gandini, Joost, Garcia, Colli and Ajmone-Marsan2010), and yet no consensus has been reached on how to appropriately account for the between- and within-population components of genetic variation (Meuwissen, Reference Meuwissen2009; Caballero et al., Reference Caballero, Rodriguez-Ramilo, Avila and Fernández2010).
The choice between prioritising within- or between-breed diversity is not an easy task. Both components should be taken into account, but how to weight them is not consensual. Favouring within-breed diversity allows for a better response to selection and adaptation, whereas weighting between-breed variation is useful to assess crossbreeding/admixture and to create synthetic populations (Barker, Reference Barker1999; Tapio et al., Reference Tapio, Varv, Bennewitz, Maleviciute, Fimland, Grislis, Meuwissen, Miceikiene, Olsaker, Viinalass, Vilkki and Kantanen2006). Inbred populations with low levels of genetic variability are less viable than those with large effective sizes and high He, but combining distant and eventually inbred populations, with different alleles segregating at high frequencies, leads to new populations with a high genetic variability due to the new heterozygotes.
There is a paradox underlying the use of within- v. between-population components of genetic variation in conservation calculations. If one favours the between-population diversity, as in the Weitzman or the Piyasatian and Kinghorn (Reference Piyasatian and Kinghorn2003) methods, distant and more differentiated breeds, such as Menorquina, Mallorquina, Palmera, Berrenda en Negro, Mostrenca, Garvonesa, Negra Andaluza, Mirandesa or Tudanca, are prioritised. Nonetheless, distant breeds have generally undergone strong genetic drift and have high levels of inbreeding, as reflected here by their high coancestries (f ii > 0.312, Table 4). They can be just a mere source of alleles rarely found in other breeds and not contribute significantly to overall diversity with within-breed variation. Therefore, it could be argued that breeds with large effective sizes should be prioritised instead of these genetically ‘exhausted’ breeds. However, all of these breeds, except for Mostrenca and Garvonesa, still ranked high when the weight of the between-breed component was reduced by using the FST, as proposed by Ollivier and Foulley (Reference Ollivier and Foulley2005). Only the Sayaguesa breed was prioritised by all the methods (Tables 3 and 4), and two more breeds (Retinta and Monchina) were prioritised by most but not all of these approaches.
Furthermore, investing money in breeds prioritised under the between-breed diversity criterion would raise yet another tricky situation: preserving breeds with higher between-population diversities and implementing breeding programmes aimed at increasing their effective sizes while minimising coancestries, would actually reduce global diversity – still under the hypothesis of considering between-breed variation only – as their average distance from the remaining breeds would eventually be reduced. The outcome would be ‘healthier’ breeds (considering, generally speaking, that a breed is healthy when it has features like high effective size, low homozygosity or low-kinship levels, and thus minimises the loss of genetic diversity by time unit), which is good, but less global variation, which is bad. And yet, one cannot help considering that directing financial resources towards the most endangered breeds seems like a sensible thing to do. But in a scenario in which only between-breed diversity was considered, the way to maintain global diversity would be to keep breeds as far apart as possible. One way to accomplish this is to maintain or increase selection and drift effects, leading to more homozygous populations. This would certainly maximise diversity in hypothetical intercrossings, but in practice no funds would be given by any decision-maker to increase inbreeding and it is also unlikely that local breeders would comply with a policy ultimately aimed at creating breed intercrossings.
If the within-breed component is prioritised instead, those breeds with higher heterozygosities (such as Retinta or Asturiana de los Valles in this study), allelic diversities or effective population sizes would be favoured in the allocation of financial resources. But what is the point in investing more resources in breeds or populations that are already not at risk because they have a ‘healthy’ genetic structure? Furthermore, higher genetic diversity of some breeds can also be a result of admixture and there would be the risk of preserving crossbred populations, such as Monchina, Serrana de Teruel, Vaca Canaria, Minhota and Ramo Grande-Azores (see also Ginja et al., Reference Ginja, Penedo, Sobral, Matos, Borges, Neves, Rangel-Figueiredo and Cravador2010b).
Approaches focusing on minimising coancestry generally result in opposite priorities to those of distance methods, thus favouring less endangered breeds, which are those that actually need less support. This might be useful in cryoconservation programmes aimed at creating a bank of genetic resources in case a natural or human-triggered disaster brought the species to the verge of extinction and artificial reintroduction of genetic material became necessary. For practical in situ conservation plans, though, it is quite unlikely that local breeders would naturally accept the creation of a mixed new population, and thus the approach would have no purpose. In the context of in situ breed conservation, other methods might prove useful, such as that proposed by Fernández et al. (Reference Fernández, Toro and Caballero2008) and implemented in METAPOP software (Perez-Figueroa et al., Reference Perez-Figueroa, Saura, Fernández, Toro and Caballero2009) in which a certain amount of optimal introduction of migrant genes among the different breeds would be allowed to maximise global genetic diversity.
Still, the concept of conservation priorities seems somewhat pointless for purposes of allocation of resources when local domestic breeds are involved and species viability is not threatened. This is all the more so if one considers the other-than-genetic factors, such as cultural, historical, economical, etc., that are influential, if not capital, for the decision-makers, along with the fact that in situ farm conservation is generally preferred. However, it would be interesting to further narrow population subdivision and determine conservation priorities within breeds, instead of (or maybe complementary to) setting priorities at the breed level. Comparing herds, lineages, regions or other pertinent subdivisions could be of practical management interest, at least in the case of traditional or local breeds where significant population substructure exists, for example, Lidia cattle. The lack of field implementations of the methodologies described here (i.e. actual policies with decisions based at least partly on priorities derived from a genetic diversity analysis) could probably be easily overcome if the underlying hypothesis of admixing subunits such as herds, rather than breeds, were to be used as a background concept to maximise diversity.
The special case of the two fighting bull breeds (Toro de Lidia and Brava de Lide) included in this study must be discussed here. These two breeds have similar production systems and breeding traditions, which resulted in their subdivision into genetically differentiated and mostly isolated lineages named ‘encastes’ (Cañon et al., Reference Cañon, Tupac-Yupanqui, García-Atance, Cortés, García, Fernández and Dunner2008; Ginja et al., Reference Ginja, Telo Da Gama and Penedo2010a). Both breeds maintain a level of genetic diversity that is higher than many other European breeds (Cortes et al., Reference Cortes, Tupac-Yupanqui, Dunner, Garcia-Atance, Garcia, Fernandez and Canon2008; Ginja et al., Reference Ginja, Penedo, Melucci, Quiroz, Martinez Lopez, Revidatti, Martinez-Martinez, Delgado and Gama2010c). However, neither of these breeds is prioritised by the methods used in this study, with zero contribution to the core set – except for the WLMM model – and negative contributions to the average He. Furthermore, because of the high level of inbreeding found, Brava de Lide had the most negative contribution to the PCHe ranking among all breeds. The sampling of 50 unrelated individuals per breed selected across independent herds was originally and theoretically designed to estimate genetic distances between breeds (FAO, 1993). However, it is possible that for highly subdivided breeds in which an important proportion of the genetic variability is distributed among herds, this sampling procedure underestimates breed contributions to the total genetic diversity because it does not represent the real population accurately.
Finally, another consideration to be made relates to the type of markers used, as this is an important factor in accounting for the limitations of this kind of conservation study and the reduced impact on real-life applications to breed conservation. First, the markers in this study are assumed to be neutral and mainly influenced by genetic drift. Therefore, other evolutionary processes of interest, such as adaptation and/or selection for economic traits were not accounted for in the calculations. In addition, the number of microsatellite markers used in this and similar studies is somewhat limited. Both problems will most probably be overcome soon with the release of dense marker maps and the establishment of research projects at the level of genomics (Gibbs et al., Reference Gibbs, Taylor, Van Tassell, Barendse, Eversole, Gill, Green, Hamernik, Kappes, Lien, Matukumalli, McEwan, Nazareth, Schnabel, Weinstock, Wheeler, Ajmone-Marsan, Boettcher, Caetano, Garcia, Hanotte, Mariani, Skow, Sonstegard, Williams, Diallo, Hailemariam, Martinez, Morris, Silva, Spelman, Mulatu, Zhao, Abbey, Agaba, Araujo, Bunch, Burton, Gorni, Olivier, Harrison, Luff, Machado, Mwakaya, Plastow, Sim, Smith, Thomas, Valentini, Williams, Womack, Woolliams, Liu, Qin, Worley, Gao, Jiang, Moore, Ren, Song, Bustamante, Hernandez, Muzny, Patil, San Lucas, Fu, Kent, Vega, Matukumalli, McWilliam, Sclep, Bryc, Choi, Gao, Grefenstette, Murdoch, Stella, Villa-Angulo, Wright, Aerts, Jann, Negrini, Goddard, Hayes, Bradley, Barbosa da Silva, Lau, Liu, Lynn, Panzitta and Dodds2009). Among other advantages, the use of a large number of markers will allow for more precise estimations of coancestries, which are key to several measures of diversity, and for doing conservation analyses at the level of breeds, herds and individuals. As well, it will be possible to consider the effects of both neutral and adaptive genetic variation from distinct genomic regions (Windig and Engelsma, Reference Windig and Engelsma2010). This volume of genomic information will also allow for the increase in effective population size and the minimisation of within-individual variation (Wang and Hill, Reference Wang and Hill2000).
In conclusion, this study analysed the between- and within-breed components of extant genetic diversity of Iberian cattle, and performed a comprehensive comparison among the methods that can be used to rank breeds for conservation. This information can be complemented with that of other markers and used by local authorities in conservation programmes. In addition, the data can be applied in a large-scale analysis of European cattle, which could reveal interesting results with regard to the preservation of peripheral and more variable breeds, such as those of native cattle.
Acknowledgements
We wish to acknowledge the financial support of the INIA and European Regional Development Fund no. RZ01-002-C2-1, RZ01-002-C2-2, RZ2004-00009, RZ2008-00006-C02-02 and RZ2008-00005-C02-02. We also thank the breeder associations who provided the biological samples. C. Ginja was supported by a grant from Fundação Portuguesa para a Ciência e a Tecnologia (Ref. SFRH/BD/13502/2003).