




No CrossRef data available.
The Latino Vote in the 2004 Election
Published online by Cambridge University Press: 06 April 2005
Extract
In presidential elections over the last several decades, observers have noticed twopatterns involving Latinos. The first, according to DeSipio and de la Garza (2002, 398), is that “With each presidential election, the media and thepunditocracy discover Latinos anew.” As Jorge Ramos (2004) pointedout, “Without fail every four years, many politicians in the United States rediscoverLatinos, only to forget them all over again for the next three years…It is a phenomenon sopredictable that I have dubbed it the ‘Christopher Columbus Syndrome.”’
Information
- Type
- Features
- Information
- Copyright
- © 2005 by the American Political Science Association
Introduction
In presidential elections over the last several decades, observers have noticed two patterns involving Latinos. The first, according to DeSipio and de la Garza (2002, 398), is that “With each presidential election, the media and the punditocracy discover Latinos anew.” As Jorge Ramos (2004) pointed out, “Without fail every four years, many politicians in the United States rediscover Latinos, only to forget them all over again for the next three years…It is a phenomenon so predictable that I have dubbed it the ‘Christopher Columbus Syndrome.”’
The second facet is early high hopes for the political importance of Latinos that are dashed on Election Day. Latinos receive much attention in the early stages of the campaign, usually with some reference to their growing numbers, and analysts wonder if this is the year the so-called sleeping giant will awake. By the end of the election, it is clear that Latinos were far from the decisive factor. As summarized by DeSipio and de la Garza:
Rapid growth in their numbers presage rapid growth in votes and influence. High levels of immigration and previous quiescence among the U.S.-born suggest something new, mysterious— and for some—dangerous. Concentration in electoral-college rich states such as California, New York, Texas, Florida, and Illinois allow scenarios to emerge wherein presidential candidates must cater to Latino voters to win. Despite these recurring predictions, each election is followed by a somewhat disappointing review in which the Latino promise is not met and in which ongoing problems (most notably low turnout) are advanced as easy explanations. (2002, 398)
To what degree did this election follow the above pattern? To be sure, the campaign did feature many breathless news reports and cable news commentaries about the potential importance of the Latino vote for the George W. Bush and John F. Kerry campaigns. Contrary to the usual pattern, however, the post-election analysis did not contain disappointed stories about low turnout and the political impotence of Latinos. On the contrary, Latino participation was estimated to have surged from 5.9 million in 2000 to at least 7 million in 2004. More importantly, some exit polls suggest that a record 44% of Latinos supported the Republican presidential candidate and thereby helped to create “Un Nuevo Dia” for the Bush administration.
How High is 44%?
Just how unprecedented is the 44% figure? Over the past four decades, the Latino vote has always supported Democratic presidential candidates, albeit by varying numbers. Contrary to some claims, there is no clear trajectory to this support—in the last two decades, there has been substantial variation.
The most concise guide to Latino preferences is the polling data brought together by DeSipio (1996) and DeSipio, de la Garza, and Setzler (1999), covering presidential elections from 1960 to 1996. One caveat is that we do not know how “Latinos” voted before 1972, as the only available data are for Mexican Americans. This is important because Cuban Americans are more likely to support Republican candidates. In this 1960 to 1972 period, the average Mexican-American vote for the Democratic candidate was 84%.
From 1976 to 1996, we see that 68% of Latinos on average voted for the Democratic candidate. This ranged from a low of 56% in 1980, when Ronald Reagan defeated Jimmy Carter, to a high of 72% in 1996, when Bill Clinton defeated George H. W. Bush and Ross Perot. 1976 and 1996 are also similar low points in the Latino Republican vote—18% and 21%, respectively. That Latino support only increased three percentage points during this period casts some doubt on the claim that a long-term realignment of Latinos is taking place (although 6% of Latinos voted for Perot in the latter contest).
Some analysts describe the relative success of Ronald Reagan in 1984 among Latinos—winning about 37% of the vote—and compare it to the present election. These analysts rarely note that Latino Republican support dropped to 32%, 28%, and 21% in the next three elections, which suggests a personal and not a partisan dynamic. While Ross Perot's candidacy in 1992 and 1996 complicates the issue, if we assume that Latino Perot voters would have split evenly in those years without Perot on the ballot, the Republican level of support in the “post-Reagan plummet” was 32%, 31%, and 24%. The same dynamic could be true for Republican candidates in the post-Bush era—or we could see the start of a Latino realignment.
We might be cautious about claims of growing Latino support for Republicans because similar claims in the past did not withstand scrutiny. While some pundits and politicos claimed that such Latino support grew from 2000 to 2002, for instance, James Gimpel showed that the Latino vote for Democratic candidates remained fairly stable. Comparing Latino voting in both elections, he concluded that: “Republicans had made no appreciable gains among Latinos. To the extent that the proportion of Latinos voting Republican had increased, it was principally a consequence of their low turnout in heavily Democratic areas coupled with the lopsidedness of some of that year's gubernatorial elections” (Gimpel 2003). Nevertheless, “Following the 2002 mid-term elections, the strong Republican showing brought legions of GOP pundits, consultants, and sympathetic journalists forward to crow about the on-going realignment of Latino voters.” Gimpel also argued that a similar dynamic took place in the Texas 1998 gubernatorial elections, whereby many thought Bush “had made inroads into the Latino community there when, in fact, legions of Latino Democrats were deactivated by an especially weak Democratic candidate. This was also the story of the 2002 midterms.”
Nevertheless, the idea that Latinos can change their partisan allegiances, or at least cross over in a particular election, is not impossible to entertain. For instance, one-third of Latino Republicans are former Democrats (de la Garza et al. 1992, Table 8.25). In addition, there are some regions where Latinos have “flip flopped” in adjacent elections. For instance, according to pollster Sergio Bendixen: “If there is a model for why the Hispanic vote is considered a swing electorate in the United States, it would be the Orlando market. The way they voted in 2000 and 2002 is classic” (Padilla 2004). This refers to the Latino (and mostly non-Cuban) vote in Florida along the I-4 corridor, which supported Gore in 2000 but then switched to support Governor Jeb Bush in 2002 (Padilla 2004).
The Exit Poll Controversy
Following the November 2, 2004 election many scholars and pundits questioned the accuracy of national exit polls that showed Kerry narrowly winning battleground states that he ultimately lost. Despite inconsistencies between the exit polls and the official state vote totals, few journalists asked questions about the “surprising” Latino vote. Instead, the 44% figure was accepted by many and often repeated.
In 2004, there were three major exit polls. The first was conducted by Edison/Mitofsky for the National Election Pool (ABC, Associated Press, CBS, CNN, FOX, and NBC) and the second was by the Los Angeles Times. The former showed Bush receiving about 44% of the Latino vote, and the second indicated a 45% level of support—both a considerable increase from 2000 when Bush won 35% of the Latino vote.1
In 2000, the Latino vote went 62% for Gore, 35% for Bush, and 3% for “other.”
The third exit poll, conducted by the Willie C. Velazquez Research Institute (WVI), conflicted with the first two. It found that 31.4% of Latinos support Bush while 67.7% supported Kerry.
Such large differences between the polls sparked some debate. According to the research director of the WVI: “We were kind of shocked ourselves at the [exit polls] and started re-checking our figures. We reverified everything and came to the conclusion that the weighting system used by the networks was inaccurate” (Olivera 2004). Andy Hernandez at Trinity University in San Antonio said that only 30% of the respondents in the Edison/Mitofsky survey were from urban areas, while 46% were from the suburbs, and 25% were from rural areas. “In other words, 70 percent of the people surveyed are not from urban areas. Suburban areas tend to have higher incomes, and the precincts are Anglo-dominant, so they tend to vote more Republican” (Gomez 2004). The problem, according to Antonio Gonzalez, president of WVI, is that: “We're the most urban electorate in America. There are not lots of rural or suburban Latinos anywhere. What you get when you have a general market survey is one that shows more Latinos who are Republicans” (Tolson 2004).
On the other hand, Warren Mitofsky responded that, “We stand behind the [44%] number” (Fears 2004).2
According to the article, “Zogby, president of Zogby International, stood by his numbers. He said he has ‘great respect’ for Bendixen but ‘no one with any understanding of Hispanics has duplicated the 44 percent’ for Republicans in post-election surveys. Zogby believes the correct percentage for Hispanic Bush supporters is 33 to 38.”
Bendixen cited Zogby International, which he said conducted 13 percent of its interviews with Hispanics in Spanish on its way to predicting that Kerry would win 61 percent of the community's vote. It was a mistake, Bendixen said, to poll less than 40 percent of the Hispanic community in its native language. ‘You have to have the right ratio,’ Bendixen said, or the poll will be thrown off.” (Fears 2004)
A recent report by the National Council of La Raza (NCLR) discusses the possibility that the 44% figure could be credible if there was a late shift of undecided Latinos toward Bush and an even split of new (since 2000) Latino voters (NCLR 2004). Using this scenario, which NCLR considers “unlikely” (4), one arrives at a Bush Latino support figure of 43.75%. The NCLR report also cites other points made by supporters of the exit poll results. For instance:
“the NEP data confirm substantial ticket-splitting by Latino voters in many states. For example, in California, NEP reports Latino voters supporting Senator Kerry over President Bush by a 63%–32% margin, and Democratic Senator Barbara Boxer by a much wider 73%–23% margin…. If the NEP and other media exit polls were uniformly biased in favor of Republicans, one might ask, why didn't this bias also show up in the same NEP results in Senate races where Latinos heavily favored Democrats?” (4)
According to Louis DeSipio of UC-Irvine: “The national exit poll [Edison-Mitofsky] is trying to be representative of the population of the 50 states. It's not paying attention to the composition of the Latino community.” DeSipio also noted that the WVI survey likely overrepresented Latinos in urban areas, while the Edison/Mitofsky poll likely underrepresented urban Latinos (Puzzanghera 2004). He concluded that Latino support for Bush is likely in-between the figures generated by WVI and Edison/Mitofsky. “I think it's more realistic to say that 37, 38 or 39 percent of Hispanics voted Republican. And that still shows that more Hispanics vote Republican, so it's still significant” (Gomez 2004).
Comparing the accuracy of these polls will not be possible unless they all provide information on their sampling strategies and fully release their data.3
As NCLR (2004) observed, “It's also worth noting that the exit poll data are continuously ‘re-weighted’ during and after elections to account for variations in turnout from predicted models, and to conform to actual results. Exactly when, and how, these changes are made typically are not made public by the pollsters, so whether and the extent to which their samples conform to the actual population distribution of voters is not known” (3). A recent news story noted that WVI had increased its estimate of the Latino vote for Bush to 35% while NBC News revised its estimate of the Latino Bush vote to 40%. See Brosnan (2004).
Data from the Pre-Election Surveys
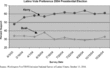
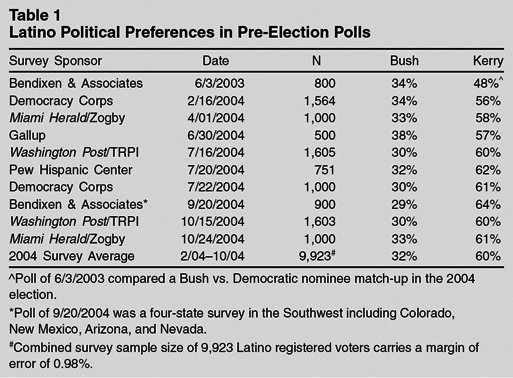
As noted above, one reason why the 44% statistic is suspect is that it conflicts with almost all of the major preelection surveys of Latino registered voters. An assessment of 10 surveys conducted between June 2003 and October 2004 found strong and consistent support for John Kerry and the Democratic Party. On average, they suggest that Kerry might have expected a 2-to-1 advantage in the 2004 contests. Table 1 lists the name of the polls, their respective sample sizes, and the Latino anticipated vote between Kerry and Bush. Figure 1 graphically illustrates the trend over time.


In none of the 10 surveys does President Bush reach 40% among Latinos, and in nine of the 10 he was found to receive less than 35% of the Latino anticipated vote. Support for Kerry hovers around the 60% mark. Overall, the surveys conducted in 2004 combine for a weighted average of 32% for Bush and 60% for Kerry, with less than a 1% margin of error (given a combined 9,923 sample size).
Furthermore, two of the surveys were carried out by the same research/media partnership—the Tomás Rivera Policy Institute (TRPI) in conjunction with the Washington Post and Univision Television—which provides an ideal comparison of Latino preferences at two points in time. The two national telephone surveys of Latino registered voters, using the same sampling methodology,4
The Washington Post/Univision/TRPI survey polled 1,600 Latino registered voters in the 11 states containing more than 100,000 Latino registered voters; it accounts for 88% of Latino registered voters nationwide. The samples were drawn from official registered voter lists, and Latinos were identified by way of the U.S. Census Spanish surname list. Fieldwork was carried out by Interviewing Service of America (ISA) of Van Nuys, CA. These two surveys were conducted jointly by a number of researchers affiliated with the three media and academic organizations. We are particularly grateful to a team of researchers at the Tomás Rivera Policy Institute, including Harry Pachon, Louis DeSipio, and Dario Moreno, for working with the authors on every aspect of the survey project. We also thank Richard Morin and Christopher Muste at the Washington Post, and Rob Scroth and Tom Eldon who represented Univision, for their contribution to the development of the surveys.
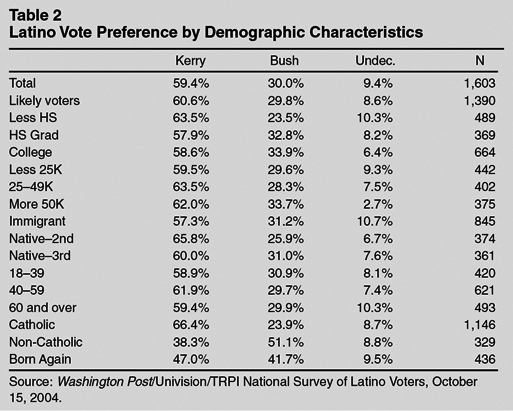
Second, with little exception, support for John Kerry was strong across a wide variety of Latino respondents. As seen in Table 2, when broken down by education, income, age, and immigration status, the Latino vote consistently favored the Democratic candidate in the TRPI survey taken two weeks prior to the election. For example, with respect to education level, Kerry held a 40-point advantage over Bush among Latinos with less than a high school diploma (63.5 to 23.5), but he also maintained a 25-point edge among the college-educated (58.6 to 33.9). While Kerry lost and Bush gained support among more educated Latino voters, the margin was still close to 2-to-1 in favor of the Democrat. Similarly, the Kerry lead over Bush was 25 to 30 points among Latino households that earn less than $25,000 and also among those that earn more than $50,000 per year. Further, immigrants and U.S.-born Latinos displayed very similar vote preferences for Kerry over Bush. In sum, with regard to education, income, age, and immigrant status, every subsection of the Latino electorate stated a vote preference lower than 35% for President Bush.

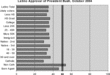
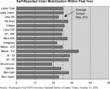
The one exception appears to have been religion, whereby a Catholic/Protestant split is evident. Among Catholics, who compose about 70% of all Latino voters, Kerry held over a 40-point lead. Among nonCatholics, Bush was favored by 13 points (51.1 to 38.3). Given the large lead for Kerry among Catholics, and their numerical majority among the Latino electorate, non-Catholic Latino turnout would need to be almost 100% to elevate Bush's Latino support to 44%—a feat even Karl Rove would have trouble achieving. However, the data in Figure 3 from the October TRPI poll suggest that non-Catholics were only slightly more likely to report being mobilized than Catholics—28% versus 24%—which seems to suggest that reports of hypermobilization among Latino Protestants are overstated.

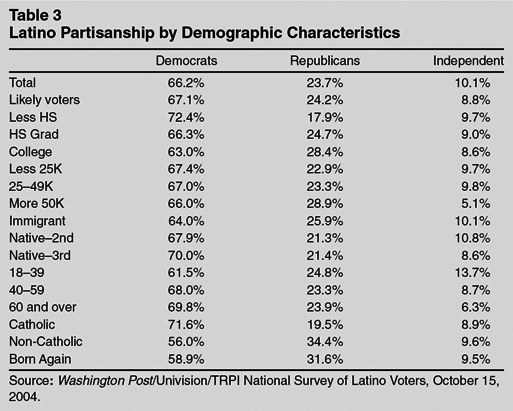
Building on the vote preference numbers, Table 3 reports party identification, including leaners, for Latino registered voters by demographic subgroups. In short, the percentages reported in Table 3 are quite consistent with the vote percentages reported in Table 2. Overall, 66% of Latinos ally themselves with the Democratic Party, 24% with the Republican Party, and 10% identify as independents. While some of the percentages differ across various socioeconomic indicators, the patterns are very similar: Latinos continue to identify with the Democratic Party by well over a 2-to-1 margin. While pundits and scholars alike often point out that polls do not account for turnout differences, the implication here is that higher turnout among the high-SES groups would not considerably skew the Latino electorate or their preferences. High-SES and low-SES Latino voters reported strong attachments to the Democratic Party and support for its nominee, John Kerry.
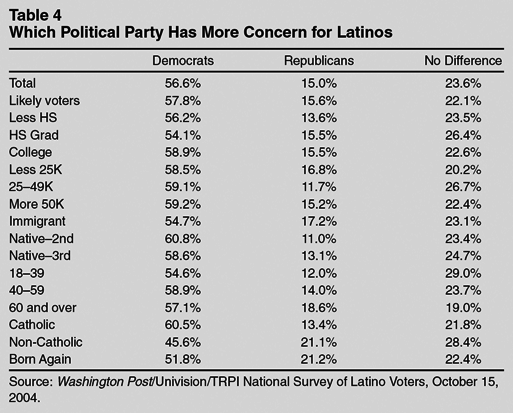
Along these same lines, when asked which party has more concern for Latinos, the Democratic Party is favored 57 to 15 over the Republican Party, with 24% citing no difference. Again, within each subsection of the Latino electorate Democrats are seen as having more concern for Latinos. Even non-Catholics rate Democrats more favorably than Republicans by nearly 25 points.

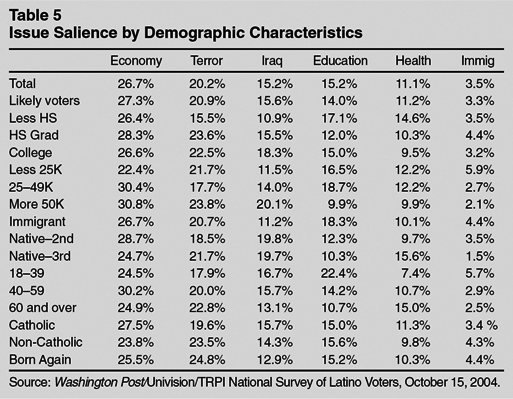
While the Democrats enjoy a registration advantage, it is possible that in 2004 they were disadvantaged when it came to the issues. Following the election, some journalists suggested that Latinos' conservative religious values led them to the Republican's “moral values” campaign. However, polls conducted on issue salience prior to the election do not bear this out. Among every slice of the Latino electorate—educated and uneducated, poor and rich, young and old, foreign- and native-born, Catholic and Protestant—the number one election issue was the economy. The war on terrorism consistently rated second, followed by the situation in Iraq, education, health care, and immigration-related concerns. These findings are consistent with previous research that suggested economic/education/health issues are high priorities for Latinos and that socio-religious values are less critical on Election Day (Barreto et al. 2002).
Religion and the Latino Vote, Part II
Given the possible role of religion in this election, we should further explore this dynamic. According to Adam Segal, director of the Hispanic Voter Project at Johns Hopkins University, “The Bush campaign used moral values, and especially the national discussion over gay marriage and abortion rights, as wedge issues within the Hispanic community to try to break off a conservative religious segment” (Johnson 2004). Commentary in the New York Times said that Latino support for Bush “happened, in part, because the Republicans went to church” (Curiel 2004). An article in the San Jose Mercury News reported that: “The conservative group Focus on the Family had a major Latino outreach program revolving around opposition to abortion rights and gay marriage. The group aired Spanish-language advertisements on 200 radio stations nationwide and sent information to about 13,000 churches” (Puzzanghera 2004).
Indeed, the 2004 election reveals a “religion gap” in the electorate. According to the NEP exit poll, George W. Bush did particularly well among Protestants, born-again Christians, and regular church-goers. For example, Bush beat Kerry by 19% (59 vs. 40) among Protestants, by 57% (78 vs. 21) among born-again Christians, and by 22% (61 vs. 39) among weekly church-goers. It is also true that Bush fared better than he did in the 2000 election among less religious voters. Few would doubt, however, that religious conservatives have become a pillar of the president's coalition.
One might therefore wonder how religious conservatives in the Latino electorate cast their ballots in the 2004 elections. If Bush indeed garnered 44% of the Latino vote, Latino religious conservatives should have supported the president in disproportionately large numbers. No other particular segment of Latino voters—with the exception of Cuban Americans and Republicans—seemed to rally behind the president. Cuban Americans—a traditional, staunch voting bloc for the Republicans—were solidly behind the president, and so were Latino Republicans. As reported in Table 6, the October Washington Post/Univision/TRPI poll shows that 80% of Cuban-American voters, who made up about 6% of the Latino electorate, indicated they would support Bush in the presidential election. Twenty-four percent of Latino voters in the same poll identified with or leaned toward the Republican Party, and 86% of Republican identifiers and leaners reported their intention to support Bush. While such levels of support for the president are impressive, these two groups of voters alone are not enough to make up 44% of the Latino vote.


As shown in Table 7, Bush indeed did very well with Latino evangelical or born-again Christians. Latino evangelicals favored Bush over Kerry by 58% to 33%, and Bush also garnered 49% of the vote among other Christians (including mainline Christians). However, Kerry enjoyed strong support from Latino Catholics (68% vs. 24%) and non-Christians or seculars (62% vs. 29%). This indicates there was a religion gap within the Latino electorate; Latino non-Catholic Christians were part of Bush's coalition of religious voters and helped with his bid for re-election. One should note, however, that nonCatholic Christians constitute only 18% of the Latino electorate, as the great majority of Latino voters are Catholic. Despite their relatively high level of support for Bush, the number of nonCatholic Christians is too small to help Bush reach 44% of the Latino vote.

With that said, we have observed that there are two segments of voters in the Latino electorate that are considered to be part of the Republicans' winning coalition—Cuban-American and nonCatholic Christian (mostly evangelical) voters. Table 8 reveals that non-Catholic Christians were also more likely than Latino Catholics or seculars to identify with the Republican Party. For the Republicans, appealing to Latino evangelicals and other non-Catholic Christians may be the key to making (small) inroads to the Latino electorate, while Latino Catholics would be an important part of a future winning coalition for the Democrats.

Evidence from Texas
In addition to the pre-election surveys, there is evidence to suggest that Latinos may not have supported Bush in the commonly-cited mid-40% range. Consider the state of Texas, where one out of four Latino voters lives. The national exit poll numbers suggest that Bush won the “Tejano” vote by about 59–41 over Kerry,5
A recent “post-election adjustment” by Edison/Mitofsky revised the Texas vote estimate to 50% for Kerry and 49% for Bush. This is six points higher than Bush's total in 2000. See Associated Press (2004).
In Table 9, official vote totals from heavily Latino counties along the Mexico border show Kerry winning comfortably. For example, in Starr County, which is 98% Latino, Kerry won 74% of the vote. In Zavala he won 75%, in Duval he won 71%, in Brooks he won 68%, and in Dimmit he won 66%—all counties with over 85% Latino populations. Given that he did so poorly in the South Valley region, for Bush to have captured almost 60% of the statewide Latino vote, he would have had to win 80% or more in the urban centers.

However, the electoral data in Table 10 for heavily Latino precincts in Dallas suggest otherwise. In precinct 3100, which is 92% Latino, Kerry won 87% of the vote. Across town in precinct 1120, Kerry won 84% in a neighborhood that is 85% Latino. According to ecological inference analysis for all precincts in Dallas, Kerry won an estimated 71% of the Latino vote. This is consistent with the Washington Post/Univision/TRPI survey, conducted two weeks before the election, which showed Kerry with a 2-to-1 margin over Bush among Latinos in Texas. While the border county and Dallas analyses do not include Latinos in many parts of Texas, there are not enough probable Latino Republican votes in the rest of the state to get to the 59% level (Teixera 2004).

Conclusions
We conclude that the pre-election data provide little evidence that President Bush received the 44% level of support from Latinos estimated by the 2004 exit polls. We examined 10 such surveys and found Latino support averaging 60% for Kerry and 32 percent for Bush—which is the traditional two-to-one ratio of support enjoyed by the Democratic Party. Support for Kerry and Bush was large and found within almost every standard Latino demographic. Equally problematic is the lack of movement over time for Bush in these surveys. In addition, two surveys by the Washington Post/Univision/TRPI in both July and October found a 60–30 split, and Latinos were generally more likely to identify as Democrats (66%) than Republicans (24%).
There is also no evidence from the Washington Post/Univision/TRPI surveys that Latino non-Catholics, who did support Bush more than did Catholics, were highly mobilized. They are also a relatively small percentage of the Latino electorate, so it is unlikely that this segment turned out sufficiently to raise overall Latino support for Bush to 44%.
Evidence from Texas counties and urban precincts also calls into question the exit poll claim that Bush achieved 59% of the Latino vote in his home state, which in turn suggests there may be problems with the national Latino exit poll data. Given these consistent patterns, it seems more logical to conclude that the exit polls mistakenly depicted the Latino vote than to accept that Latino preferences could have changed so substantially in such a short period.
More generally, does this election portend a growing influence for Latinos in presidential contests? We already know that the number of Latino elected officials is growing at the local, state, and even congressional levels. For instance, there will be 23 Latinos in the House of Representatives and two in the Senate in the 109th Congress, whereas the respective numbers were 11 and zero two decades ago. With two very close presidential elections in a row, some wonder if now is the time for this growing population to flex its “swing voter” muscles and put its concerns squarely on the national agenda.
Because of the closeness of the election, every Latino vote is said to count—ranging from the small Latino populations in Iowa and Wisconsin to the large groups in Florida. For instance, one story noted that in the 2000 election, 31,000 Latinos voted in the battleground state of Wisconsin, where Gore defeated Bush by a margin of only 5,708 votes (Bustos 2004). As a way to gauge the importance of Latinos in battleground states, the numbers are less impressive than they sound. When a candidate wins by that small a margin, the importance of every group—almost regardless of how small—is magnified. Latinos may have decided the Wisconsin vote, but so did many cities, counties, ethnicities, and occupational groups in Wisconsin.
More realistically, Latinos were being discussed as potential difference makers in Florida and New Mexico, and perhaps also in Nevada, Colorado, and Arizona. The Democrats were excited about the possibility of turning some red states blue, but the Election Day reality showed this to be premature. Kerry lost all of the above states, and the only place where Latinos could possibly be described as “swing voters” was Florida and New Mexico. As the Latino vote has always been central to politics in New Mexico, and Latinos have been important to Florida politics for two decades, this does not seem to indicate that any dramatically new patterns of Latino political influence have emerged at the present moment.
Another point is that Bush's 35% in 2000 and his likely 39% in 2004 (according to Teixeira 2004) closely parallel the estimated support for Ronald Reagan in 1984—the previous high point of Latino support for Republicans. In this light, Bush's numbers may represent not the beginning of a Latino realignment but the electoral ceiling for Republican presidential candidates with appealing personalities. Reagan's 37% did not prevent the senior Bush from dropping to 32% in the next election, and by 1996 the Republicans were down to 21% Latino support (24% if we divide Perot's 6% Latino support equally between Clinton and Dole). Although Bush may have increased his Latino support vis-à-vis 2000, despite many predictions to the contrary, Republicans must be cautious less they experience their own “post-Reagan plummet” and lose Latino support in 2008 and subsequent elections.
Lastly, the debate regarding the Latino vote is a continuation of a long-standing controversy. Almost two decades ago, analysts and commentators discussed the lack of reliable data with which to evaluate Latino political preferences and voter turnout (de la Garza 1987). Despite the progress that has been made over the last two decades, a version of this problem is evident in the conflicting claims about the Latino support for Bush and Kerry in 2004. Given the potential role Latinos may play in future elections, it is critical that pollsters and analysts take care to both accurately sample Latino populations and to accurately analyze the resulting data. Claims made about the Latino vote in this—and every—election have important consequences. No longer can the ascertaining of Latino policy opinions, candidate preferences, partisan affiliations, and turnout rates be considered a tangential issue in the study of American politics.
References
Barreto Matt, Rodolfo de la
Garza, Jongho Lee,
Jaesung Ryu, and
Harry Pachon. 2002 “Latino
Voter Mobilization in 2000: A Glimpse Into Latino Policy and Voting Preferences. Report No.
2.” Claremont, CA: Tomas Rivera Policy Institute.Google Scholar
Brosnan James, W.
2004 “Hispanic Vote Less for Bush than Exit
Polls Showed,” Scripps Howard News Service, December
2.Google Scholar
Bustos Sergio. 2004 “Hispanics Lose Clout They Had in ‘00 Vote,” El Paso
Times, August
26.Google Scholar
Corral Oscar. 2004 “Nationally, Hispanics Favor Kerry by Wide Margin,” The Miami
Herald, October
31.Google Scholar
Curiel Carolyn. 2004 “Editorial Observer: How Hispanics Voted Republican,” New York
Times, November. 8Google Scholar
De la Garza Rodolfo O.
1996 “El Cuento de los Numeros and Other Latino Political
Myths.” In Latino Politics in California, ed.
Anibal Yanez. San Diego: Center for
U.S.-Mexican Studies.Google Scholar
De la Garza Rodolfo O., ed. 1987
Ignored Voices: Public Opinion Polls and the Latino Community. Austin,
TX: Center for Mexican American Studies.Google Scholar
De la Garza Rodolfo O.,
Louis DeSipio, F.
Chris Garcia, John Garcia, and
Angelo Falcon. 1992
Latino Voices: Mexican, Puerto Rican, and Cuban Perspectives on American
Politics. Boulder, CO: Westview Press.Google Scholar
DeSipio Louis. 1996
Counting on the Latino Vote: Latinos as a New Electorate.
Charlottesville: University of Virginia Press.Google Scholar
DeSipio Louis, and Rodolfo O. de
la Garza. 2002 “Forever Seen as New: Latino
Participation in American Elections.” In Latinos: Remaking America, eds.
Marcelo SuarezOrozco and Mariela
M. Paez. Berkeley: University of California
Press.Google Scholar
DeSipio Louis, Rodolfo O. de la
Garza, and Mark Setzler. 1999 “Awash in the Mainstream: Latinos and the 1996 Elections.” In
Awash in the Mainstream: Latino Politics in the 1996 Elections, eds.
Rodolfo O. de la Garza and
Louis DeSipio. Boulder, CO: Westview
Press.Google Scholar
Fears Darryl. 2004 “Pollsters Debate Hispanic's Presidential Voting: Discrepancy in Estimates
vs. Results Examined,” Washington Post, November
26.Google Scholar
Gimpel James G.
2004 “Losing Ground or Staying Even? Republicans and the
Politics of the Latino Vote.” Washington, D.C.: Center for
Immigration Studies.Google Scholar
Gimpel James G.
2003 “Latinos and the 2002 Election: Republicans Do Well
When Latinos Stay Home.” Washington, D.C.: Center for Immigration
Studies.Google Scholar
Gomez Lisa Marie. 2004 “Why Don't Hispanic Polls Seem to Add Up?” San Antonio
Express-News, November
7.Google Scholar
Johnson Kirk. 2004 “Hispanic Voters Declared Their Independence,” New York
Times, November
9.Google Scholar
National Council of La Raza (Charles Kamasaki, Clarissa Martinez, and Jessica
Muñoz). 2004 “Memorandum: How Did
Latinos Really Vote in 2004?” Washington, D.C.: Author,
November
16.Google Scholar
Olivera Mercedes. 2004 “Election's Latino Vote May Reflect New Range of Support,”
Dallas Morning News, November
12.Google Scholar
Padilla Maria T.
2004 “Winning Hispanic Votes is Tricky for
Bush, Kerry,” Orlando Sentinel, September
19.Google Scholar
Puzzanghera Jim. 2004 “GOP Outreach at Churches Aided President with Nationwide Gains,”
San Jose Mercury News, November
4.Google Scholar
Ramos Jorge. 2004 “Hispanics are Belles of Ball for Election,” Special for the
Arizona Republic, August
8.Google Scholar
Teixeira Ruy. 2004 “44 Percent of His-panics Voted for Bush?”
http://www.alternet.org/election04/20606/, November
24.Google Scholar
Tolson Mike. 2004 “Exit-Poll Math Doesn't Add Up, One Institute Says,” Houston
Chronicle, November
6.Google Scholar
Latino Political Preferences in Pre-Election Polls
Latino Vote Preference by Demographic Characteristics
Latino Partisanship by Demographic Characteristics
Which Political Party Has More Concern for Latinos
Issue Salience by Demographic Characteristics
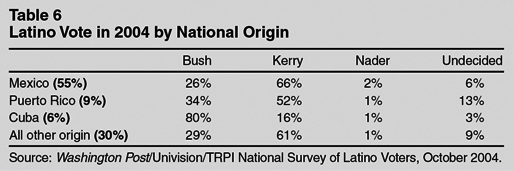
Latino Vote in 2004 by National Origin
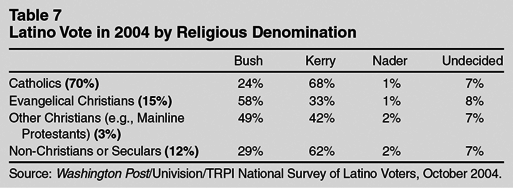
Latino Vote in 2004 by Religious Denomination
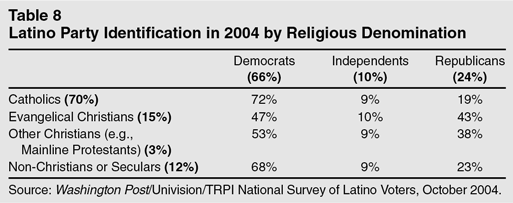
Latino Party Identification in 2004 by Religious Denomination
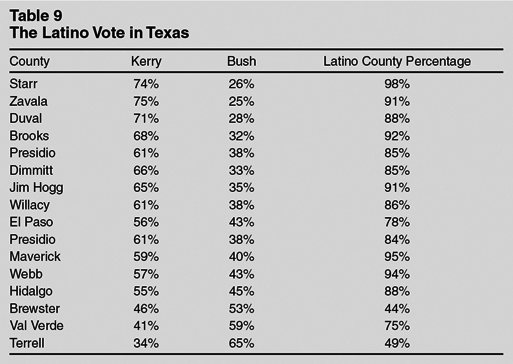
The Latino Vote in Texas
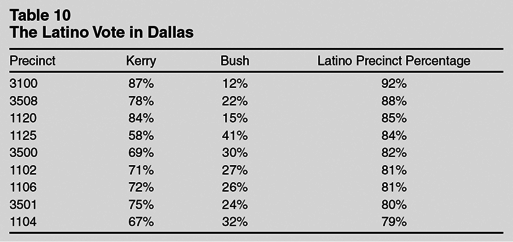
The Latino Vote in Dallas
 You have Access
- 19
- Cited by