Chlorhexidine gluconate (CHG) bathing is a widely implemented infection control measure.Reference Swan, Ashton and Bui1 In randomized trials and quasi-experimental studies, CHG has been demonstrated to decrease patient infection rates, frequency of healthcare worker contamination, and transmission of antibiotic-resistant bacteria.Reference Donskey and Deshpande2–Reference Milstone, Passaretti and Perl4 CHG is believed to act by reducing contamination of the skin and, subsequently, the surrounding environment.Reference Weinstein5 One study showed an inverse association between CHG concentration and gram-positive bacterial burden when CHG concentrations were >18.75 μg/mLReference Popovich, Lyles and Hayes6; however, this was a single-center study with only 20 patients. Despite increasing evidence suggesting the benefits of CHG bathing,Reference Donskey and Deshpande2–Reference Milstone, Passaretti and Perl4 little research has been done to guide optimal CHG bathing practices by determining whether the CHG concentrations are associated with decreases in resistant bacterial bioburden in real-world settings.
The aim of our study was to examine the association between CHG concentrations and methicillin-resistant Staphylococcus aureus (MRSA), carbapenem-resistant Enterobacteriaceae (CRE), and vancomycin-resistant Enterococcus (VRE) bioburden on the skin. We hypothesized that the bioburden decreases as the CHG concentration on the skin increases. Additionally, we explored whether bacterial bioburden is affected by method and the time since the last CHG bath.
Methods
From May 2017 to August 2018, patients with MRSA, CRE, and VRE from 4 hospitals in the United States were enrolled as a part of a multicenter cohort study. All participants had a clinical or surveillance culture positive for 1 of these organisms within the previous 7 days. Intact skin was cultured to quantify bacterial bioburden using a sterile stencil at 2 sites: the antecubital fossa and the chest. CHG samples were collected from an adjacent area used to sample bacterial bioburden. At the time of patient enrollment, we recorded the method of CHG bathing (ie, 2% impregnated cloth or 4% CHG liquid soap) and time since the last CHG bath. To quantify bioburden, swabs were inoculated onto selective plates to count the colony-forming units per milliliter (CFU/mL) after serial dilution. A colorimetric, semiquantitative method was used to estimate CHG concentrations as previously described.Reference Popovich, Lyles and Hayes6–Reference Alserehi, Filippell and Emerick8
Statistical analysis
Descriptive statistics for bioburden and CHG concentration were calculated. The CHG concentration was analyzed both as a continuous and a dichotomous variable (≤20 ppm vs >20 ppm) based on prior studies where a CHG concentration ≤18.75 μg/mL was considered inadequate to lower gram-positive bacteria.Reference Popovich, Lyles and Hayes6, Reference Alserehi, Filippell and Emerick8 The bacterial bioburden (x + 1) was log transformed, expressed in log10 CFU/mL, and analyzed as a continuous variable. All samples of MRSA, CRE, and VRE were analyzed in individual groups to study the relationships among the bacterial burden, CHG concentrations, time since last bath, and type of bath. The χ2 test, Spearman’s correlation, and linear regression were computed. Results were summarized as mean estimates and corresponding 95% confidence intervals.
Results
In total, 253 patients were enrolled in the study: 89 with MRSA (35%), 108 with CRE (42%), and 56 with VRE (22%). Moreover, 50 MRSA patients (56%) and 26 CRE patients (25%) were bathed with CHG cloths. All VRE patients were bathed with CHG liquid soap. The medians and interquartile ranges (IQRs) for CHG concentrations were as follows: MRSA,100 ppm (IQR, 30–200); CRE, 20 ppm (IQR, 0–100); and VRE, 10 ppm (IQR, 5–50). The median bacterial bioburdens were zero for MRSA, CRE, and VRE.
On the arm skin site, we detected MRSA in 17 patients (19%), CRE in 16 patients (15%), and VRE in 12 patients (21%). Detectable CHG levels were observed in 82 MRSA patients (93%), 81 CRE patients (79%), and 44 VRE patients (79%). We found a nonsignificant negative correlation between bioburden and CHG concentration for MRSA (rs = −0.11; P = .28) and CRE (rs = −0.02; P = .82), and a nonsignificant positive correlation was observed for VRE (rs = 0.15; P = .28).
On the chest skin site, MRSA was detected in 25 patients (28%), CRE was detected in 18 patients (17%), and VRE was detected in 7 patients (13%). Detectable CHG levels were observed in 83 MRSA patients (95%), 78 CRE patients (72%), and 43 VRE patients (77%). We found a nonsignificant negative correlation between bioburden and CHG concentration for MRSA (rs = −0.16; P = .12) and nonsignificant positive correlations for CRE (rs = 0.18; P = .06) and VRE (rs = 0.24; P = .06).
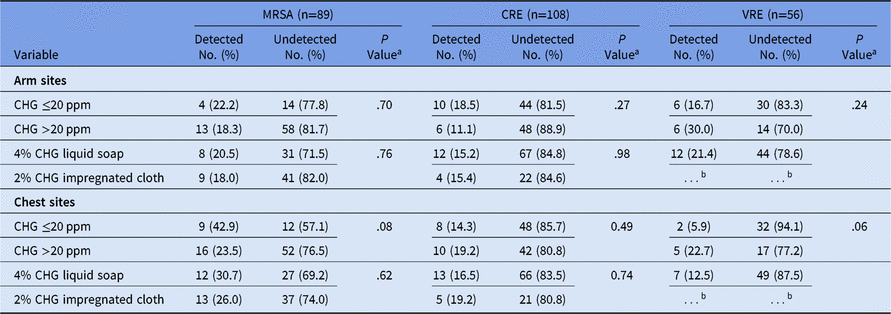
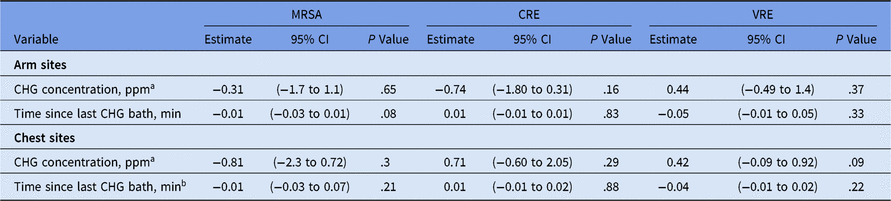
We found no significant difference in bacterial bioburden when comparing CHG concentrations of >20 ppm with CHG concentrations ≤20 ppm (Table 1). On the arm skin site, we detected MRSA in 13 patients (18%), CRE in 6 patients (11%), and VRE in 6 patients (30%) with CHG concentrations >20 ppm, compared to MRSA in 4 patients (22%), CRE in 10 patients (19%), and VRE in 6 patients (17%) with CHG concentrations ≤20 ppm. On the chest skin site, we detected MRSA in 16 patients (24%), CRE in 10 patients (19%), and VRE in 5 patients (23%) among those with CHG concentrations >20 ppm, compared to MRSA in 9 patients (43%), CRE in 8 patients (14%), and VRE in 2 patients (6%) with CHG concentrations ≤20 ppm. The bioburden did not differ by the method of CHG bath. The mean estimates of bioburden on both skin sites did not show a significant decrease with an increase in CHG concentration from ≤20 ppm to >20 ppm and were not affected by the time since the last CHG bath (Table 2).
Selected Characteristics of Patients at Each Skin Site by Bacterial Bioburden Detected for MRSA, CRE, and VRE

Note. MRSA, methicillin-resistant Staphylococcus aureus; CRE, carbapenem-resistant Enterobacteriaceae; VRE, vancomycin resistant Enterococcus; CHG, chlorhexidine gluconate. Bathing with 4% CHG liquid was done using an entire 4 oz bottle of 4% CHG diluted in 4 l water.
a P value is for χ2 test for categorical variable.
b No observations recorded.
Univariate Regression for Log Transformed Detectable Skin Bioburden for MRSA, CRE, and VRE Calculated Separately for Each Skin Site

Note. MRSA, methicillin-resistant Staphylococcus aureus; CRE, carbapenem-resistant Enterobacteriaceae; VRE, vancomycin resistant Enterococcus; CHG, chlorhexidine gluconate; CI, confidence interval. At the time of patient enrollment, the most recent date and time of CHG bath prior to patient enrollment was recorded from the treating nurse and confirmed with the electronic medical record of the patient to estimate time in minutes since the last CHG bath.
a Estimate represents the calculated mean bioburden log10 CFU/mL for an increase in CHG concentration from ≤20 ppm to>20 ppm for arm and chest sites.
b Estimate represents the calculated mean bioburden log10 CFU/mL for every minute increase in the time since the last CHG bath for arm and chest sites.
Discussion
In our study, CHG concentrations on the skin were high and the detection of MRSA, VRE, and CRE on 2 skin sites was infrequent. We did not find the hypothesized association between higher CHG levels and lower bacterial burden. Furthermore, our study suggests that CHG bathing reduces bacterial bioburden irrespective of the application method used.Reference O’Horo, Silva, Munoz-Price and Safdar9
We did not find an inverse association between bacterial burden and CHG concentration when CHG concentration analyzed as a continuous variableReference Popovich, Lyles and Hayes6, Reference Alserehi, Filippell and Emerick8 nor as a categorical variable ≤20 ppm or >20 ppm. Thus, CHG bathing may have a beneficial impact even at lower detectable concentrations. Our results are supported by Edmiston et al,Reference Edmiston, Krepel, Seabrook, Lewis, Brown and Towne10 who found that the minimum inhibitory concentration of CHG for Staphylococcus skin isolates was 4.8 ppm, which is approximately the lower limit (5 ppm) of CHG detection in our assay. We used the same method to measure CHG levels as in previous studiesReference Popovich, Lyles and Hayes6–Reference Alserehi, Filippell and Emerick8; however, the incongruent associations observed between the skin bioburden and CHG concentration, time since the last CHG bath, and CHG concentration raise the concern that the CHG assay for detection of CHG levels may not be reliable or that another CHG level monitoring device may be needed to acquire more accurate quantitative levels. Our findings are inconsistent with those presented by Popovich et alReference Popovich, Lyles and Hayes6; however, we studied different bacteria, and our sample size was notably larger.
A limitation of our study was that we quantified bioburden and recorded CHG concentrations only at 2 skin sites in comparison to previous studies that included 3–5 skin sites.Reference Popovich, Lyles and Hayes6–Reference Alserehi, Filippell and Emerick8 Moreover, with the high number of skin sites with no bacteria detected, our study was likely underpowered to assess the association between CHG concentration and bacterial bioburden.
In summary, our findings suggest that in hospitalized patients bathed with CHG, bacterial MRSA, CRE, and VRE bioburden on the skin is low, irrespective of CHG bathing method and the time since the last CHG bath. However, considering the inconsistent association between levels of CHG on the skin and bacterial bioburden, additional research is needed. The daily frequency of CHG bathing has been arbitrarily chosen and standardized across all populations. It is plausible that CHG bathing frequency could be optimized for individual patient populations to augment the reduction of bacteria while minimizing side effects. To better implement these varying CHG bathing approaches, greater understanding of the association between CHG concentrations and resistant-bacterial bioburden is needed.
Acknowledgments
The authors thank Corey Sparkes from the Pathology Department, University of Maryland, for specimen processing. We also thank Sarah Jackson for her work on the VRE patient cohort.
Financial support
This work was supported by the Centers for Disease Control and Prevention’s Prevention Epicenter Program (grant no. U43CK000450-01 to A.D.H.) and the National Institutes of Health’s National Institute of Allergy and Infectious Diseases (grant no. R01 AI121146-01 to A.D.H.).
Conflicts of interest
All authors report no conflicts of interest relevant to this article.