Introduction
This article examines the distribution of net higher education subsidies with respect to income in the United Kingdom. Until recently British university students were required to pay tuition fees that covered only a portion of the cost of their education, and historically students paid no fees. Motivated primarily by fiscal considerations, in 2010 the government approved an increase in the maximum annual tuition fee at English universities from £3,000 to £9,000, resulting in widely publicised protestsFootnote 1 (hereafter we refer to these reforms as the ‘2012 reforms’). The recent controversy makes it more interesting than ever to ask how the costs and benefits of higher education subsidies are distributed. We find that the distribution under the system in place from 1994 to 1997 was regressive. As we discuss in the conclusion, English reforms since 1998, including the introduction of fees and income-contingent loans, have increased progressivity among graduates. If the 2012 reforms achieve the stated goal of reducing public expenditure on higher education, then the regressive impact on the broader population will also be diminished.
Higher education subsidies can be designed to enhance efficiency and/or equity. In the absence of subsidies, higher education may be consumed at a level below the social optimum. Two examples of market failures that might lead to under-consumption of higher education are externalities (individuals do not account for the social benefits of their education when making an education decision) and imperfect capital markets (prospective students are unable to obtain loans to finance their education). Besides increasing higher education participation overall (an efficiency consideration), subsidies may also be used to encourage particular groups to enrol in university (an equity consideration). However, the distributional effects of subsidies are not always self-evident. The immediate effect of any higher education subsidy is to redistribute income from taxpayers to students, but students go on to pay taxes that fund future higher education subsides. Every individual therefore receives a lifetime net subsidy equal to the difference between the subsidy he or she receives, if any, and the taxes he or she pays towards higher education. Variations in the average net subsidy across income groups provide a measure of the system's progressivity or regressivity.
In this article we do not analyse the efficiency consequences of British higher education subsidies. Rather, we focus on the positive distributional question of whether British higher education subsidies are progressive, neutral or regressive. With respect to the pre-1998 system, we find that nearly all graduates receive positive net higher education subsidies: they never pay as much in higher education taxes as they received in direct benefits as students. Non-graduate taxpayers naturally receive negative net subsidies since most non-graduates never attended university and therefore never received a subsidy. Since university graduates tend to earn more than non-graduates, we find that over the life cycle, British higher education subsidies amounted to transfers from low-income to high-income groups; that is, the distribution of net higher education subsidies under this system was regressive.
Our finding of regressivity is based on our estimated distribution of direct individual benefits, net of reasonably estimated individual tax burdens. We view this as a useful initial benchmark calculation, but two important caveats are worth acknowledging from the outset. First, generous subsidies could have important effects on the extensive margin. Our estimates would overstate the regressivity of subsidies if significant numbers of individuals would not have attended university without the subsidies, and therefore would have had lower lifetime earnings. A second caveat is that higher education may generate positive externalities. While externalities relate primarily to efficiency rather than distributional consequences, our estimates would again overstate regressivity if low-income non-graduates receive significant positive externalities from the increased productivity of subsidised graduates. We discuss both caveats in the conclusion.
The next section of the article provides background on the British system of higher education subsidies. The third section provides an overview of our data and empirical strategy. The details of our empirical strategy and results are presented in the fourth section. The fifth section presents the main results on the regressivity of British subsidies to higher education in the mid-1990s. We discuss important caveats and conclude in the final section.
Background
The population of primary interest in our empirical work is employed individuals born in the years 1976 to 1979 who were living in the UK at age eighteen. Members of this population were between the ages of twenty-eight and thirty-one at the time of our 2007 earnings sample, and would have been eligible to matriculate into university in the academic years 1994/5 through 1997/8. These years were selected as the focus of our analysis as they represent a relatively stable period in the midst of decades of changes in higher education finance.
Beginning in the 1970s, rising participation in higher education and the elimination of fees increasingly strained government resources. Nevertheless, students matriculating until 1997 were not required to pay fees. These students also had access to a combination of maintenance loans and means-tested maintenance grants. Those enrolling in or after 1998, however, were faced with a means-tested tuition fee of up to £1,000 and no longer had access to maintenance grants. This tuition fee was charged up front and tested on parental income, and, for the first time, maintenance loan repayments became income contingent. After 2006, English universities were allowed to set variable tuition fees of up to £3,000, and income-contingent fee loans were introduced. Means-tested maintenance grants also returned (Callender, Reference Callender and Texeira2006). These reforms, as well as those introduced in 2012, are consistent with the following broad principles:
[H]igher education remains free at the point of use; the government lends money to students to enable them to pay universities the fee that they charge for tuition; once they have left university (whether or not they have graduated) former students repay their loans through the tax system by paying a 9 per cent tax surcharge on income they earn above the threshold level set by the government; and once they have repaid their loans, repayments cease. (Thompson and Bekhradnia, Reference Thompson and Bekhradnia2010: 2)
Overview of empirical strategy and data
The study we follow most closely is Johnson (Reference Johnson2006), which explores the distribution of net higher education subsidies in the United States. Earlier influential work includes Hansen and Weisbrod (Reference Hansen and Weisbrod1969), Pechman (Reference Pechman1970) and Blaug (Reference Blaug and Blaug1987). Using National Longitudinal Survey of Youth data, Johnson (Reference Johnson2006) analyses the distribution of net subsidies with respect to various definitions of parental income, child income and dynastic income. By each of these metrics, Johnson finds that American higher education subsidies are mildly progressive, with the top decile primarily subsidising the system and all other deciles experiencing positive or only slightly negative transfers. We apply Johnson's methodology to the available data for British university graduates and non-graduates. In contrast to Johnson's findings for the United States, we find that British higher education subsidies were regressive in the mid-1990s.
Overview of empirical strategy
The analysis consists of four steps. First, we estimate lifetime earnings for each individual in our sample. Second, we measure the value of the gross higher education subsidy provided to each individual who completed a full-time first (bachelor) or foundation degree.Footnote 2 Next, using higher education spending figures and approximate tax liabilities, we estimate the share of each individual's lifetime tax liability that can be attributed to the funding of higher education subsidies. Finally, we define the net subsidy as the difference between the gross subsidy and the lifetime higher education tax liability. Additional details related to our assumptions and methodology are provided in the next section. In the results section, we examine how the net subsidy is distributed across deciles of lifetime income.
Data
Broadly speaking, we rely on three sources of data, one for each of the first three steps in our analysis:
• Our lifetime earnings estimates are based on data from the Quarterly Labour Force Survey (QLFS). The QLFS is a household survey organised by the Office for National Statistics (ONS) in Great Britain and the Department of Enterprise, Trade, and Investment in Northern Ireland (ONS, 2009). Currently, each quarterly sample includes roughly 50,000 households in Great Britain and 2,000 households in Northern Ireland, representing approximately 0.1 per cent of the respective populations. The survey provides extensive detail on personal and household characteristics, employment history and earnings, among other topics. Our QLFS sample is drawn from July to September for 2007. Although more recent data are available, we decided to use data from before the recession beginning in 2008.
• We estimate the value of higher education subsidies using data from various publications by the Higher Education Statistics Agency (HESA), the UK's official agency for the collection and dissemination of data related to higher education. We use the 1994/5 to 1997/8 editions of the publications Resources of Higher Education Institutions and Students in Higher Education Institutions, as well as Higher Education Statistics for the UK (HESA, 1996a, b, 1997a, b, c, 1998a, b, 1999a, b, 2001, 2002). These three series provide detailed data on income of higher education institutions by source, enrolment of students in higher education institutions by level and mode of study and domicile and the value of student maintenance support.
• Our estimates of lifetime tax liabilities rely on ‘The effects of taxes and benefits on household income’, 1994–95 to 1997–98, from a series of annual articles and data stretching back to 1961 (ONS, 1995, 1997, 1998; Harris, Reference Harris1999). Each edition estimates the effects of direct and indirect taxes, along with cash and in-kind benefits, on income of households in the UK. The data are derived from the annual Family Expenditure Survey, which collects information on expenditure and income of private households.
Details of empirical strategy and results
The analysis in this article proceeds under two major assumptions. The first is that patterns of taxation and higher education expenditure remain constant throughout the working lives of the cohort. Even though higher education finance reforms have already been implemented, this assumption makes it possible to assess the long-term effects of a particular regime. The second assumption is that higher education subsidies are funded exclusively from household tax revenues. This assumption abstracts from the effects of corporate taxes and government borrowing.Footnote 3 This second assumption affects our findings to the extent that corporate taxes and bond issuances render the effective tax burden more or less progressive.
Lifetime income estimates
Our lifetime earnings projections are based on experience–earnings profiles estimated from a single cross-section of British individuals in paid employment in 2007. Following Murphy and Welch (Reference Murphy and Welch1990), we estimate quartic experience–earnings regressions.Footnote 4 We estimate four separate regressions: one each for male graduates, female graduates, male non-graduates and female non-graduates, where graduates are defined as individuals holding a first degree or higher. We assume that work experience begins at age seventeen for non-graduates, age twenty-one for individuals with a first degree or higher, and age twenty for individuals with a foundation degree. Each of the four regressions is of the OLS specification:
 \begin{equation}
{\it Ingrsswk}_{\it it} = \beta _0 + \beta _1 \,{\it exper}_{\it it} + \beta _2 \,{\it exper}_{\it it} ^2 + \beta _3 \,{\it exper}_{\it it} ^3 + \beta _4 \,{\it exper}_{it} ^4 + \varepsilon _{it}\end{equation}
where lngrsswkit is the natural logarithm of individual i's gross weekly earnings in period t; β 0 through β 4 are parameters; experit is the individual's years of potential work experience at the beginning of period t; and εit is an error term.
Given parameter estimates  $\hat \beta _0$ through
 $\hat \beta _4$, the estimated percentage change in earnings between years x and x+1 is equal to the difference between the predicted values of lngrsswkx +1 and lngrsswkx, or:
 \begin{equation}
\skew3\hat \beta _1 + \skew3\hat \beta _2 [(x + 1)^2 - x^2 ] + \skew3\hat \beta _3 [(x + 1)^3 - x^3 ] + \skew3\hat \beta _4 [(x + 1)^4 - x^4 ].\end{equation}
We use these rates of change to estimate age–earnings profiles for the twenty-eight to thirty-one-year-olds in our sample. We assume retirement at age sixty-seven, producing a forty-six-year career for graduates and a fifty-year career for non-graduates. We use the age–earnings profiles to calculate the net present value of lifetime earnings, discounted to each individual's initial year of employment using the official UK discount rate of 3.5 per cent (HM Treasury, 2011).Footnote 5
It is important to be clear about the restrictions that apply to our QLFS sample. Income information is only available for individuals defined as ‘employees’ or those participating in government employment and training programs, therefore excluding those who are inactive, unemployed or self-employed. Employees and government scheme participants represent 81.9 per cent of the labour force, according to QLFS weightings. Additionally, only a subset of the QLFS respondents are asked about their income. After restricting attention to individuals aged seventeen to sixty-six we obtain our QLFS wage sample with 14,113 observations. Because our sample is limited to QLFS respondents with income data, inference based on our analysis can only be drawn for the population of employees and government scheme participants, and not for the entire labour force or the general population.Footnote 6
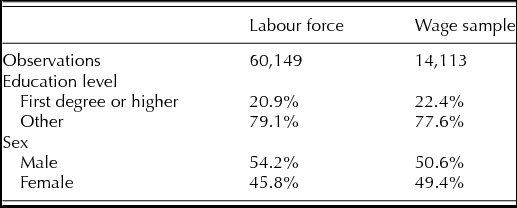
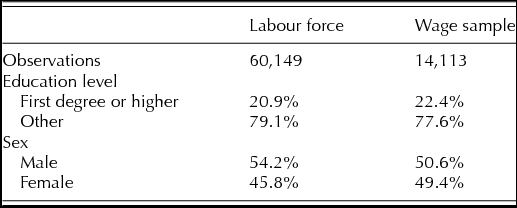
Table 1 compares our wage sample (n = 14,113) to the full labour force sample of individuals aged seventeen to sixty-six (n = 60,149). Owing to the higher unemployment rate among non-university graduates, individuals with less than a first degree are slightly underrepresented in the wage sample: non-graduates make up 79.1 per cent of the labour force sample, but only 77.6 per cent of the wage sample. Within the labour force, women are somewhat more likely than men to be employed and half as likely as men to be self-employed. Accordingly, women are overrepresented in the wage sample (49.4 per cent) compared with the labour force sample (45.8 per cent).
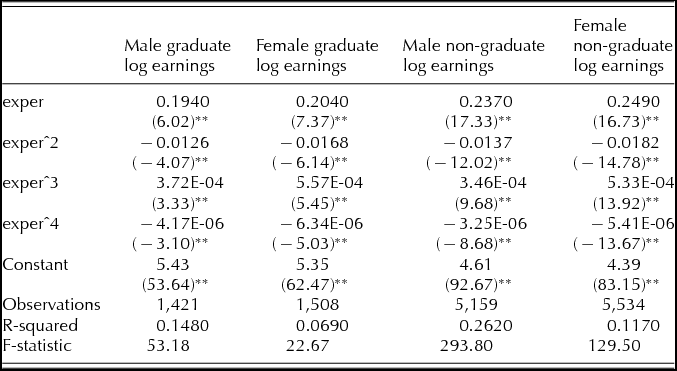
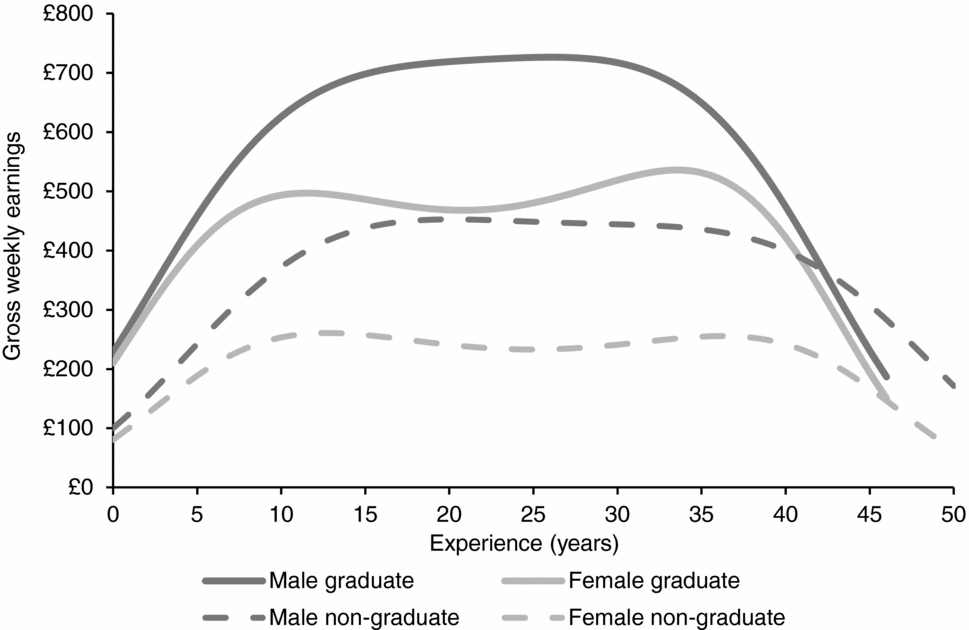
The quartic experience–earnings regression results are presented in Table 2. Conditioning only on gender, a binary indicator for university graduates, and years of potential experience, the regressions explain between 6.9 per cent and 26.2 per cent of the variation in log earnings. The regression coefficients are highly significant for each of the four gender–education sub-samples. Figure 1 presents the earnings profiles implied by the regressions for each sub-sample. The shapes of the earnings profiles are broadly similar to those estimated by Robinson (Reference Robinson2003): both sexes see the most wage growth in the first ten years of their career, while women see a more pronounced flattening-off, or even a decrease in earnings during the middle years of their career, most likely attributable to time taken out of the labour market in their thirties to raise children.
Quartic experience–earnings regression results

Notes: * significant at 5%; ** significant at 1%. Robust t statistics in parentheses.
Source: ONS (2009); authors’ calculations.
Earnings profiles of typical individuals in wage sample, in 2007 £ Source: ONS (2009); authors’ calculations.
Gross higher education subsidies
Full-time undergraduates who were residents of the United Kingdom or the European Union did not have to pay tuition fees at British universities during the 1994/5 to 1997/8 time period. These students’ ‘home rate’ fees were paid in full by the British government. The British government also subsidised the cost of undergraduate education for UK and EU students through funding council grants to British universities, and through maintenance grants and loans to full-time UK undergraduates. After leaving university, loan repayments can be deferred if the borrower is earning less than 85 per cent of the national average in a given year. Otherwise, repayments are made in sixty monthly instalments, and the balance is adjusted for inflation each year. After twenty-five years or at age fifty, whichever comes first, any remaining debt is cancelled.
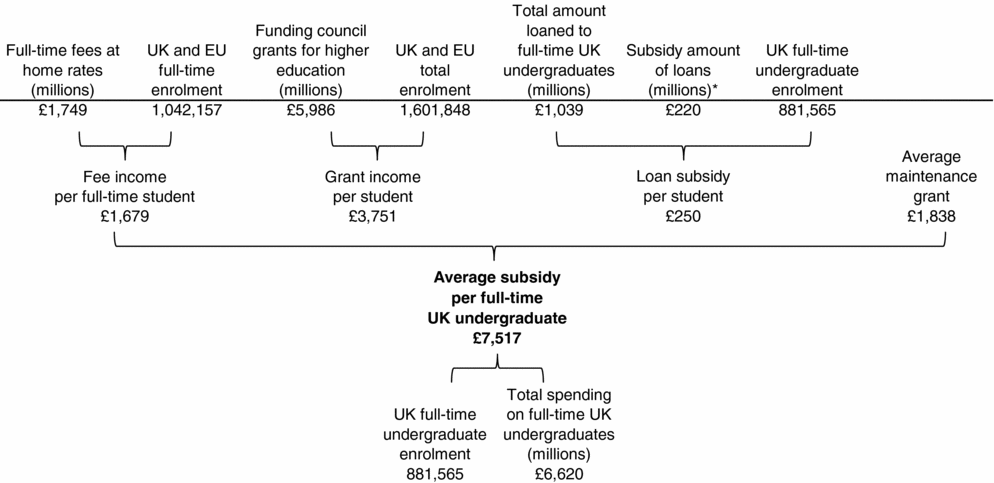
Figure 2 presents the steps that we used to move from gross government spending figures to a per-student subsidy, where each item is averaged across the years 1994/5 to 1997/8. We tallied the relevant sources of funding after adjusting for inflation (all monetary values are converted to 2007 pounds). We then divided the full-time home-rate fee income by enrolment of full-time UK and EU students.Footnote 7 Similarly, we divided universities’ funding council grant income by total enrolment of UK and EU university students. For the purposes of estimating total expenditure on higher education, we assumed a 21 per cent subsidy rate on maintenance loans, based on Barr and Falkingham (Reference Barr and Falkingham1993). We also added the average inflation-adjusted maintenance grant for English and Welsh students.Footnote 8 Since specific data are not available for student support in Northern Ireland and Scotland, the figures for England and Wales are used as a best approximation for all students.
Annual income and enrolment of UK universities, average 1994/5–1997/8, in 2007 £ Note: * Subsidy amount of 21 per cent is based on Barr and Falkingham (Reference Barr and Falkingham1993). Source: HESA (1996a, b, 1997a, b, c, 1998a, b, 1999a, b, 1997c, 2001, 2002); Barr and Falkingham (Reference Barr and Falkingham1993).
Based on these calculations, the average annual subsidy for a full-time student is £7,517, or £7,268 excluding maintenance loan subsidies (which will be calculated for each student separately). However, the QLFS does not specify whether sample members studied full-time or part-time, and to assign a full-time subsidy to every graduate sample member would overstate the value of the higher education subsidy that the cohort received; part-time students received smaller subsidies which we do not attempt to measure here. HESA (1996b, 1997b, 1998b, 1999b) data show that, in the relevant time period, 84.0 per cent of first degree UK undergraduates and 33.6 per cent of other UK undergraduates studied full-time. For lack of better data, we assume that graduate sample members across all income levels are equally likely to have studied full-time. This assumption is likely to bias the results only to the extent that graduates of part-time courses earn more or less than the average full-time graduate.Footnote 9
To compensate for the fact that only a subset of graduates in the sample received a full-time subsidy, we therefore assign 84.0 per cent of the average annual subsidy (£6,108) to each sample member with a first degree or higher, and 33.6 per cent of the average annual subsidy (£2,442) to each sample member with a foundation degree. The average annual maintenance loan is £1,178, and we similarly pro-rate this amount by 84.0 per cent and 33.6 per cent for first degree holders and foundation degree holders, respectively. The subsidy amount of the loan is equal to the total loan amount minus the discounted value of payments, which are projected based on the repayment terms described above.Footnote 10
We assume 3.3 years of study for graduates with a first degree, and 1.9 years for graduates with a foundation degree, based on averages from HESA data from 1994/5 to 1997/8 (HESA 1996b, 1997b, 1998b, 1999b). We assign a £0 subsidy to sample members without an undergraduate degree, although it is probable that some of them attended university without completing a degree.Footnote 11
Lifetime tax liabilities
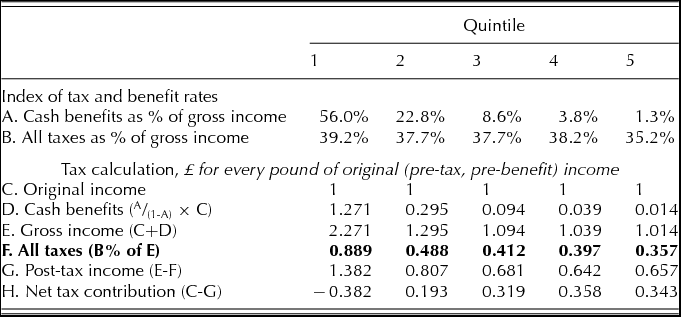
Against the gross higher education subsidy received by each sample member, we compare the lifetime value of taxes paid towards higher education. The first step is to estimate the annual direct (income tax and national insurance contributions) and indirect (VAT, excise duty, etc.) tax liability of individuals across the income distribution. Specifically, we compute different effective tax rates for each of five income quintilesFootnote 12 for the years 1994/5 to 1997/8, using data from the various editions of The Effects of Taxes and Benefits (ONS, 1995, 1997, 1998; Harris, Reference Harris1999).
Table 3 shows a sample calculation of the effective tax rate for 1997/8. Rows A and B are taken from Harris (Reference Harris1999) and represent average cash benefits and total taxes as a percentage of gross income. Here, gross income is the sum of pre-tax or ‘original’ income and cash benefits. Rows C through H are stages in the calculation of taxes paid for every pound of original income. Row D expresses cash benefits as a percentage of original, rather than gross, income. This is derived from the following, where A equals cash benefits as a percentage of gross income:
Sample calculation of taxes in 1997/98
Source: Benefit and tax rates (rows A and B) are from Harris (Reference Harris1999), Tables E and F; authors’ calculations.
A = Benefits / Gross income = Benefits / (Original income + Benefits)
→ Benefits = A × (Original income + Benefits)
→ (1 – A) × Benefits = A × Original income
→ Benefits = [A / (1 – A)] × Original income
Row E is the sum of Rows C and D, and Row F uses the tax rate in Row B to express taxes as a per cent of original income. Row G equals gross income less taxes, while Row H shows the net tax contribution per pound of original income, where a negative number indicates that the average individual receives more in cash benefits than he or she pays in taxes.
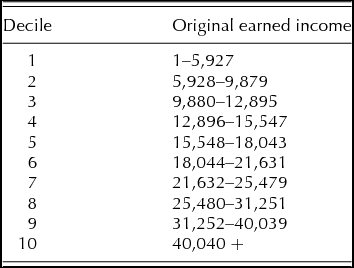
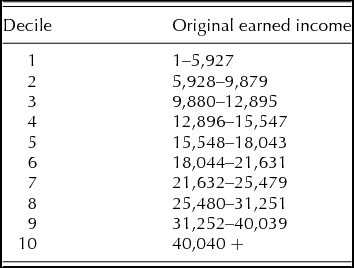
Individuals’ annual earnings (assumed to equal fifty-two times the weekly amount) were assigned to deciles based on the distribution of earnings in the Quarterly Labour Force Survey (see Table 4 for these values). Since the tax rates we computed must be applied to unearned as well as earned income, we add an estimate of unearned income for the appropriate decile to each sample member's income in each year (ONS, 1995, 1997, 1998; Harris, Reference Harris1999).Footnote 13 We then use the average effective tax rate (as in Row F of Table 3) to compute the total value of taxes paid by each sample member in each year of their employment.Footnote 14 This allows us to compute the net present value of each sample member's lifetime tax payments, assuming a constant tax regime.
Next, we assume that the share of each individual's taxes that funds higher education is equal to the annual share of total personal and household tax revenues spent on full-time undergraduate education. For any given year, this share equals total full-time undergraduate expenditure divided by total revenues from the sources of tax accounted for above (the annual values of these revenues are provided in ONS (1995, 1997, 1998) and Harris (Reference Harris1999)). The average value of this fraction across the years 1994/5 to 1997/8 is 2.66 per cent. In other words, the higher education funding system in place during these years required expenditures equal to 2.66 per cent of personal and household tax revenues. We assume this percentage remains constant, and use this value to compute the net present value of each sample member's tax payments towards higher education.
The regressivity of net educational subsidies in the UK, 1994/5–1997/8
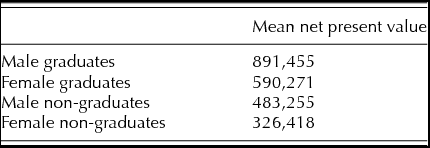
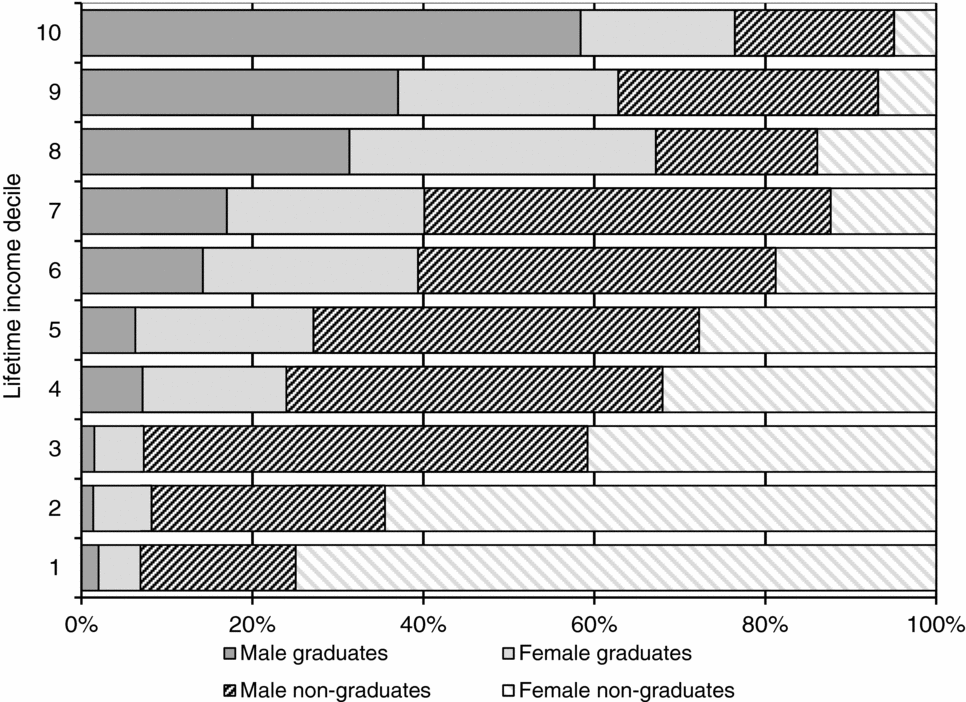
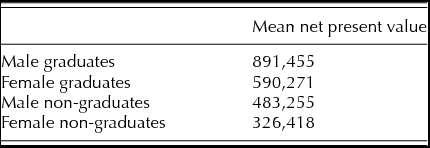
The last step of the analysis is to calculate the net higher education subsidy received by each member of the sample. This is equal to the difference between the gross subsidy received and the net present value of lifetime taxes paid towards higher education. As we describe in this section, we find the distribution of net subsidies to be regressive. Figure 3 shows the strong relationship between income, sex and educational attainment. Graduates, particularly male, dominate the upper lifetime income deciles, while female non-graduates form the bulk of the lowest deciles. Table 5 shows the disparity in average lifetime earnings among these groups. On average, male graduates earn nearly three times as much as female non-graduates over the life cycle.
Projected lifetime income among cohort members, in 2007 £
Source: Authors’ calculations.
Distribution of sex and education level across lifetime income deciles of cohort Source: ONS (2009); authors’ calculations.
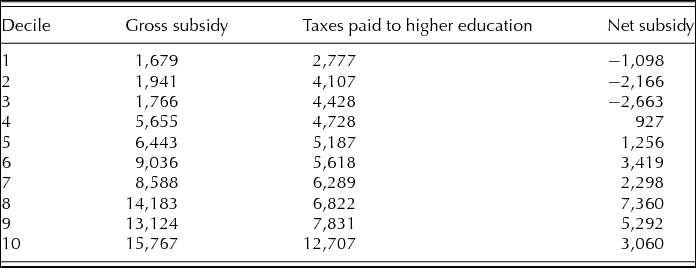
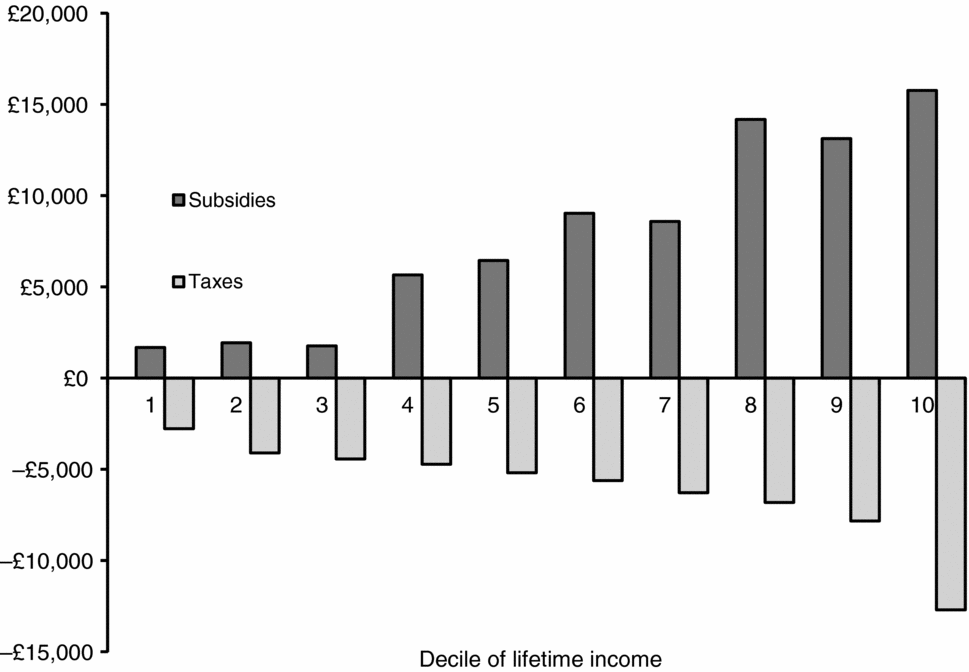
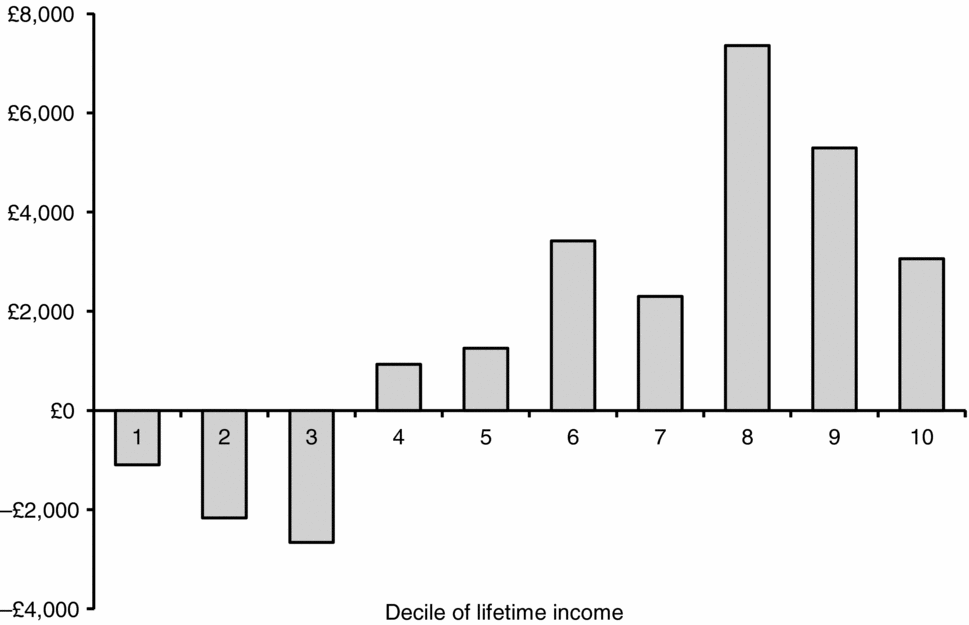
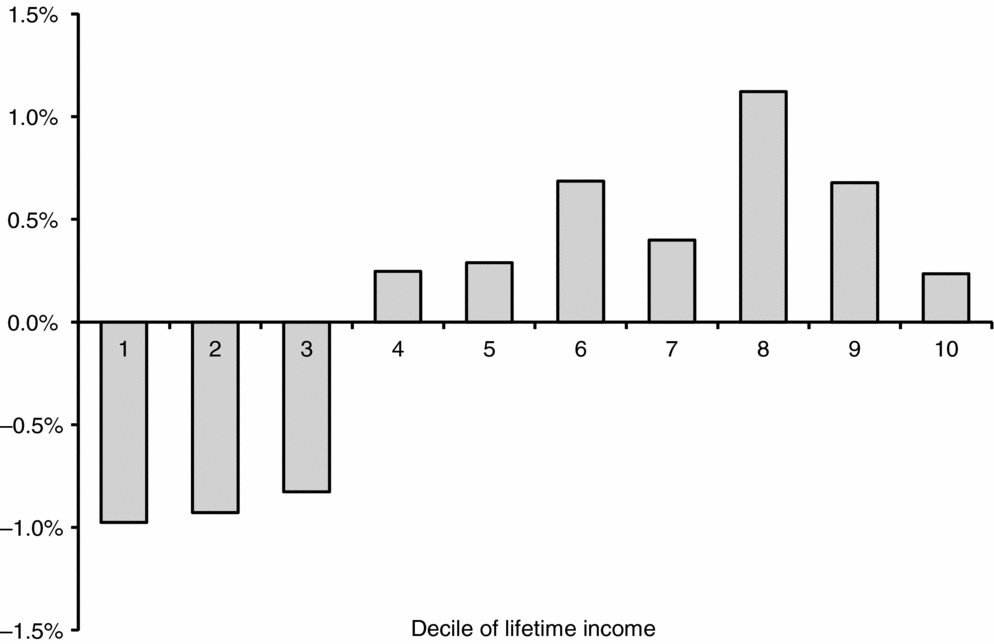
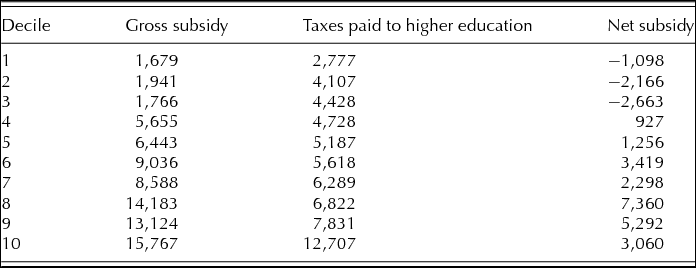
Table 6 and Figure 4 present the average values of gross subsidies and higher education taxes by decile of lifetime income. Unsurprisingly, due to the higher proportion of graduates in the upper-income deciles, gross benefits are roughly increasing in line with increases in income. More significantly, net benefits also follow a broadly regressive pattern: the lowest three income deciles receive negative average net subsidies, while the upper seven deciles are overall net beneficiaries of the higher education subsidy system (Table 6, Figure 5).Footnote 15 The eighth and ninth deciles, especially, dominate, receiving the largest net subsidies in absolute terms.
Average values of subsidies and taxes by decile of lifetime income, in 2007 £
Source: Authors’ calculations.
Average gross subsidies and higher education taxes, in 2007 £ Source: Authors’ calculations.
Average net subsidies, in 2007 £ Source: Authors’ calculations.
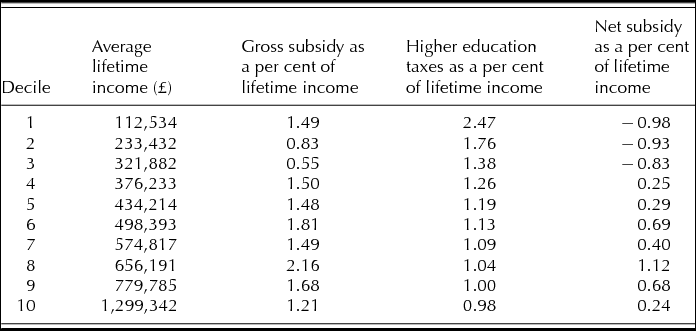
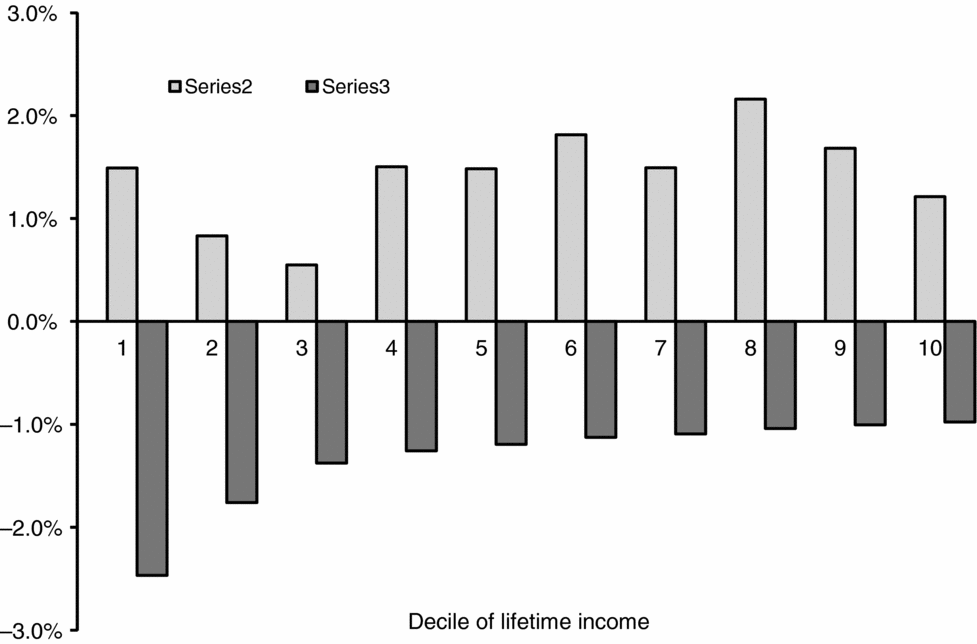
Even when taken as a share of income, gross benefits are still somewhat skewed towards the upper-income deciles (Table 7, Figure 6). Moreover, the negative net subsidies experienced by the lowest 30 per cent of earners represent a particularly severe burden when compared with their income level (Table 7, Figure 7). Taken as a percentage of lifetime income, the distribution of net subsidies becomes strictly regressive in the bottom six deciles. Meanwhile, decile eight receives the greatest net benefits as a percentage of lifetime income, with net benefits on average totalling over 1 per cent of lifetime earnings.
Average values of subsidies and taxes by decile of lifetime income, in 2007 £
Source: Authors’ calculations.
Average gross subsidies and higher education taxes as a per cent of lifetime income Source: Authors’ calculations.
Average net subsidies as a per cent of lifetime income Source: Authors’ calculations.
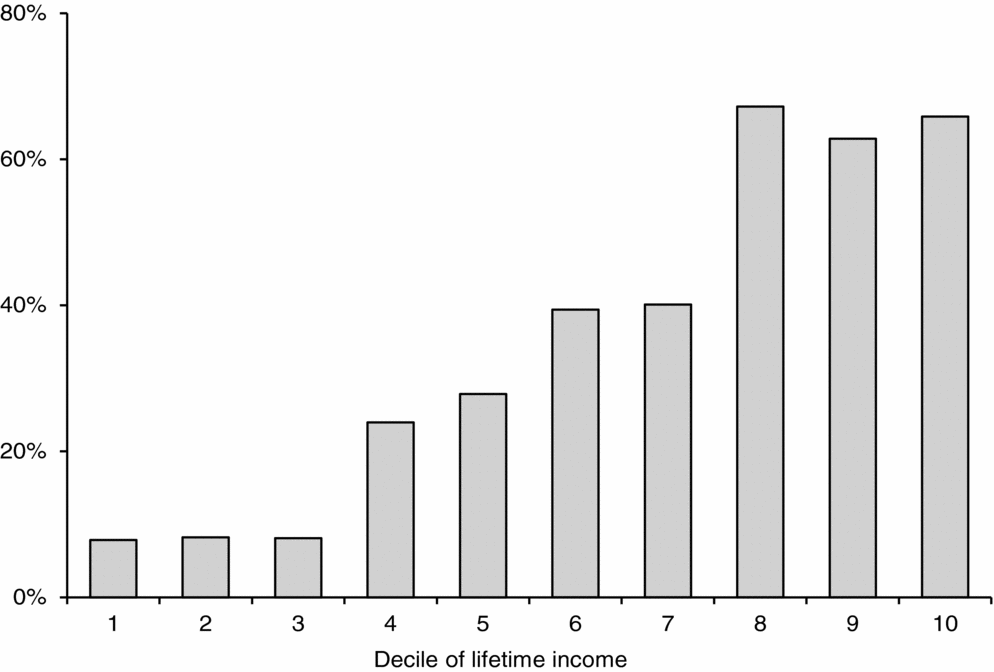
This regressivity is explained by the observation that 97 per cent of sample members with first degrees receive positive net benefits; in other words, the gross subsidy received by graduates is so large that only the highest-earning graduates will pay as much in taxes towards higher education as they received in benefits as students. Accordingly, the pattern of net beneficiaries by decile closely mirrors the proportion of higher education participants in each decile. The income class-serving nature of higher education subsidies is apparent from Figure 8. Over 60 per cent of employees in the top three deciles receive positive net benefits, compared with only around 8 per cent in the lowest three deciles. In this sense, higher education subsidies amount to a regressive transfer of income over the life cycle.
Per cent of cohort receiving positive net subsidies Source: Authors’ calculations.
Discussion and conclusions
Our estimates imply that British higher education subsidies in the mid-1990s had the effect of transferring income not only from non-graduates to graduates, but from low lifetime earners to high lifetime earners. Regardless of the progressivity or regressivity of the tax and benefit system overall, a subsidy scheme that redistributes from low-income to high-income individuals cannot help but render the entire system less progressive than it otherwise would be.
Our calculations will overstate the regressivity of subsidies if a significant proportion of the subsidised university graduates had not attended university without a subsidy. In this case, the subsidies could be significantly increasing the lifetime incomes of subsidised graduates. We make no attempt to estimate the proportion of graduates who would have foregone university without a subsidy, nor are we in a position to estimate lifetime earnings for counterfactual non-graduates in a labour market with markedly fewer university graduates than observed in our sample. Corver (Reference Corver2010) finds no evidence that increasing fees from £0 to £3,000 led to enrolment effects on this extensive margin. While application rates fell in 2012 upon the introduction of maximum annual fees of £9,000, demand from young people returned to near record levels in 2013, with a narrowing gap based on socioeconomic background (UCAS, 2013). Based on US data, Cameron and Heckman (Reference Cameron and Heckman2001) find only small family income effects on college enrolment, after conditioning on the ability of the student.
Our calculations will also overstate the regressivity of subsidies if higher education generates significant positive externalities. Table 5 suggests that university graduates receive large private benefits, presumably related to their higher productivity. Externalities exist if, for example, some innovations by graduates confer productivity gains on others who then also enjoy higher earnings because of the graduates’ subsidised education. Estimating the size of such external benefits is beyond the scope of our paper, but such external benefits would have to be very large to overturn our finding of regressivity.
Since 1999, higher education policy has diverged across England, Wales, Scotland and Northern Ireland. The reforms made in England, in particular, have had the effect of increasing progressivity among graduates, although their impact on non-graduates is less clear. The introduction of fees in 1998 shifted some of the funding burden onto students rather than taxpayers, and a new system of income-contingent maintenance loan repayments reduced interest subsidies among high-earning graduates. In 2004, the principle of graduate (as opposed to parental) contributions to fees was institutionalised via the introduction of income-contingent fee loans, in conjunction with an increase in fees from £1,000 to a maximum of £3,000 per year. Meanwhile, more generous loan repayment terms reduced the relative burden on low-earning graduates. Dearden et al. (Reference Dearden, Fitzsimons, Goodman and Kaplan2008) estimate that these reforms, combined with an increase in the value of maintenance funding, required an additional £1.1 billion in taxpayer contributions, with universities experiencing greater funding and the net effect on students and graduates only slightly negative. The net effect of these reforms outside the graduate population would be progressive only if the increase in net benefits to graduates in low-income deciles exceeded the additional tax contribution of those deciles.
England's 2012 reforms take further steps towards progressivity among graduates, while also attempting to rein in public spending. For example, the interest-rate subsidy on fee loans has been eliminated for high-income graduates, the loan repayment threshold has been increased, and fee increases will bring in more revenue from the highest earners while low lifetime earners are shielded by the write-off provision (now set at thirty years instead of twenty-five). Since the reforms increase progressivity among graduates, the overall effect would be to increase progressivity generally if the reforms also reduced taxpayer expenditure, as intended. Chowdry et al. (Reference Chowdry, Dearden, Goodman and Jin2012) estimate that these reforms will lead to a reduction in taxpayer funding of £2,480 per graduate, or 12 per cent. However, Thompson and Bekhradnia (Reference Thompson and Bekhradnia2012) illustrate some scenarios in which the reforms would be cost-neutral or even increase expenditure; the result hinges on the trajectory of graduate earnings and the final subsidy rate on student loans.
Ultimately, the choice of an appropriate level of government subsidisation for higher education is a normative question, which we do not try to definitively answer. We focus on the positive and relatively narrow question of how the direct net benefits of subsidies in the mid-1990s were distributed across lifetime income deciles. The system of subsidies we examine here was very generous, but also very regressive by our measure. While the reforms since 1998 were precipitated by serious funding challenges, these changes also have important equity ramifications which are not widely understood. Our analysis does not settle the difficult normative question of whether the reforms improve social welfare, but we hope it does inform the public debate by calling attention to the often overlooked distributional consequences of pre-reform subsidies.
Acknowledgement
The authors thank Tom Downes, Dan Richards, and Ken Mayhew for their comments.