I. INTRODUCTION
The great interest of scientists toward carbon is caused, first of all, by the existence of diversity of its various structural forms, attractive electronic and physical properties. Besides the known carbon crystal structures of graphite, diamond and lonsdaleite, over the last 30 years, the new forms of existence of carbon structures such as nanotubes, fullerenes, graphene and graphane were discovered. Reference Setton, Bernier and Lefrant1–Reference Novoselov, Jiang, Schedin, Booth, Khotkevich, Morozov and Geim4 The electrical, optical and physical properties of atomic carbon structures depend not only on sp 1, sp 2 and sp 3 hybridization of carbon bonds, but also on the forms of organization of carbon atoms. Reference Novoselov, Geim, Morozov, Jiang, Katsnelson, Grigorieva, Dubonos and Firsov5,Reference Katsnelson6 The essential difference only by the one parameter, such as conductivity, enables wide application of the obtained new carbon structures in the creation of various devices and new composite materials. Reference Bhattacharyya and Silva7,Reference Morozov, Novoselov and Geim8
The interest of no small importance is attracted by such structures as amorphous carbon (a-C), tetragonal amorphous carbon (ta-C) and others. Reference Wang, Zhu, Wang, Yin and Han9–Reference Merkulov, Lannin, Munro, Asher, Veerasamy and Milne15 Production of various forms and molecular structures of carbon depends on the conditions and methods of their synthesis. Structural modification of carbon films is defined by different ratios of sp 1, sp 2 and sp 3 hybridized bonding. Increase of the local concentration of sp 3 or sp 2 hybridized bonds per unit of volume can lead to the formation of nanoclusters in the form of graphite, tetragonal and diamond inclusions in the a-C matrix. sp 2 hybridization of carbon atoms is formed by three σ bonds with the formation of free π electron, while sp 3 hybridization is formed by four σ bound electrons. The distribution of density of allowed electronic states, formed by σ- and π-bonds, will determine the value of energy gap. Reference Robertson16
There are various determination methods of sp n bond hybridization, such as nuclear magnetic resonance, electron energy loss spectroscopy (EELS), x-ray photoelectron spectroscopy, Reference Casiraghi, Ferrari and Robertson12,Reference Babaev, Sultanov, Abdulvagabov and Terukov14,Reference Robertson16,Reference Paik17 but these are time-consuming and destructive methods. Therefore, more and more researchers pay attention to the method of Raman spectroscopy. Raman spectroscopy method with laser excitation in the visible region does not lead to destruction of the structure; it is considered as an important tool in the evaluation of sp 3 sites, and it also gives the opportunity to explore and identify the molecular structure of the synthesized film. Reference Casiraghi, Ferrari and Robertson12,Reference Babaev, Sultanov, Abdulvagabov and Terukov14–Reference Ferrari and Robertson19
Method of magnetron ion-plasma sputtering is widely used in industry for the synthesis of thin films. This method is useful in the production of modified structures with impurities or nanoclusters of different chemical natures. There is a wide class of noncarbide-forming chemicals, properties of which make possible to create thin carbon films modified by nanoparticles. Reference Sarsembinov, Prikhodko, Ryaguzov, Maksimova, Daineko and Mahmoud20 The properties of the nanoparticles will strongly depend on the structure and dielectric conductivity of carbon matrix.
The purpose of this article was to show the possibility of production of noncrystalline carbon films with high sp 3 content using plasma sputtering of graphite. On the basis of performed studies of the structural and optical properties of the films and by comparison that results with the already accumulated knowledge in the world, we have shown that carbon films synthesized by graphite sputtering can contain up to 70% of sp 3 sites or more. Besides, significant dependence of structure and optical properties of the carbon films on the synthesis conditions is shown.
II. EXPERIMENT
In the work, the method of magnetron sputtering of graphite target in an argon atmosphere at direct current was used. Purity of graphite target was 99.999%. Noncrystalline carbon films were synthesized both on quartz- and silicon (100)-polished substrates in a single process and in a wide range of temperatures from 50 to 250 °C (T sub) at a constant power density of the ion-plasma discharge 2.2 W/cm2. With the average rate of film growth ≈0.2 Å/s and synthesis time 1 h, the film thickness was about 70 nm. The molecular structure of carbon films was studied by the method of Raman spectroscopy using confocal Raman spectrometer NTegra Spectra (NT-MDT, Zelenograd, Russia). Vibrational spectra were excited by helium–neon laser with a wave length of 633 nm (1.96 eV) and by diode-pumped solid-state laser Cobolt Blues with a wave length of 473 nm (2.62 eV). Laser power in both cases was ∼20 mW and after passing a system of lenses and filters in contact with the sample, it was ∼2 mW. Spectral resolution of the Raman spectrometer with diffraction grating 600/600 is about 4 cm−1.
Recently, for the detection of diamond-like carbon films, the UV Raman spectroscopy is widely used. Reference Merkulov, Lannin, Munro, Asher, Veerasamy and Milne15,Reference Ferrari and Robertson18,Reference Huang, Sun, Lu and Hong21,Reference Wagner, Ramsteiner, Wild and Koidl22 However, the UV radiation has energy more than 3.5 eV, which can result in a damage of the structure. Therefore, when using UV radiation, it is necessary to apply additional rotation of samples to reduce the exposure time of the exciting radiation on the structure of the carbon films. We have conducted the study to reveal possible photostructural transformations of a-C films under the laser radiation with energy of 2.62 eV without sample rotation. Exposure time of laser radiation varied from 1 to 200 s. There was no change in the form and position of Raman peaks, indicating sufficiently stable molecular structure of the synthesized carbon films. We have performed visible Raman spectroscopy study in the wave number range from 1000 to 2000 cm−1 and exposure time of 100 s.
In addition, the study of light reflection and transmission in the a-C films was conducted using a spectrophotometer UV3600 (Shimadzu Corp., Kyoto, Japan) in the range from 280 to 800 nm. The accuracy of wave length positioning for this spectrophotometer is 0.1 nm. The values of optical band gap (E g) were calculated by standard method. The error of energy band gap estimation is about 0.01 eV.
It should be noted that Savvides and Bell Reference Savvides and Bell23 synthesized a-C:H films using the unbalanced magnetron DC sputtering technique with the graphite target in an Ar/H2 mixture. The band gap of the synthesized films ranged from 1.2 to 1.6 eV. The authors Reference Savvides and Bell23 found a correlation between the energy of condensed carbon atoms and the ratio of sp 3/sp 2 sites, microhardness and values of energy band gap. For these reasons, Savvides and Bell concluded that the diamond-like properties of the films strongly depend on the energy of condensed atoms.
In this work, we perform balanced magnetron ion-plasma sputtering of a graphite target in an Ar atmosphere at a constant power density of the plasma discharge. Round magnetron with a ring magnet was used. The angle, at which the carbon atoms were condensing on the substrate, was about 50–60°. Investigation of the effect of synthesis temperature and atomic structure of the substrate on the structure and optical properties of carbon films was performed. All measurements were done on freshly prepared (as-deposited) samples.
III. RESULTS AND DISCUSSIONS
Raman spectroscopy is now becoming the most important tool to study the local molecular structure of synthesized films and is considered as an indicator containing a “fingerprint” which reliably predicts several key film properties: hydrogenation, optical gap, density, and hardness. Reference Tamor and Vassell24
According to Refs. Reference Robertson16, Reference Ferrari and Robertson18, Reference Ferrari and Robertson19, and Reference Huang, Sun, Lu and Hong21, Raman spectra of carbon films with disordered structure show two sharp maxima, which are designated as D peak (disordered) and G peak (graphitic peak), and which can take on the values of the wave number 1350–1380 and 1575–1600 cm−1, respectively. In perfect graphite, the G peak is at 1581 cm−1 independent of the excitation energy. The appearance of the G peak is due to the zone-center mode of E 2g symmetry of the stretching vibrations of hexagonal carbon rings. Reference Robertson16 At the same time, the presence of G peak in the Raman spectra of carbon films with disordered structure can be associated with the modes of in-plane bond-stretching motion of pairs of C–C sp 2 atoms. The absence of hexagonal rings does not exclude the existence of pairs of C–C sp 2 atoms. Therefore, the variation of the G peak is ranging from 1500 to 1630 cm−1 in the disordered carbon structures. Reference Ferrari and Robertson19
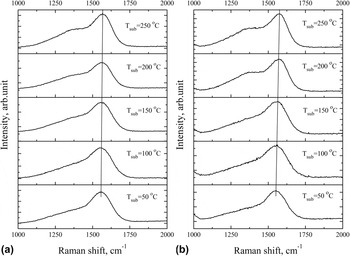
Figure 1 shows the Raman spectra (excited by 473 nm laser) of carbon films prepared at different synthesis temperatures (T sub) on quartz (a) and silicon (b) substrates. It can be seen that all the spectra are characterized by a major peak at 1565 ± 15 cm−1, which is denoted as G peak, and a shoulder elongated toward the lower wave numbers. The figure shows that the shape of the spectrum is a function of substrate temperature. The G peak position shifts toward high frequencies as the synthesis temperature increases. When the synthesis temperature is less than 200 °C, Raman shift of G peak becomes less than 1565 cm−1, and therefore one can think about the main contribution of in-plane molecular vibrations of pairs of C–C sp 2 atoms. Reference Tuinstra and Koening25,Reference Windl, Pavone, Karch, Shutt, Strauch, Giannozzi and Baroni26 Shift of G peak to 1581 cm−1 determines the increase of 6-fold rings in the structure and formation of nanostructured graphite particles in the amorphous matrix. Reference Robertson16 At the same time, it should be noted that at the synthesis temperature of less than 100 °C, the G peak has relatively symmetric line-shape. The maximum sp 3 content corresponds to the most symmetric G peak. Reference Prawer, Nugent, Lifshits, Lempert, Grossman, Kulik, Avigal and Kalish27
Raman spectra of carbon films prepared at different substrate temperatures: (a) a quartz substrate; (b) a silicon substrate.

Elongated shoulder in a wide range of wave number variations can describe several vibrational modes, one of which characterizes the degree of disorder in the structure, and is denoted as D peak. It is known Reference Ferrari and Robertson18 that in polymeric carbon structures with defined concentration of hydrogen depending on the synthesis conditions, the D peak is most pronounced and can exceed the G peak by intensity. This behavior may indicate a specific organization of the atomic structure of hydrogenated carbon films. The authors Reference Robertson16,Reference Ferrari and Robertson18,Reference Ferrari and Robertson19,Reference Huang, Sun, Lu and Hong21 associate the appearance of D peak with breathing mode of hexagonal rings, not with the oscillatory processes in chains of sp 2 sites. Thus, if there are no rings, then the D peak will not appear. Reference Ferrari and Robertson28 It is worth noting that, with increasing temperature T sub, the shoulder in the area of low wave numbers increases in intensity, and at a temperature of T sub = 250 °C acquires step shape with a width of about 100 cm−1 on quartz (a) and silicon (b) substrates. Since the increase of the shoulder can be due to the increase in the number of weakly bound rings, the increase of D peak in amorphous films indicates the emergence of a certain order of the structure. The emergence of structural order is confirmed by changes of the width of G peak. According to Ref. Reference Schwan, Ulrich, Batori, Ehrhardt and Silva29, if the full width at half maximum (FWHM) of G peak is about or less than 50 cm−1, then the size of the crystal particles is from 10 nm to 1 μm. In case of our results, the FWHM of G peak is not more than ∼120–140 cm−1, i.e., particle sizes with an ordered structure can be about 1 nm or less. As Robertson Reference Robertson16 noted, the important factor of films' diamond-likeness is the particle size L a, which must be less than 1 nm.
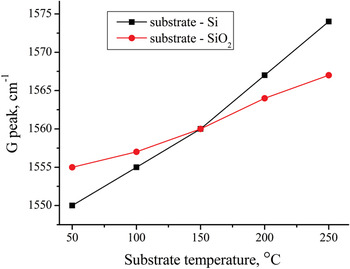
Dependence of G peak position on the synthesis temperature is shown in Fig. 2. The position of G peak strongly depends on the synthesis temperature and the substrate material. Effect of crystalline silicon surface on the self-organization of the carbon atoms and formation of the film structure causes the shift of G peak by 25 cm−1 comparing with the shift in case of films grown on the surface of the quartz substrate, which is equal 13 cm−1. Besides that, it is obvious that at the synthesis temperature of 150 °C, the position of G peak takes the value of 1560 cm−1 in both films deposited on silicon and quartz substrates. It means that these are such conditions, under which there is no effect of the substrate during the film formation.
Dependence of the G peak position on the synthesis temperature of diamond-like carbon (DLC) films on Si and quartz substrates.

The transition from graphite-like carbon (GLC) atomic structure to amorphous tetragonal (ta-C) structure is shown in a three-stage model of carbon films proposed by Ferrari and Robertson. Reference Ferrari and Robertson18,Reference Ferrari and Robertson19 According to this model, in the final stage of structure formation, G peak takes values in a wide range of wave number ∼1500–1600 cm−1 depending on the excitation energy. For given values of G peak, the fraction of sp 3 C–C bonds can reach ∼85%. At the same time, the shift of G peak to the large values of the wave numbers at a given excitation energy in the visible region indicates the decrease of sp 3 C–C bonding content and increase of the number of sp 2 sites. Reference Ferrari and Robertson19
It is known Reference Gilkes, Sands, Batchelder, Robertson and Milne13,Reference Ferrari and Robertson18,Reference Ferrari and Robertson19,Reference Ferrari and Robertson28,Reference Ferrari and Robertson30 that in visible Raman spectra, the cross section of the sp 2 phase is much higher (50–250 times for 514.5 nm) than that of the sp 3 phase. Therefore, all the Raman spectra obtained with excitation in the visible region characterize the certain states of sp 2 C–C sites and their phonon interaction with the surrounding atomic structure. Such spectra are also observed for ta-C structures, because the sp 2 content in this case is normally around ∼20%. Reference Gilkes, Sands, Batchelder, Robertson and Milne13
Huang et al. Reference Huang, Sun, Lu and Hong21 synthesized carbon films on silicon substrates in a wide temperature range using the method of pulsed laser deposition. They associate shift of G peak position with a resonant feature of π–π* transitions in sp 2 site and claim that small changes in the strength of the π bonds may lead to a substantial changes in G peak position.
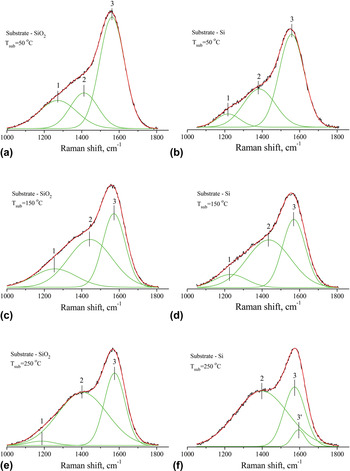
For a more detailed analysis and understanding of the effect of synthesis temperature T sub and the substrate material on the self-organization of the atomic structure of carbon films and the identification of its features, we have performed the decomposition of Raman spectra into constituent peaks of Gaussian distribution. Figure 3 shows the Raman spectra with an estimate of the Gauss decomposition for the three different temperatures of synthesis T sub. During the decomposition of the experimental peak, we followed the principle of setting a minimum number of peak components of decomposed spectrum, the resultant of which approximate the experimental curve with the highest reliability (≥0.999).
Raman spectra of carbon films synthesized on SiO2 and Si at different temperatures of synthesis using the Gauss decomposition method. (a) SiO2 substrate Tsub=50°C, (b) Si substrate Tsub=50°C, (c) SiO2 substrate Tsub=150°C, (d) Si substrate Tsub=150°C, (e) SiO2 substrate Tsub=250°C, (f) Si substrate Tsub=250°C.

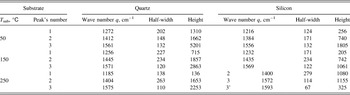
Before the spectral decomposition, we carried out subtraction of background line. The experimental curves of the Raman spectra are shown by a black line, the peaks of Gaussian distribution are shown by a green, and approximating curves of decomposition are shown by a red. Figure 3 shows that all Raman spectra are decomposed into three peaks. The peaks are labeled as 1, 2, and 3. More detailed characteristic values of the Gaussian distribution are shown in the Table I. The peak 3 can be attributed to the G peak, according to the q values ranging from 1500 to 1600 cm−1. The peak 2 can be associated with D peak. In ideal graphite, the D band is absent and rises under emergence of structural disorder and a breathing mode of A 1g symmetry involving phonons near the K zone boundary. Reference Robertson16,Reference Ferrari and Robertson18,Reference Ferrari and Robertson19,Reference Huang, Sun, Lu and Hong21 Position of peak 2 is shifted toward the high-frequency region with respect to the assumed q values of D band, which may indicate some additional harmonics of sp 2 bonds occurring at the interface between the matrix and similar crystal structures “grain” consisting of sp 2 or sp 3 sites. Position of peak 1 takes the values of the wave number for vibrational density of states (VDOS) of diamond in the region around 1260 cm−1. Reference Tamor and Vassell24 Thus, quite strongly elongated shoulder in the low-frequency region is described by the two peaks of Gaussian decomposition, which are responsible both for the appearance of the vibrational modes of sp 2 bonds and for the phonon modes of sp 3 sites. Ferrari and Robertson Reference Ferrari and Robertson30 noted that the grains of the diamond-like structure with the size of 1 nm or less contribute to VDOS maximum which is near 1260 cm−1. In addition, phonons in small grains could be softer than that in bulk diamond, Reference Ferrari and Robertson30 i.e., the frequency spectrum of the phonon modes must shift to lower frequencies from the main peak of diamond 1332 cm−1.
The values of the wave number q (cm−1), the half-width and height of Gaussian peaks corresponding to the three synthesis temperatures T sub (°C) of the carbon films on quartz and silicon substrate.

According to Tuinstra and Koenig (TK), Reference Tuinstra and Koening25 it is possible to assess the size of structured nanoparticles embedded in the carbon matrix using the intensity ratio of the peaks. When considering the ratio I(2)/I(3), it can be assumed that the films are structured by the graphite nanoparticles, sizes of which vary from 7 to 12 Å, depending on the synthesis conditions. Size assessment of the diamond nanoparticles can be carried out by the ratio of I(1)/I(3), which also depends on the synthesis conditions. At the synthesis temperature T sub = 50 °C, the size of nanostructures with sp 3 sites is ∼6 and ∼5 Å in the films on quartz and silicon substrates, respectively. As it is seen from Figs. 3(a) and 3(b), peak 1 in case of quartz substrate is higher and it can indicate only the greater content of structures with sp 3 C–C bonds in the amorphous matrix. In case of synthesis on quartz substrate at T sub = 250 °C, the size of structures with sp 3 site was ∼3 Å, in case of the carbon films on silicon substrates, this assessment is impossible due to the lack of peak 1.
Having assessed the particle size of sp 2 and sp 3 sites, which make up the structure of the carbon film, it is possible to explain why the main G peak shifts to the lower frequencies. According to Ferrari and Robertson, Reference Ferrari and Robertson28 the decrease of graphite particles' size caused by the increase of topological disorder leads to the weakening of C–C bonds in sp 2 sites at the phase boundaries, which does cause the shift toward low frequencies. Increasing disorder causes the increase of structural stress which leads to transition sp 2 site → sp 3 site. Therefore, we observe an increase of peak 1 with decreasing synthesis temperature. Thus, we can conclude that there is a fairly complex interweaving of zones with sp 3 and sp 2 structural units.
In films we have synthesized, these structural units can be composed of 2–4 molecular compounds or crystal-like face-centered cells in one of the directions. At a synthesis temperature of 50 °C, conditions for the sp 3 sites formation are the most profitable, but as the temperature increases to 250° C, thermal energy of synthesis promotes the formation of sp 2 sites, so their sizes are much larger than that of sp 3 sites. In addition one can see significant influence of substrate on the structure formation. Absence of more large crystal-like formations in the synthesized carbon film indicates more uniform distribution of density and atomic structure by volume. Formation of such a structure can be caused by a nonequilibrium method of film synthesis which includes ion-plasma magnetron sputtering.
As seen from the decomposition of the normal distribution, there is a definite correlation between the change of peaks' height ratio and synthesis temperature. It is worth to note the significant increase of height and half-width of peak 2 with the increase of the synthesis temperature and decrease of peaks 1 and 3. In case of the film on silicon substrate, the peak 1 at T sub = 250 °C completely disappears [Fig. 3(f)] and peak 3' appears, which is likely due to the increase of peak 2. Such changes of distribution in Fig. 3(f) can be associated with the formation of nanocrystalline graphite of about 12 Å during the synthesis of carbon films.
As seen from Table I, the wave number of peak 2 or D peak takes values over a wide range from 1384 to 1445 cm−1. These values are greater than that in defective graphite (1350 cm−1). This may be due to the origin of the D peak according to the selection rule k = 0.5q. Reference Ferrari and Robertson18 Where k is the wave vector of the photon. As noted in Ref. Reference Ferrari and Robertson18, the symmetric breathing modes have the highest modulation of the polarizability and thus the highest Raman cross section. Such breathing modes can occur also at the interface of two phases—matrix with disordered structure and crystal-like nanoparticles. At the moment, there is no more rigorous explanation of the D peak appearance. Reference Ferrari and Robertson18
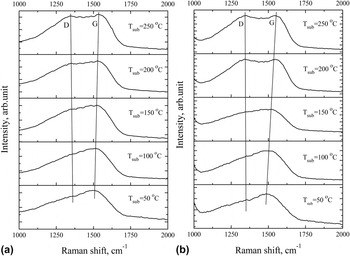
Additional information about the structure using method of visible Raman spectroscopy can be obtained by applying the excitation with energy approximately equal to the energy gap in the local sp 2 C sites, and which is about 2 eV. Reference Babaev, Sultanov, Abdulvagabov and Terukov14 Figure 4 shows the Raman spectra for excitation at 633 nm (1.96 eV). In case of films synthesized at 250 °C, one can observe the emergence of one broad band with two maxima. The half-width of this Raman band is ∼450 cm−1 that indicates a fairly ambiguous inner content. We can assume that they are described by not only the two main oscillatory processes, bond stretching of C6 rings and chains, but also by additional vibrational modes. The rise of these modes can be due to the certain structural units of sp 2 sites, as a result of resonant Raman scattering. Therefore, usage of numerical method of decomposition (by Gauss) can provide a number of different variants of normal distribution, which could describe the experimental curve.
Raman spectra of amorphous DLC films prepared at different temperatures on substrates: (a) quartz; (b) silicon.

In the temperature range from 50 to 150 °C, phonon spectra are characterized by one maximum at 1500 cm−1 (G peak) and elongated gentle slope in the low-frequency region. Obviously, the pronounced D peak is absent. Therefore, we can definitely state that in the disordered structure of the carbon films, synthesized at temperatures less than 100 °C, the concentration of structural units and particles of 6-fold rings is low. This is determined by the low intensity of a breathing mode of A 1g symmetry involving phonons near the K zone boundary. This can also be indicated by the shift of G peak toward the low frequencies by about 80 cm−1. In addition, the shift of G peak may be due to the additional deformation of 6-fold rings caused by internal stresses during the formation of disordered structure. Reference Gilkes, Sands, Batchelder, Robertson and Milne13,Reference Robertson16,Reference Ferrari and Robertson19 And as it was noted above, such deformation of 6-fold rings can cause a transition from sp 2 states to sp 3 site, an increase of which may lead to the formation of “soft” diamond-like nanocluster structures and the emergence of the Raman active modes VDOS in the region of 1260 cm−1. With increasing synthesis temperature above 100 °C, we observe the appearance of D peak and shift of G peak toward high-frequency region of the Raman spectrum. Such behavior of the Raman spectrum characterizes the formation of GLC clusters or chains made of rings.
Peak D (Fig. 4), regardless of the substrate material, slightly changes its position toward the decrease of phonon frequency with increasing intensity at increasing T sub. At the same time, there is a large shift of the G peak toward increasing wave number. The shift of G peak position in the carbon films synthesized on quartz is ∼30 cm−1 and on silicon is ∼67 cm−1. The ratio of these shifts is more than 2 with increase of synthesis temperature by 200 °C. This proves once again a significant dependence of the G peak position on the structure of the carbon films, which is determined by the synthesis conditions and the substrate material. Shift of G peak position occurs only in the disordered carbon, Reference Ferrari and Robertson18,Reference Ferrari and Robertson19 because it contains molecular configurations with different local band gaps and different phonon densities of states. Use of an excitation laser with energy of 1.96 eV (633 nm) leads to Resonant Raman scattering by sp 2 C sites with local band gap of about 2 eV. Reference Merkulov, Lannin, Munro, Asher, Veerasamy and Milne15 One should pay attention to the fact that when the excitation energy is of the order of a local energy gap in sp 2 sites, we observe the largest shift of G peak, more than 2 times than that in case of excitation at 473 nm. Thus, this confirms the effect of resonance-enhanced Raman scattering by phonons with sp 2 bonds of breathing mode, stretching and other concomitant modes of sp 2, clusters and chains.
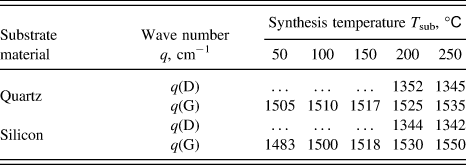
Positions of maxima of experimental Raman curves are shown in Table II. As seen from Table II, changes of the G peak position upon excitation at 633 nm on quartz and silicon substrates correlate with the changes obtained at 473 nm excitation. In addition, it is seen that G peak position at temperatures T sub of 50 and 100 °C takes a value near ∼1500 cm−1, such carbon films may contain up to 85% of sp 3 hybridized bonds. Reference Ferrari and Robertson18 Such a large percentage of sp 3 C–C bonds should lead to the formation of diamond-like particles of ∼6–10 Å or larger in disordered carbon matrix.
Values of wave numbers (q, cm−1) of D and G peaks at various synthesis temperatures (T sub, °C) of carbon films on quartz and silicon substrates.

Photon energy of ∼2.62 eV is not enough to excite resonance phonon vibrations of sp 3 bonds, as the local energy gap in sp 3 C–C site is ∼5.5 eV. Reference Gilkes, Sands, Batchelder, Robertson and Milne13,Reference Merkulov, Lannin, Munro, Asher, Veerasamy and Milne15 If you use a laser with an excitation energy equal to the energy gap of the local sp 3 C–C bond, in the region of 1060–1100 cm−1, T peak arises, which is caused by the resonant excitation of phonons of sp 3 bonds, Reference Robertson16,Reference Ferrari and Robertson18 and D peak corresponding to breathing mode of sp 2 bonds will be suppressed. A similar effect is given in Ref. Reference Wagner, Ramsteiner, Wild and Koidl22 for a-C:H films, and it does not depend on the method of preparation and the thickness of films, and, as the authors argue, it is due to the resonance effect of excitation of phonon vibrations dependent on the energy of the incident photons.
We have shown above that the appearance of characteristic elongated low-frequency shoulder in the Raman spectrum (under the excitation by energy of 2.62 eV) is determined not only by phonon modes of sp 2 sites but also by the VDOS spectrum associated with soft sp 3 sites of diamond-like structures.
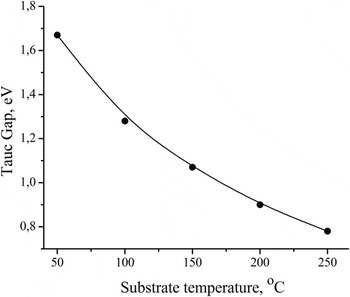
Depending on the percentage ratio of sp 2 and sp 3 bonds in the carbon matrix, the distribution of the density of states of σ and π electrons and thus the optical band gap (Tauc gap, E g) will vary. Reference Tauc31 Band gap is a structurally sensitive parameter, by the value of which it is possible to assess the fraction of sp 2 sites in the carbon film structure. The calculation of the optical band gap is made by the standard procedure. Values of E g as a function of substrate temperature are shown in Fig. 5.
Dependence of the optical band gap on the synthesis temperature of carbon films.

Dependence of the absorption coefficient (α) on the wave length of light in the range α ∼ 104–105 (cm−1) in synthesized carbon films obeys the quadratic law (αhν)1/2 = B(hν − E g) for allowed direct band transitions, Reference Tauc31 where hν is the photon energy and B is an empirical constant. Figure 5 shows that the value of the band gap decreases from 1.67 to 0.78 eV with increasing synthesis temperature. The decrease of the band gap by 0.89 eV for the direct band transitions can be explained by an increase of sp 2 hybridized C–C bonds and the formation of π* unbound electrons forming the bottom of the conduction band. Reference Robertson16
Chhowalla et al. Reference Chhowalla, Robertson, Chen, Silva, Davis, Amaratunga and Milne32 using the method of filtered cathodic vacuum arc (FCVA) for the synthesis of ta-C films in the wide substrate temperature range (from −100 to 450 °C) studied their structure and Tauc gap. They showed that at synthesis temperatures from −100 to 200 °C, the fraction of sp 3 sites is ∼85%. The authors Reference Chhowalla, Robertson, Chen, Silva, Davis, Amaratunga and Milne32 determined the bonding in ta-C by EELS. The optical band gap in the range of T sub being studied was varying from 2.0 to 0.8 eV when the energy of carbon ions during the synthesis was 130 eV. At a substrate temperature of 50 °C, Tauc gap was ∼1.8 eV. Comparing our results with the results of Chhowalla et al., Reference Chhowalla, Robertson, Chen, Silva, Davis, Amaratunga and Milne32 it can be concluded that the Tauc gap of the films synthesized by ion-plasma sputtering method strongly depends on the temperature of the substrate rather than that synthesized by FCVA.
Tamor and Vassell Reference Tamor and Vassell24 found that a-C films synthesized by sputtering of graphite (Ar ions with energy of 1200 eV) on cold substrates are less dense than graphite and contain only 5–10% sp 3 coordinated carbon bonds. The band gap for such films ranges from 0.7 to 1.0 eV.
Robertson Reference Robertson16 noticed that the sizes of nanoparticles determine the band gap width. Performed spectral decomposition allows one to make a rough estimate of the size of nanoparticles with sp 2 and sp 3 configurations using the TK ratio. Comparing sizes of nanoparticles with the value of optical band gap, we found out that with increasing sp 2 nanoparticles' size and synthesis temperature, the value of E g decreases down to 0.78 eV at T sub = 250 °C. At synthesis temperature T sub = 50 °C on quartz substrate, the estimated size of sp 3 C particles is ∼6 Å and the carbon films have a band gap of 1.67 eV. Increase of band gap with decreasing synthesis temperature can be associated with the formation of both separate sp 3 sites and particles with sp 3 C–C bonding in carbon matrix.
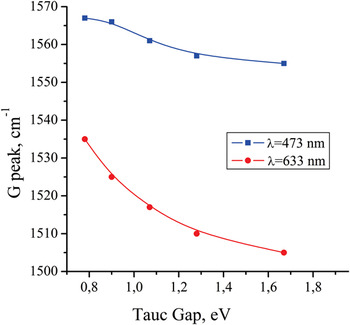
Figure 6 shows position of G peak in Raman spectrum as a function of band gap in carbon films synthesized on quartz substrates. From the figure, one can see that the G peak position takes higher values at higher excitation energy. Such behavior of G peak was shown in studies, Reference Ferrari and Robertson19,Reference Tamor and Vassell24 where Raman spectra and optical Tauc gap in a-C:H were studied. The presence of hydrogen increases the content of sp 3 fraction, as H modifies its C–C network and rectifies free π* electrons so that the value of sp 2/sp 3 ratio decreases. Reference Ferrari and Robertson19,Reference Tamor and Vassell24 It is the change of sp 3 content in the structure of synthesized a-C:H films that influences the G peak position and the energy band gap. As it was noted in Ref. Reference Ferrari and Robertson19 at intermediate H content, the C–C sp 3 bonding is a maximum, the films have the highest density and diamond-like character, and the gap is 1–1.8 eV.
Dependence of G peak position on the band gap value in carbon films.

In this article, we have shown that the synthesis conditions significantly determine the formation of atomic structure and properties of carbon films. According to our results of Raman spectroscopy and measurements of optical band gap synthesized carbon films with disordered structure can contain up to 70% of sp 3 sites. Using the method of spectral decomposition, we tried to have a detailed look at the structural characteristics of carbon films. It was shown that position of the main G peak and the value of the optical band gap depend on the concentration of sp 2 and sp 3 sites and on the size of nanoparticles that they form.
IV. SUMMARY
In the article, we did not perform direct measurements of sp 2/sp 3 ratio. Using already stored world experimental data and comparing it with the results obtained in our work, we evaluated the largest possible content of sp 3 sites in carbon films synthesized by sputtering of graphite target. Using the visible Raman spectroscopy, we have shown the possibility of additional interpretation of the spectra using normal decomposition into component peaks. It was noticed that the elongated shoulder in the low-frequency region relative to the G peak is characterized by not only one mode but consists of at least two modes. One of them is determined by the current density of localized states, the main peak of which is located at a frequency of 1260 cm−1, and the second mode is determined by common known band of D peak in the region from 1350 to 1400 cm−1. Recently authors Reference Wagner, Ramsteiner, Wild and Koidl22 on the basis of visible Raman spectroscopy and comparison with UV Raman spectroscopy noted the region ∼1200–1300 cm−1 as frequency region of amorphous diamond. And this is in agreement with the position of peak 1 in a normal distribution.
For the films synthesized at 50 °C, the estimation of particle size with sp 2 and sp 3 sites was performed. Their sizes are almost the same. A system, consisting of two or more different structural units forming the areas with a certain phase state, can be attributed to the nanoheteromorphous systems or can be defined as nanoheteromorphous carbon. At this time, one phase state can be inside the other one. That is, for example, nanoparticles with sp 2 sites are distributed in a matrix consisting of sp 3 sites. Therefore, in the temperature range from 50 to 100 °C, we obtained carbon film with a band gap, which defines DLC structures. When the synthesis temperature is from 150 to 250 °C, carbon films have GLC structure in a greater degree.
Based on the foregoing, we can state that using balanced magnetron sputtering for the synthesis of carbon films under certain conditions, it is possible to obtain structures with high sp 3 content and to conduct modification of the structure in a wide range of GLC to DLC. Significant effect of the phase of substrate's surface and its temperature on the process of self-organization of condensing carbon atoms and structure formation of synthesized carbon films was shown.
ACKNOWLEDGMENTS
This work was supported by the grant of Ministry of Education and Science of the Republic of Kazakhstan No.1094/GF.