Introduction
For those involved in beef cattle genetic improvement programmes, producers and processors, estimates of meat yield, meat distribution in the carcass (due to the differences in value between cuts), and ideally carcass value based on meat yield and distribution, is desirable. Accurate prediction of carcass value or quality based on body composition would enable the early selection of efficient animals by beef producers as well as seedstock breeders (Afolayan et al., Reference Afolayan, Pitchford, Deland and McKiernan2007). Live-animal indicators of carcass meat yield and distribution include visual muscular and skeletal scores, whereas carcass indicators are conformation and fat scores. Carcass merit of animals in pedigree beef herds, which are destined for breeding, is dependent on having information on the relationship between measurements and scores taken on the live-animal and carcass meat yield and value. Data collected at present by breed societies and others involved in beef improvement programmes include muscular and skeletal scores, and scanned longissimus muscle size and fat cover. In the European Union (EU), data recorded for beef carcasses include scores for conformation (EUROP scale with E best for conformation) and fatness (scale 1 to 5, with 5 fattest), gender category (steer, heifer, young bull, cow, bull) and carcass weight. Conformation and fatness are based on visual examination of carcasses (Commission of the European Communities, 1982), which, since this study was carried out, has been replaced by mechanical classification in Ireland (Allen and Finnerty, 2000). In the EU, payment for carcasses within each gender category is based mainly on carcass scores, payment for which can differ substantially between countries particularly, for conformation. It is therefore desirable to acquire information on the effect of classification scores on meat yield and distribution. Such information, in addition to being useful for pricing purposes, can be used in beef improvement programmes where progeny are identified and classified at slaughter.
Tatum et al. (Reference Tatum, Dolezal, Williams, Bowling and Taylor1986) showed that a subjective score for muscle thickness on the live animal was significantly associated with meat yield. Similarly, Perry et al. (Reference Perry, McKiernan and Yeates1993a) reported a correlation of 0.70 between saleable meat and muscle score on the live animal. Afolayan et al. (Reference Afolayan, Deland, Rutley, Bottema, Ewers, Ponzoni and Pitchford2002) showed that prediction equations, using objective measurements recorded on the live animal, accounted for 56%, 56% and 39% of the variation in carcass meat, fat and bone proportions, respectively. Kauffman et al. (Reference Kauffman, Grummer, Smith, Long and Shook1973) found that animal or carcass shape was a significant factor in determining carcass composition, but its role was minor compared with carcass fatness. They concluded that the importance of muscularity may be overlooked when carcass composition is determined by techniques such as specific gravity or proportion of trimmed wholesale or retail cuts in which bone was not removed, and thus permitted to influence the net result. Earlier studies showed that carcass conformation score (shape due to muscle and fat layers) was of little value as an indictor of meat yield but that fat-corrected conformation score was valuable in commercial classification schemes (Kempster and Harrington, Reference Kempster and Harrington1980; Kempster, Reference Kempster1986). Perry et al. (Reference Perry, Yeates and McKiernan1993b) reported that carcass weight alone, carcass weight with carcass muscle score, and carcass weight with carcass muscle and fat scores accounted for 0.1%, 37.9% and 46.7%, respectively, of the total variation in saleable meat yield. Despite the widespread use of live-animal scoring in breeding programmes and the use of the EU carcass classification grid for pricing, there are few data showing the relationship of those with carcass meat yield and value.
The objective of the present study was to examine the relationships of live-animal visual muscular and skeletal scores, carcass weight and length, carcass fat depth over the longissimus dorsi muscle, and carcass conformation and fat scores, with killing-out rate, carcass composition and estimated carcass value of bulls and heifers.
Materials and methods
Animals and management
In all, 48 bulls and 37 heifers were used in the study. The animals were the progeny of late-maturing purebred (Charolais and Limousin) or crossbred [Limousin × Friesian, Limousin × (Limousin × Friesian) and Simmental × (Limousin × Friesian)] beef suckler cow genotypes. Forty bulls and all of the heifers were the progeny of one Limousin sire, whereas the remaining eight bulls were the progeny of a Charolais sire. The animals used represent a major segment of the progeny from the Irish beef cow herd, which comprises 51% of total cows where 71% are late-maturing breed crosses and 86% are bred to late-maturing sire breeds (CMMS, 2006). The animals were born in spring, spent the summer at pasture with their dams and were weaned at an average of 8 months of age. The bulls spent the subsequent 218 days indoors during which they were offered a diet based on well-preserved, high nutritive value grass silage (pH 3.7, dry matter (DM) 197 g/kg, crude protein (CP) 144 g/kg, in vitro dry matter digestibility (IVDMD) 774 g/kg) ad libitum and an average of 4.0 kg per head daily of a barley-based concentrate supplement. Daily liveweight gains of the bulls pre- and post-weaning averaged 1.00 and 1.19 kg/day, respectively. They were slaughtered at an average age of 458 days. Forty were slaughtered on the same day and the remaining eight 7 days later. The heifers were offered the same grass silage as the bulls plus 1 kg of concentrate daily during the 5-month winter following weaning after which they spent a second season at pasture. They received an average of 3.3 kg of concentrates per head daily during the last 84 days before slaughter and grazed grass was replaced with grass silage (pH 3.8, DM 163 g/kg, CP 155 g/kg, IVDMD 713 g/kg) for the final 36 days. Daily liveweight gains of the heifers pre- and post-weaning were 0.88 and 0.67 kg/day, respectively. All were slaughtered on the same day at an average age of 612 days. Final liveweights were the mean of unfasted weights taken on two mornings before slaughter. All animals were slaughtered in the same commercial abattoir.
Live animal scores
Visual muscular scores were assigned to each animal using both the Irish Cattle Breeding Federation (ICBF) and Signet scoring (Collins, 1998) procedures at weaning and prior to slaughter. The ICBF system (ICBF linear scoring reference guide, 2002) involved assigning muscular scores (scale 1 to 15) at nine locations: (1) width at withers, (2) width behind withers, (3) thigh width, (4) development of hind quarters, (5) thickness of loin, (6) development of inner thigh, (7) loin width, (8) rump width and (9) thigh depth). Two trained Assessors from ICBF (A and B) scored the animals at slaughter but only Assessor A scored them at weaning. In the Signet procedure, muscular scores (scale 1 to 15) were assigned at three locations (roundness of hindquarter, width of rump and width and thickness of the loin) using two experienced Assessors (C and D) from the research centre on each occasion. For each Assessor the scores at the different locations were averaged to give one value for each animal at weaning and prior to slaughter. In addition, prior to slaughter all animals were assigned skeletal scores (scale 1 to 10) at three locations (length of back, pelvic length and height at withers) by the ICBF Assessors.
Slaughter and carcass records
Hot carcass weight and weight of kidney plus channel fat were recorded at slaughter. Cold weight was taken as 0.98 hot carcass weight. Carcasses were visually classified according to the EU Beef Carcass Classification Scheme (Commission of the European Communities, 1982), but on a 15-point rather than on a five-point scale, by assigning +, 0 or − to each score on the five-point conformation and fat scales.
Carcass meat, fat and bone proportions were obtained following dissection of each carcass using the commercial procedures practiced by the processor. The two sides of each carcass were quartered into hind- and fore-quarters between the 12th and 13th rib for bulls and 10th and 11th rib for heifers. There were seven joints in the hind-quarter (silverside, topside, striploin, rump, knuckle, fillet and flank steak) and six in the fore-quarter (chuck, cube roll, brisket, clod, shoulder blade and flat rib). The weight of meat in each joint (after bone and dissectable fat had been removed) was recorded individually. The weight of fat and bone from each joint was combined for each quarter separately, to give the total weight for both hind- and fore-quarters. The total weight of meat was the sum of the individual meat cuts plus lean trim. Carcass value (value per kg, c/kg) was the sum of the commercial values of each boneless, fat-trimmed meat cut and lean trim with a small deduction for bone expressed as a proportion of cold carcass weight.
Statistical analysis
Data were analysed using Statistical Analysis Systems Institute (SAS 2003). Correlations among the variables were determined using the Proc. CORR procedure and linear regression analysis was carried out using the Proc. GLM procedure.
Results
Animal details
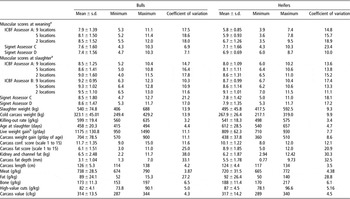
Mean, s.d., minimum and maximum and CV values for the scores, slaughter and carcass traits of the bulls and heifers are presented in Table 1. Average carcass weights of bulls and heifers were 323 and 268 kg, respectively. Carcass conformation and fat scores (scale 1 to 15) for bulls were 11.7 and 6.1, and for heifers were 10.1 and 8.9, respectively. Mean carcass meat, fat and bone proportions for bulls were 738, 89 and 173 g/kg, respectively. Corresponding figures for heifers were 720, 92 and 188 g/kg.
Mean, standard deviation, range and coefficient of variation for live animal and carcass traits of bulls and heifers

aScale 1 to 15; bBirth to slaughter.
Correlations using live animal muscular scores
A preliminary examination of the data for the ICBF Assessors showed that correlations of muscular scores using the average of the entire nine locations with the various carcass traits were often lower than that obtained using only five locations (numbers 1 to 5) or just two locations (thigh width and development of the hind-quarters). Consequently, the data are presented for nine, five and two locations for both Assessors A and B. Correlations between muscular scores taken at weaning and at slaughter by Assessors A (using five locations), C and D were 0.73, 0.75 and 0.59 for bulls and 0.44, 0.42 and 0.51 for heifers, respectively. Correlations between Assessors C and D using the same scoring procedure for bulls and heifers were 0.83 and 0.74 at weaning, and 0.82 and 0.83 at slaughter, respectively. Corresponding correlations between muscular scores at slaughter between Assessors A and B were 0.87 and 0.86.
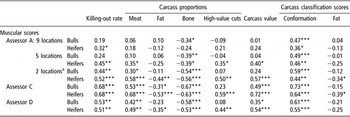
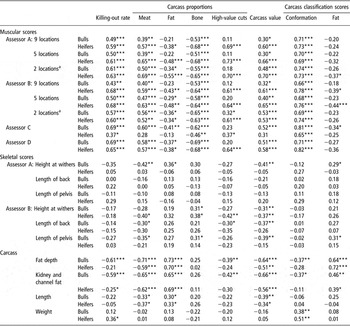
Assessor A, using the ICBF procedure, found higher correlations for the muscularity scores at slaughter with killing-out rate and the various carcass traits than for those recorded at weaning (Tables 2 and 3). Data from Assessors C and D, using the Signet scoring procedure, generally showed good correlations between the muscular scores recorded at both weaning and pre-slaughter and carcass traits. Although correlations were generally better pre-slaughter than at weaning, some exceptionally low correlations were obtained by Assessor C for the heifers pre-slaughter. Using the data recorded by Assessor A at weaning, the only correlation that consistently showed r values of ∼0.5 with muscular score was carcass conformation score. Correlations between muscular scores and various traits were greatest when using only two scoring locations (width and development of the hind-quarter) followed by five scoring locations. The lowest correlations were obtained when all nine muscular scoring locations were used. The results obtained using the muscular score (five locations) recorded by Assessor A pre-slaughter for both bulls and heifers showed significant positive correlations with killing-out rate (r = 0.50 and 0.61), carcass meat proportion (r = 0.39 and 0.65), carcass value (r = 0.30 and 0.66) and carcass conformation score (r = 0.70 and 0.69). High negative correlations were obtained between muscular score and carcass bone proportion (r = −0.51 and −0.68). Correlations with the proportion of high-value cuts were positive but variable, whereas those with carcass fat proportions and carcass fat score were generally low and negative. The results with Assessor A are in general agreement with those obtained with the other Assessors.
Correlations of live animal visual muscular scores taken at weaning with killing-out rate, carcass composition, value and carcass classification scores

aWidth and roundness of hind-quarters.
Correlations of live animal visual muscular and skeletal scores taken pre-slaughter and carcass measurements with killing-out rate, carcass composition, value and carcass classification scores

aWidth and roundness of hind-quarters.
Correlations using live animal skeletal scores
Correlations between each of the three individual ICBF skeletal scores (length of back, length of pelvis and height at withers) recorded at slaughter by both Assessors A and B with killing-out rate and the various carcass traits were low and generally not significant.
Correlations using carcass measurements
Significant (P < 0.001) positive correlations were obtained in both bulls and heifers for carcass fat depth with carcass fat proportion (r = 0.73 and 0.70) and carcass fat score (r = 0.64 and 0.72). The only other consistently significant correlations with carcass fat depth were carcass meat proportion (r = −0.71 and −0.59) and carcass value (r = −0.64 and −0.51). Correlations with kidney plus channel fat weight reflected those with carcass fat depth except that the correlations with carcass fat score were considerably lower.
Correlations with carcass length were either not significant or low and negative with carcass meat proportion and carcass value, or low and positive with carcass fat proportion. Correlations with carcass weight were generally not significant except for carcass conformation (r = 0.38 and 0.51).
Correlation of carcass class with carcass composition and value
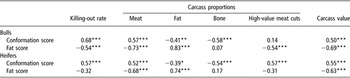
High positive correlations (P < 0.001) were obtained (Table 4) with both bulls and heifers for carcass conformation score with killing-out rate (r = 0.68 and 0.57), carcass meat proportion (r = 0.57 and 0.52) and carcass value (r = 0.50 and 0.55). Significant negative correlations were obtained for carcass conformation with both carcass fat and bone proportions, whereas correlations were positive but variable with the proportion of high-value cuts in the carcass. Correlations of carcass fat score were high and positive with carcass fat proportion (r = 0.83 and 0.74) and negative with carcass meat proportion (r = −0.73 and −0.68), carcass value (r = −0.69 and −0.63), proportion of high-value cuts (r = −0.54 and −0.31) and killing-out rate (r = −0.54 and −0.32). Correlations between carcass fat score and carcass bone proportion were not significant.
Correlations of carcass conformation and fat score with killing-out rate, carcass meat, fat and bone proportion, proportion of high-value meat cuts in the carcass and carcass value

Regression equations relating carcass class to carcass composition and value
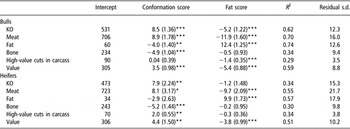
Linear regression equations describing the relationships of carcass conformation and fat scores with killing-out rate, carcass meat, fat and bone proportions, the proportion of high-value cuts in the carcass and carcass value are shown in Table 5. Increasing conformation score resulted in a significant increase in killing-out rate, whereas increasing fat score had a negative effect (not significant for heifers). The effects of a one-unit change (scale 1 to 15) in carcass conformation and fat scores on meat proportion (g/kg) for bulls were 9 and −12 (R 2 = 0.70), and for heifers they were 8 and −10 (R 2 = 0.55), respectively. The corresponding figures for carcass value (c/kg) were 3.5 and −5.4 for bulls (R 2 = 0.59) and 4.4 and −3.8 for heifers (R 2 = 0.51). The proportion of the total variation in carcass fat proportion explained by carcass conformation and fat scores was 0.74 and 0.57 for bulls and heifers, respectively. Corresponding values were 0.34 and 0.30 for carcass bone proportion, and 0.29 and 0.34 for the proportion of high-value cuts in the carcass. Improving carcass conformation score had a negative effect on both carcass fat (not significant for heifers) and bone (P < 0.001) proportions. Increasing fat score had a positive effect (P < 0.001) on carcass fat proportion but had non-significant negative effects on carcass bone proportion.
Regressions on carcass conformation and fat scores (s.e.) of killing-out rate (g/kg) carcass meat, fat and bone proportions (g/kg), the proportions of high-value meat cuts in the carcass (g/kg), and carcass value (c/kg)

KO = killing-out rate.
Discussion
Experimental animals
On a scale of 1 to 15, the ranges in carcass conformation scores were from 9 to 15 for the bulls and from 8 to 12 for the heifers. In addition to the limited range, the animals were mainly from the upper part of the conformation scale. The range in fat scores (scale 1 to 15) was from 3 to 11 for bulls and from 5 to 12 for heifers. Thus, there were no carcasses in either extreme of fat scores, which for most markets is unacceptable. This narrow range in class was not surprising as the animals were 0.75 to 1.0 late-maturing breed genotypes, which produce carcasses of good conformation score and low fat score (Drennan, Reference Drennan2006).
Assessors
The relatively low correlations, particularly for heifers (r ≈ 0.45), between muscular scores at weaning and those recorded by the same Assessor pre-slaughter indicate either that the Assessors were inconsistent or that the scores obtained at weaning were not a good indication of those pre-slaughter. The high correlations (r ≈ 0.80) between Assessors using the same scoring procedure at the same time suggest the latter is the case. The discrepancy between the weaning and pre-slaughter scores may be attributed to variation in the pre-weaning nutritional level, and thus the difference in body condition at weaning resulting from differences in milk production of the dams, which varied in genotype from beef × Holstein/Friesian to purebred Charolais and Limousin. Earlier studies (Drennan et al., Reference Drennan, MacAodháin, Murphy and Doorley2004) have shown excellent correlations between live-animal muscular scores taken pre-slaughter and carcass conformation. However, although lower, corresponding correlations using muscular scores recorded at 8/9 months were satisfactory in these studies for animals reared on a high plane of nutrition but less so for those reared on moderate to low feeding levels. The differences in muscular scores between Assessors that were relatively small can be attributed to the use of two different scoring procedures (ICBF and Signet) and the fact that they involve a subjective visual assessment of muscular development. To be effective, visual scoring necessitates proper training and frequent assessment.
Visual muscular scores
The high correlations (r ≈ 0.65 to 0.82) between muscular scores taken at slaughter and carcass conformation score indicate that both evaluations provide a fairly similar description of the animal or carcasses in terms of muscular development. Higher correlations (r = 0.81 to 0.87) were obtained by Drennan et al. (Reference Drennan, Keane and McGee2007) with steers, which may be partly attributed to the greater range in conformation scores (2 to 11) in that study. Although the correlations were high, conformation is defined as the thickness of muscle and all fat, whereas muscularity is the thickness of the muscle only (Kempster, Reference Kempster1986). These findings are in agreement with those of Perry et al. (Reference Perry, McKiernan and Yeates1993a and Reference Perry, Yeates and McKiernan1993b) who reported correlations of 0.84 and 0.79 between live-animal and carcass muscle scores, respectively. The fact that there were negative relationships between muscular scores pre-slaughter and carcass fat proportion indicates that Assessors did not give animals with more fat a higher muscular score. The significant positive correlations obtained between the muscular scores recorded pre-slaughter and killing-out rate agree with the findings of Perry and McKiernan (Reference Perry and McKiernan1994). In agreement with Drennan et al. (Reference Drennan, Keane and McGee2007), high positive correlations were obtained for pre-slaughter muscular scores with carcass meat proportion and carcass value, whereas negative correlations were obtained with carcass bone and fat proportions. The most important evaluations are the relationships with saleable meat proportion and carcass value. The latter takes account of both saleable meat proportion and its distribution in the carcass. Perry et al. (Reference Perry, McKiernan and Yeates1993a) and Drennan et al. (Reference Drennan, Keane and McGee2007) reported correlations of ∼0.70 between live-animal muscular scores taken pre-slaughter and percentage meat yield, which were higher than those obtained in the present study (r ≈ 0.60). The lower correlation can probably be attributed to the smaller range in scores in the present study. However, May et al. (Reference May, Mies, Edwards, Harris, Morgan, Garrett, Williams, Wise, Cross and Savell2000) obtained a considerably lower correlation of 0.35 between muscular score and percentage yield of boneless subprimals. Tatum et al. (Reference Tatum, Dolezal, Williams, Bowling and Taylor1986) found that, within an animal frame size, the percentage of separable muscle increased, and percentage of bone decreased, with increased muscle thickness when adjusted to a constant fat percentage. In contrast, Herring et al. (Reference Herring, Williams, Bertrand, Benyshek and Miller1994), using Hereford steers, found no relationship between percentage retail product and a visual muscle score recorded on the live animal. It is noticeable that in the present study all muscular score estimates showed high negative correlations with carcass bone proportions. Therefore, decreased bone proportion as muscular score increased is an important contributor to the positive association between muscular score and carcass meat proportion.
In the present study, the results obtained with both ICBF Assessors showed that correlations of muscular scores at slaughter with carcass meat proportion and value generally improved as the number of muscular scoring locations included in the analysis decreased from 9 to 2. Similarly, in the study of Drennan et al. (Reference Drennan, Keane and McGee2007), correlations of muscular score pre-slaughter with carcass meat proportion and value were equally as good using only two locations (width and roundness of the hind-quarter) as with six locations. Consequently, consideration must be given to the selection of muscular scoring locations and a simplified system with fewer locations may lead to a better assessment of important carcass traits. In comparison to muscular scoring pre-slaughter, scoring at weaning resulted in considerably lower correlations in most instances with killing-out proportion and the various carcass traits. This was most likely due to variation in body condition at weaning resulting from differences in pre-weaning gains as already discussed.
Visual skeletal scores
Correlations of skeletal scores with the various traits were mainly low and not significant, which is in general agreement with other findings (May et al., Reference May, Mies, Edwards, Harris, Morgan, Garrett, Williams, Wise, Cross and Savell2000; Drennan et al., Reference Drennan, Keane and McGee2007). Bailey et al. (Reference Bailey, Jensen and Bech Andersen1986) reported significant positive correlations for wither height with percentage carcass bone, non-significant positive correlations with percentage fat and non-significant (at higher weights) negative correlations with percentage carcass lean. Similarly, Herring et al. (Reference Herring, Williams, Bertrand, Benyshek and Miller1994) reported non-significant negative correlations between percentage retail product and both hip height and a visual frame size. Afolayan et al. (Reference Afolayan, Pitchford, Deland and McKiernan2007) found that the correlation of body dimensions with muscularity was near zero.
Carcass measurements
Correlations of carcass fat depth for bulls and heifers were 0.73 and 0.70 with carcass fat proportion and were 0.64 and 0.72 with carcass fat score, respectively. These figures showed good correlation between carcass fat depth and the other fat indicators but were somewhat lower than the correlation between carcass fat proportion and carcass fat score of 0.83 and 0.74 for bulls and heifers, respectively. Corresponding significant negative correlations of −0.71 and −0.59 were obtained between carcass fat depth and carcass meat proportion, which is in general agreement with previous findings (Griffin et al., Reference Griffin, Savell, Recio, Garrett and Cross1999; May et al., Reference May, Mies, Edwards, Harris, Morgan, Garrett, Williams, Wise, Cross and Savell2000; Greiner et al., Reference Greiner, Rouse, Wilson, Cundiff and Wheeler2003). Jones et al. (Reference Jones, Tong and Robertson1989) found that an average fat thickness recorded at the 12th rib explained 0.40 of the total variation in carcass lean content, which was increased to 0.51 when loin area was also included.
In common with live-animal length scores, carcass length was poorly correlated with all traits examined, showing only significant negative correlations (r ≈ −0.36) with carcass meat proportion and carcass value and significant positive correlations (r ≈ 0.30) with carcass fat proportion.
There were no significant correlations between carcass weight and carcass meat, fat or bone proportion although other studies (Herring et al., Reference Herring, Williams, Bertrand, Benyshek and Miller1994; Greiner et al., Reference Greiner, Rouse, Wilson, Cundiff and Wheeler2003) have shown that carcass fat increases and meat declines with increasing carcass weight. The significant positive correlations between carcass weight and carcass conformation indicate that conformation score increased as carcass weight increased. Alternatively, animals of better conformation tend to have better carcass growth rates and heavier carcasses.
Carcass class
Correlations of carcass conformation and carcass meat proportion were lower in the present study (0.57 and 0.52 for bulls and heifers, respectively) than that reported by Drennan et al. (Reference Drennan, Keane and McGee2007) with steers (r = 0.80), but similar to the value of 0.60 obtained by Perry et al. (Reference Perry, McKiernan and Yeates1993a) for carcass muscle score and saleable meat proportion. The poorer correlation in the present study compared with Drennan et al. (Reference Drennan, Keane and McGee2007) maybe due to the greater range in carcass conformation scores in the previous study. Correlations of carcass fat score with carcass meat proportion in the present study (r = −0.73 and −0.68 for bulls and heifers, respectively) were similar to those obtained previously (May et al., Reference May, Mies, Edwards, Harris, Morgan, Garrett, Williams, Wise, Cross and Savell2000; Greiner et al., Reference Greiner, Rouse, Wilson, Cundiff and Wheeler2003). Bohuslávek (Reference Bohuslávek2002) obtained correlations of carcass conformation and fat scores with percentage saleable meat of 0.05 and −0.71, respectively. However, when examined within fat classes, significant correlations between conformation and percentage meat yield were obtained with a value of 0.60 recorded with fat class 3 animals.
Regression of carcass composition and value on carcass scores
In the present study, carcass conformation and fat scores accounted for 0.70 and 0.55 of the total variation in carcass meat proportion for bulls and heifers, respectively. The corresponding figure in the study of Drennan et al. (Reference Drennan, Keane and McGee2007) for steers was 0.75. Perry et al. (Reference Perry, McKiernan and Yeates1993a) found that carcass weight alone, carcass weight with carcass muscle score, and carcass weight with carcass muscle score and fat depth accounted for 3.7%, 37.6% and 52.2%, respectively, of the variation in percentage saleable meat yield. Corresponding values reported by Perry et al. (Reference Perry, Yeates and McKiernan1993b) were 0.1%, 37.9% and 46.7%. Jones et al. (Reference Jones, Tong and Robertson1989) found that a visual fat score, a muscle thickness score and the combined fat and muscle scores taken on the cold carcass accounted for 0.42, 0.20 and 0.51, respectively, of the total variation in lean meat yield. However, Bailey et al. (Reference Bailey, Jensen and Bech Andersen1986) found that the carcass conformation score of Holstein × Friesian bulls was not a good indicator of carcass composition as the r values were −0.07, 0.23 and −0.42 with carcass fat, lean and bone, respectively.
A one-unit increase in carcass conformation score (scale 1 to 15) was associated with a lower increase in carcass meat proportion (8.9 and 8.1 g/kg for bulls and heifers, respectively) than that obtained in the study of Drennan et al. (Reference Drennan, Keane and McGee2007) with steers (14.1 g/kg). However, the corresponding effects of a one-unit (scale 1 to 15) increase in carcass fat score were greater in the present study (−11.9 and −9.7 g/kg for bulls and heifers, respectively) than in the previous one (−7.4 g/kg). The proportion of total variation in carcass value explained by the visually assessed carcass scores was somewhat less than that for carcass meat proportion. The proportion of total variation in carcass fat proportion (R 2 ≈ 0.66) explained by carcass scores was similar to that for meat yield, but values were lower for carcass bone proportion (R 2 ≈ 0.32) and the proportion of high-value cuts in the carcass (R 2 ≈ 0.32). In general, the various R 2 values were lower in the present study than in the study of Drennan et al. (Reference Drennan, Keane and McGee2007) with steers. This can probably be attributed to the fact that the bulls and heifers in the present study were 0.75 to 1.0 late-maturing breeds and as a result had narrow range of high conformation scores, whereas in the other study the steers varied from Holstein-Friesian to >0.9 late-maturing breeds and thus, had a greater range in conformation scores.
Conclusions
The results show that carcass conformation and fat scores are effective in predicting carcass meat proportion, accounting for 0.55 to 0.70 of the total variation. Where breeding animals are concerned, a live animal muscular score can be used as an indicator of meat yield but such an assessment is only useful following the provision of a relatively high level of nutrition. Assessments carried out on progeny at weaning may not be useful where pre-weaning growth rates are low, resulting in poor body condition and thus, preventing animals from expressing differences in muscular development. In these circumstances, the scores would tend to be overly influenced by pre-weaning gain, which in suckled progeny is mainly a reflection of milk production of the dam. However, in the present study, muscular scores taken pre-slaughter were shown to explain from 25% to 50% of the variation in meat yield.
Acknowledgements
The authors acknowledge the contribution of research student Ms B. Murphy and the technical assistance of Mr B. Davis.