I. INTRODUCTION
Tin dioxide is one of the most important base materials for a variety of semiconductor gas sensors. The sensitivity and selectivity of these sensors are mostly determined by the surface properties of SnO2.Reference Barsan, Schweizer-Berberich and Gopel1–Reference Huang and Wan5 Possibly as a result of changes in surface properties, SnO2 modified by different metal oxides or metals as cocatalysts can show higher selectivity toward specific gases.Reference Basu and Basu6–Reference Hidalgo, Castro, Coelho and Gouvea16 SnO2 nanoparticles have attracted considerable attention as sensors because of their improved sensitivity to various gases.Reference Barsan, Schweizer-Berberich and Gopel1–Reference Huang and Wan5 Such improvement presumably arises from the availability of a higher surface area compared with the traditional polycrystalline oxide thin films. However, the high surface area may increase instability due to both kinetic and thermodynamic factors. Thus, knowledge of the surface thermodynamics is of key importance in predicting nanosensor stability during processing or operation.
Another challenge in the development of highly selective/sensitive nanosensors arises because water molecules (commonly present in the environment) often influence the measured signals. That is, any gas being sensed is usually competing with H2O for adsorption on the surface of the sensor. Hence, one may expect that the strength of the water adsorption on the surface of the sensor will affect its sensitivity and selectivity, and since nanoparticles generally have more adsorbed water than do films, such competition may be more important for nanoparticle-based sensors. Thermodynamically, this can be analyzed by providing data on the energetics of water adsorption and evaluating the differences between the surface energies of hydrated and anhydrous SnO2 nanoparticles.
The average surface of a SnO2 particle is claimed to be composed of 60% of (110) planes, 20% of (111) planes, and 20% of (100) planes.Reference Boyle and Jones17, Reference Mulheran and Harding18 SnO2 (100) is the most stable surface of the crystal, with a surface energy computed in the range of 1.29–1.45 J·m−2.Reference Oviedo and Gillan19, Reference Yamaguchi, Tabata and Yashima20 SnO2 (111) and (100) planes are theoretically predicted to have higher energies of 2.21 and 1.37–1.67 J·m−2, respectively.Reference Oviedo and Gillan19, Reference Yamaguchi, Tabata and Yashima20 The enthalpy of adsorption of water on the surface of SnO2 has been theoretically predictedReference Evarestov, Bandura and Proskurov21, Reference Batzill, Diebold, Bergermayer and Tanaka22 and is found to be strongly dependent on the adsorbing planes of the oxide. However, these theoretical calculations currently lack experimental validation.
In this work, we report experimental results for both surface energies and energies of water adsorption for high-purity SnO2 nanoparticles. The structure and morphology of the samples were characterized by x-ray diffraction (XRD), gas adsorption [Brunauer–Emmett–Teller (BET)], and transmission electron microscopy (TEM), and the surface energies for both anhydrous and hydrated surfaces were calculated through measurements of enthalpy of drop solution in a molten oxide solvent and enthalpy of water adsorption measured by microcalorimetry, following previously published methodology.Reference Zhang, Xu, Navrotsky, Lee, Kim and Liu23–Reference Radha, Bomati-Miguel, Ushakov, Navrotsky and Tartaj26
II. EXPERIMENTAL METHODS
A. Synthesis of tin dioxide
SnO2 nanoparticles were prepared by the oxidation of metallic tin with boiling concentrated nitric acid in a refluxing system for three days to allow full oxidation. The sample was centrifuged, and the clear supernatant was removed. The nanoparticles were then washed with deionized water and neutralized with ammonium hydroxide. The resulting product was centrifuged and washed with deionized water five times and dried at 60 °C overnight. Nanoparticles with different average sizes were prepared by annealing at increasing temperatures (400–600 °C) under an oxygen atmosphere.
B. Characterization
Powder XRD patterns were collected using a Bruker AXS D8 Advance diffractometer (Bruker AXS, Madison, WI) (CuKa radiation, λ = 1.5406 Å) operated at 40 kV and 40 mA. Data were collected in the range 20°–80° (2θ) with a step size of 0.008° (2θ) and a collection time of 1 sec per step.
The morphology, aggregation state, and exposed surfaces of the powders were examined by TEM (TEM-Philips, CM12, FEI, Oregon, US). The surface area was measured by the BET method using a Micromeritics ASAP 2020 apparatus (Micromeritics, Norcross, GA). Each sample was degassed at 300 °C for 2 h before BET measurement.
Thermogravimetric analysis (TGA) and differential scanning calorimetry (DSC) were carried out using a Netzsch STA 449 system (Netzsch GmbH, Selb, Germany) to determine the total water content. In a typical procedure, the sample was heated in a platinum crucible from 30 to 400 °C in an oxygen atmosphere at 10 °C/min and held at 400 °C for 2 h. A buoyancy correction was made by subtracting the baseline collected by running a blank TGA/DSC with an empty platinum crucible. The water content was determined from the weight loss curve.
C. Oxide melt solution calorimetry
High-temperature drop solution calorimetry was carried out using a custom-built Calvet-type twin calorimeter.Reference Navrotsky27, Reference Navrotsky28 Pellets of about 5 mg were weighed using a microbalance and dropped into molten lead borate (2PbO·B2O3) solvent at 800 °C in the calorimeter. Oxygen was bubbled through the solvent (at 40 mL·min−1) to disperse the samples and increase dissolution rate, ensure an oxidizing atmosphere, and prevent any possible reduction of Sn4+ to lower oxidation states. Oxygen was also flushed over the solvent in the calorimeter to purge water vapor evolved during dissolution reaction. Before thermal analysis and calorimetry, the samples were left in the calorimetric suite for 1 week (24 ± 1 °C and 50 ± 5% humidity) to obtain equilibrated and consistent surface water content.
D. Water adsorption microcalorimetry
A combination of a Micromeritics ASAP 2020 as adsorption analyzer and a Setaram DSC111 Calvet microcalorimeter (Setaram Instrumentation, Caluire, France) operating at 25 °C was used to measure the water adsorption energy on the surface of SnO2. The instrument and methodology are described in detail elsewhere.Reference Ushakov and Navrotsky29 Before calorimetry, the sample was degassed at 400 °C under vacuum for 2 h to eliminate adsorbed water without coarsening of the sample. The original surface areas of the samples used in the tests were 10,408 m2·mol−1 (69 m2·g−1) and 10,922 m2·mol−1 (72 m2·g−1), and after the vacuum treatment, they were the same. The dose of H2O was 2 μmol per 1000 mg of sample with a stabilization time of 1 h between doses.
III. RESULTS AND DISCUSSION
A. Structural characterization of SnO2 nanoparticles
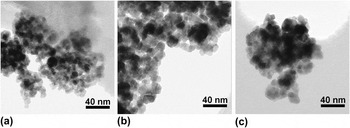
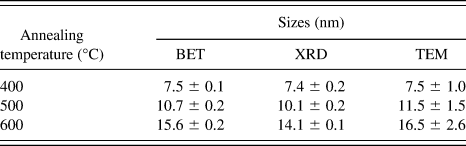
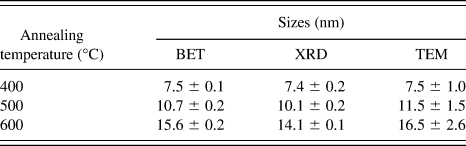
SnO2 samples treated at different temperatures showed similar XRD patterns with broadened peaks and were identified as pure rutile phase. The morphology of the annealed SnO2 nanocrystals is shown in Fig. 1. The nanocrystals are relatively isotropic and slightly faceted with average sizes of 7.5 ± 1.0, 11.5 ± 1.5, and 16.5 ± 2.6 nm for the samples treated at 400, 500, and 600 °C, respectively. The sizes obtained from TEM images agree well with the crystallite sizes calculated from XRD patterns and calculated from the specific surface area measured by N2 adsorption (BET), as listed in Table I. This consistency suggests the absence of roughness on the surface and indicates a low degree of agglomeration, since highly aggregated samples would show a smaller crystallite size from XRD patterns than from BET.Reference Costa, Ushakov, Castro, Navrotsky and Muccillo30
Transmission electron micrographs (scale bar, 40 nm for all samples) of the SnO2 nanoparticles annealed at different temperatures for 4 h: (a) 400 °C, (b) 500 °C, and (c) 600 °C.

Comparison of particle sizes of SnO2 nanoparticles determined from x-ray diffraction (XRD), Brunauer–Emmett–Teller (BET), and transmission electron microscopy (TEM).
B. Calorimetry
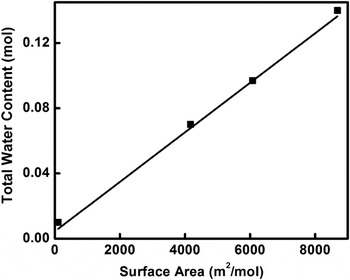
Figure 2 shows the total water content determined by TGA for the SnO2 samples treated at different temperatures and left to rest in the calorimetric suite (24 ± 1 °C and 50 ± 5% humidity). Water content increases linearly with surface area. Based on TGA, the adsorbed water was completely removed by heating at 400 °C for 1 h, but the final particle size did not significantly change by heating at this temperature. This suggests that the water molecules are not strongly bonded to the surface.
Total water content obtained from thermogravimetric analysis for different samples versus Brunauer–Emmett–Teller surface area. The error bars are smaller than the symbol size.

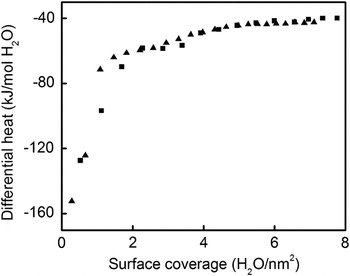
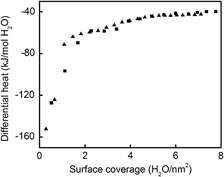
Figure 3 shows the differential enthalpy of water adsorption as a function of water coverage. Zero surface coverage represents the surface after the vacuum treatment at 400 °C. The first dose of water is relatively strongly bonded to the sample surface, with an adsorption enthalpy of −152 kJ·mol−1. As the coverage increases, the magnitude of this energy decreases very quickly until about 2H2O·nm−2. With further increase of coverage, adsorption enthalpy continuous to become less exothermic and reaches the water condensation enthalpy (−44 kJ·mol−1) at a surface coverage of 5H2O·nm−2. Adsorption before this water condensation point can be considered as chemisorption and, after it, physisorption. The energy for the first chemisorbed molecules (−152 kJ·mol−1) is similar to the values calculated by density-functional theory (DFT) and is between the enthalpies of dissociative (−179.7 kJ·mol−1) and associative (−149.52 kJ·mol−1) adsorption for H2O monolayer on the (110) surface of SnO2 reported by Evarestov et al.Reference Evarestov, Bandura and Proskurov21 The numbers are also consistent with values reported by Batzill et al.Reference Batzill, Diebold, Bergermayer and Tanaka22 for other planes: −147.0 kJ·mol−1 for (100) and −146.2 kJ·mol−1 for (101). Nevertheless, it is important to remember that the experimental enthalpies are averages for the different crystal faces as they exist in the real samples. The integral adsorption enthalpy for chemisorbed water is −75 ± 2 kJ·mol−1 as an average of two sets of measurements. This datum was used in the calculation of the correction for water of the drop solution enthalpies as detailed below.
Differential enthalpy of H2O adsorption on the surface of SnO2 nanoparticles versus water coverage (two runs).

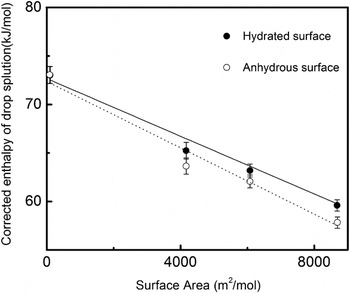
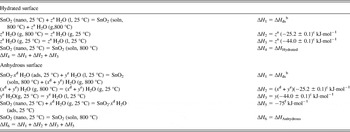
The enthalpies of drop solution are corrected for the effect of adsorbed water by following the thermochemical cycles detailed in Table II. This follows procedures described in detail previously.Reference Zhang, Xu, Navrotsky, Lee, Kim and Liu23–Reference Radha, Bomati-Miguel, Ushakov, Navrotsky and Tartaj26Table III shows the corrected data for the nanocrystalline SnO2. Figure 4 shows linear fits of the corrected drop solution enthalpies as a function of surface area. The negative of the slope of these fits corresponds to the surface energy. The energy of the hydrated surface is 1.49 ± 0.01 J·m−2, and the energy of the anhydrous surface is 1.72 ± 0.01 J·m−2. These values show that hydration stabilizes the surface. The value for the anhydrous surface is in good agreement with those predicted by DFT calculations, 1.49–1.82 J·m−2.Reference Oviedo and Gillan19, Reference Yamaguchi, Tabata and Yashima20
Corrected drop solution enthalpies of hydrous and anhydrous surfaces versus surface area. Water corrections are made using enthalpy of condensation of gaseous water. Hydrated surface enthalpy = 1.49 ± 0.01 J·m−2, R 2 = 0.94. Anhydrous surface enthalpy = 1.72 ± 0.01 J·m−2, R 2 = 0.96. x-axis error bars are not shown as they are smaller than the symbol size.

The thermochemical cycle used for calculation of water—corrected drop solution enthalpy of hydrated and anhydrous SnO2 samples.

a z is the total amount of absorbed water on the surface of SnO2 and z = x + y.
b ∆H ds is the drop solution enthalpy of SnO2 samples.
c Data are from Reference Reference Robie and Hemingway31.
d x is the amount of chemisorbed water.
e y is the amount of physisorbed water.
f Water adsorption enthalpy of chemisorbed water on the surface of nanoparticles measured with adsorption calorimetry (−75 kJ·mol−1 for 5 H2O·nm−2 coverage).
Summary of data used for surface energy calculations.

a Annealing temperature.
b H2Ototal is the total water.
c H2Ochem is the chemisorbed water.
d ∆H ds is the drop solution enthalpy measured by high temperature oxide melt solution calorimetry.
e ∆H Hydrated is the corrected drop solution enthalpy of hydrated surface.
f ∆H Anhydrous is the corrected drop solution enthalpy of anhydrous surface.
C. Comparison between SnO2 and TiO2: Thermodynamic aspects of sensing
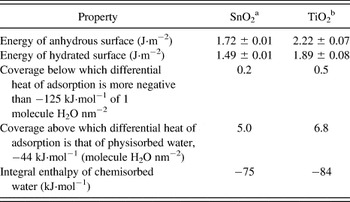
Table IV summarizes the measured surface energies and water adsorption energies for SnO2 and TiO2.Reference Levchenko, Li, Boerio-Goates, Woodfield and Navrotsky24 SnO2 (rutile) has a lower surface energy than TiO2 (rutile) for both hydrated and anhydrous surfaces. It also has a somewhat lower integral enthalpy of water adsorption and a much lower surface coverage above which the H2O is considered physisorbed. Moreover, the difference between the energies of the anhydrous and hydrated surfaces is 0.23 J·m2 for SnO2 and 0.33 J·m2 for TiO2. Taken together, these measurements indicate a much lower affinity of SnO2 for water than that for the isostructural TiO2. Therefore, even at high-humidity conditions, the amount of strongly adsorbed water on SnO2 is expected to be considerably smaller than that on TiO2, and that water is more readily removed, as confirmed by our observation that complete dehydration without coarsening can be achieved at 400 °C for SnO2, whereas for TiO2, water is not completely removed until the particles coarsen.Reference Levchenko, Li, Boerio-Goates, Woodfield and Navrotsky24 This suggests that, in a thermodynamic sense, a molecule of a gas being sensed may be able to more easily displace an adsorbed water molecule on the SnO2 surface than on TiO2. This may help to explain the superior sensing properties of SnO2 and suggests that the search for better sensor materials should focus on oxides with low surface energy and low water adsorption energy.
Surface energies and water adsorption energies of SnO2 and TiO2.

a Data are from this work.
b Data are from Reference Reference Levchenko, Li, Boerio-Goates, Woodfield and Navrotsky24.
IV. CONCLUSION
SnO2 nanoparticles were prepared by the oxidation of metallic tin with boiling concentrated nitric acid in a refluxing system in air. Combined high-temperature oxide melt solution calorimetry and water adsorption microcalorimetry gave the energies of hydrated and anhydrous surfaces, 1.49 ± 0.01 J·m−2 and 1.72 ± 0.01 J·m−2, respectively. These are in good agreement with values calculated from DFT and smaller than the values for TiO2 rutile. The integral adsorption energy was determined to be −75 kJ·mol−1, which is significantly less exothermic than that for the isostructural TiO2. This low energy of water adsorption suggests that other gas molecules may compete more favorably for bonding to the SnO2 surface than in other oxides, giving SnO2 superior gas-sensing properties.
ACKNOWLEDGMENTS
This work was supported by the U.S. Department of Energy Grant DE-FG02-05ER15667. The authors acknowledge the assistance of S.V. Ushakov, A.V. Radha, and D. Wu for their help. R. Castro acknowledges UC Davis for start-up funds.