


Obesity is a major threat to public health in industrialised countries, with alarming rises being documented in both adults and children(Reference Friedman1). It is associated with a catalogue of life-threatening diseases such as atherosclerosis, CVD and cancer, and places a considerable strain on individuals and health care systems(Reference Mokdad, Ford and Bowman2). Whilst many serious health problems relating to obesity manifest in adult life, co-morbid illnesses are becoming increasingly apparent in paediatric populations. In particular, more type 2 diabetes is being diagnosed in childhood, which is being directly attributed to the obesity epidemic(Reference Olshansky, Passaro, Hershow, Layden, Carnes, Brody, Hayflick, Butler, Allison and Ludwig3). The damaging consequences for children with obesity are not confined to coping with physical symptoms, or managing the treatment of secondary diseases such as diabetes; there are also implications for psycho-social development and well-being. Research indicates that peer victimisation, via overt and relational aggression, is more commonly experienced by children with obesity compared to normal-weight children under the age of 15 years, but beyond this age, these children are more likely to become the perpetrators of bullying(Reference Janssen, Craig, Boyce and Pickett4). Equally, a longitudinal study found that particular sub-groups of children with obesity reported decreased levels of self-esteem, and higher reported levels of sadness, loneliness and nervousness compared to normal-weight counterparts at a 4-year follow-up(Reference Strauss5). Applying International Obesity Task Force criteria(Reference Dietz and Bellizzi6), rates of overweight and obesity in childhood are currently estimated at 10–20 % in northern Europe, and 20–40 % in Mediterranean countries of southern Europe(Reference Lobstein and Frelut7). Prevalence of overweight and obesity of 31·6 % has been reported for Portuguese children(Reference Padez, Fernandes, Mourão, Moreira and Rosado8). Obese children are significantly more likely to become obese adults than are lean children(Reference Eriksson, Forsén, Osmond and Barker9). Childhood obesity research and interventions should therefore be a priority for the public health agenda.
Whilst it is agreed that the energy intake of overweight children exceeds their energy expenditure, less is known about the specific behaviours involved. Discerning which particular type 2 behavioural tendencies are implicated presents a challenge to researchers. One useful line of enquiry emerging in the literature is the focus on specific appetitive behaviours and their associations with overweight and obesity(Reference Wardle10, Reference Carnell and Wardle11). If certain eating styles are consistently associated with childhood obesity in community samples, interventions could be designed to diminish their problematic impact upon weight status.
A number of standardised psychometric tools are available to assess children's eating styles which include the Dutch Eating Behaviour Questionnaire(Reference Braet and van Strien12), the Children's Eating Behaviour Inventory(Reference Archer, Rosenbaum and Streiner13) and the Child Eating Behaviour Questionnaire (CEBQ)(Reference Wardle, Guthrie, Sanderson and Rapoport14). We chose to translate the CEBQ for use in this study because it contained the most comprehensive coverage of different eating styles, and has been shown to be valid and reliable(Reference Wardle, Guthrie, Sanderson and Rapoport14). Adapting this questionnaire provided support for the use of the CEBQ in Portuguese samples and made it possible to examine the link between eating style and obesity in a new paediatric sample.
The CEBQ is designed to assess eight aspects of children's appetite. Satiety responsiveness (SR) reflects a more sensitive response to internal satiety cues, and thus a more efficient monitoring of energy intake that protects against over-consumption. There is some evidence that trait sensitivity for eating behaviours such as SR are heritable, as demonstrated by research with a twin sample that found a strong genetic component with regards to energy intake, meal size and meal frequency(Reference de Castro15). Equally, SR appears to be age-related, with younger children being more efficient at adjusting their food intake to compensate for food pre-loads than older children(Reference Carnell and Wardle11). Convergent evidence supporting both of these findings has been demonstrated longitudinally with the CEBQ. This research signals individual continuity of eating behaviours over time, as well as a pattern of diminished scores on satiety related behaviours at age eleven compared to age four(Reference Ashcroft, Semmler, Carnell, van Jaarsveld and Wardle16). The sub-scales Enjoyment of food (EF) and Food responsiveness (FR) represent a heightened interest in food and a more pronounced responsiveness to environmental food cues. In general, these behaviours become more apparent as children get older and more autonomous about feeding(Reference Wardle, Guthrie, Sanderson and Rapoport14), although there is still high variability in these traits at each age. Work by Jansen and colleagues(Reference Jansen, Theunissen and Slechten17) for example, found that overweight children did not adjust their food intake after a pre-load or after prolonged smelling of palatable foods, whereas these conditions reduced appetitive responses in normal-weight children. In contrast, the sub-scales Slowness in eating (SE) and Food fussiness (FF), thought to reflect a lack of enjoyment and interest in food, have been associated with underweight, at least as assessed through parental interviews(Reference Douglas and Bryon18).
Emotional over-eating (EOE) and Emotional under-eating (EUE) represent emotionally reactive eating behaviours that would theoretically have opposing weight outcomes. Parental feeding styles characterised by restriction of palatable foods, and pressure to eat ‘healthy’ food have been linked to EOE in the form of disinhibited and externally cued eating that overrides internal satiety mechanisms in young girls(Reference Birch, Fisher and Davison19, Reference Carper, Fisher and Birch20). There is also evidence that differential responses to stress in children may interact with restraint, resulting in either EOE or EUE. In a small experimental study, Roemmich and colleagues(Reference Roemmich, Wright and Epstein21) observed that ‘high reactive, high restraint’ children ate more snacks due to ‘stress induced disinhibition of restriction’ compared to ‘low reactive, low restraint’ children, and control conditions.
This study examined the association between CEBQ scores and BMI in a sample of Portuguese children. We hypothesised that overweight and obesity would be positively associated with the CEBQ sub-scales associated with approach towards food (FR, EF and EOE) and negatively associated with the sub-scales associated with satiety (SR, FF, SE and EUE). Age, gender and socioeconomic status (SES) were controlled for in the analyses.
Methods
Participants
A convenience sample of 240 children, 123 girls and 117 boys aged 3–13 years (mean 7·9 (sd 2·6) years) participated in the study. Participant characteristics are shown in Table 1. Children within the appropriate age range were recruited locally from a school and from a paediatric service for children presenting with either obesity or minor learning problems, in the absence of physical or mental disability. Children with a history of psychological or physical problems were excluded from the study. The CEBQ was sent to mothers of the selected children via school teachers and health professionals, with a return rate of 95 %. Children's heights and weights were measured at the school or clinic.
Demographic and anthropometric characteristics of the sample (n 240)

Measures
The CEBQ(Reference Wardle, Guthrie, Sanderson and Rapoport14) is a thirty-five-item parent-rated questionnaire designed to measure the eating styles of children using five-point Likert frequency scales (1 = never to 5 = always). Individual CEBQ items were theoretically derived from research into the behavioural causes of obesity, and from parental interviews. Principal components analyses in the standardisation samples revealed an underlying eight-factor structure, with 58–84 % of the variance explained across all sub-scales. The eight dimensions include SR, SE, FF, FR, EF, Desire to Drink, EOE and EUE. The CEBQ items showed good internal reliability with Cronbach's α ranging between 0·72 to 0·91, and adequate test–retest reliability (r 0·52–0·87). Carnell and Wardle(Reference Carnell and Wardle11) recently modelled the association of three CEBQ sub-scales with widely accepted behavioural tests of trait responsiveness to internal satiety and external food cues. The behavioural measures explained 33–56 % of the variance in the CEBQ sub-scales, providing validation that the CEBQ captures elements of child eating behaviour pertinent to obesity research, without the resource-intensive requirements of direct experimental and observational methods. For the purposes of this study, items from the English version were translated into Portuguese.
We assessed maternal educational level and SES (see Table 1). SES was defined by maternal occupation using an item taken from the Graffar index(Reference Graffar22). This tool classifies occupations according to their associated economic reward, and places them on a scale between I and V. A score of I reflects the highest SES occupation (e.g. consultant doctors), and V represents the lowest (e.g. domestic workers; those on government benefits).
Children's heights and weights were measured to calculate BMI (kg/m2). For analysis purposes we converted BMI to BMI z-scores in accordance with American Centers for Disease Control reference data(23) adjusted for age and sex, and into the following four groups according to their position on the Centre for Disease Control BMI distribution: ‘underweight’ ( < 5th centile), ‘normal weight’ ( ≥ 5th to ≤ 85th centile), ‘overweight’ (>85th to ≤ 95th centile) and ‘obese’ (>95th centile).
Factor structure and internal reliability of the Portuguese Children's Eating Behaviour Questionnaire
In order to verify the underlying structure of the Portuguese translation of the questionnaire and ascertain whether it was similar to the original scale, we conducted a principal components analysis using all thirty-five CEBQ items. The resultant six-factor model explained 60·5 % of variance in CEBQ responses. Homogeneity and reliability analyses indicated that the six factors explained 47–76 % of the variance, with Cronbach's α between 0·70 and 0·89 (see Appendix). Overall, the structure and internal reliability of the final model, and the correlations between sub-scales, corresponded very closely to the original CEBQ, which confirms the suitability of using this questionnaire in our sample. Seven sub-scales were treated as separate outcomes in the statistical analyses, in agreement with the work of Wardle and colleagues(Reference Wardle, Guthrie, Sanderson and Rapoport14).
We ran a series of hierarchical regressions to analyse the relationships between scores on CEBQ sub-scales and children's BMI z-scores controlling for age, gender and SES effects. We then aggregated BMI into four weight categories (underweight, normal weight, overweight and obese) and plotted mean scores on CEBQ sub-scales for each category to visually demonstrate differences between BMI groups.
Results
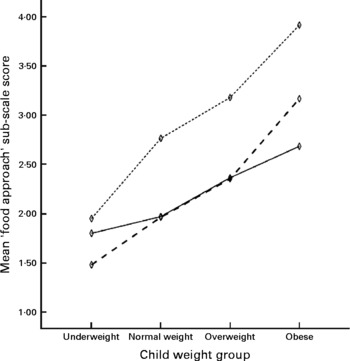
BMI z-scores were regressed onto scores for each CEBQ sub-scale separately, controlling for gender, age and SES (see Table 2). As predicted, there were highly significant positive associations between all ‘food approach’ CEBQ sub-scales and BMI z-score, with FR and EF accounting for 25 % of the variance in BMI z-score, and EOE 10 % (P < 0·001). Significant negative associations with BMI z-score were also observed for all ‘food avoidant’ sub-scales, with SE and SR emerging as the most significant, explaining 19 % and 15 % of the variance in BMI z-score respectively (P < 0·001). EUE and FF were less strongly associated with BMI z-scores, although they were significant in the models (P = 0·009 and P = 0·03, respectively). Linearity tests indicated that between 72 % and 86 % of the explained variance in BMI z-score was accounted for by the linear component for five out of seven sub-scales. A lower proportion was linear for EUE (50 %) and FF (28 %). Further examination of these sub-scales indicated that the linear model was the best fit, but with a weaker association with BMI z-score compared to the other sub-scales.
Hierarchical linear regression analyses for Centers for Disease Control BMI z-scores on Children's Eating Behaviour Questionnaire (CEBQ) sub-scales

* Gender, SES and age were forced into the models before adding CEBQ sub-scales. Standardised β coefficients were − 0·077, − 0·090, 0·128, P = 0·24, 0·19 and 0·06 for the control variables respectively.
The patterning of mean ‘food approach’ scores by weight group, when BMI was collapsed into four weight categories, is illustrated in Fig. 1. Mean ‘food avoidant’ scale scores by weight group are shown in Fig. 2.
Mean ‘food approach’ scores by centers for Disease Control BMI category. Children's Eating Behaviour Questionnaire sub-scales:  , food responsiveness;
 , emotional overeating;
 , enjoyment of food.
Mean ‘food avoidant’ scores by Centers for Disease Control BMI category. Children's Eating Behaviour Questionnaire sub-scales:, satiety responsiveness;, slowness in eating;, emotional undereating; , food fussiness.

Discussion
This study tested the hypothesis that overweight and obese children would exhibit weaker satiety responses and stronger appetitive responses to food compared with normal-weight children as indicated by scores on the CEBQ. The results gave strong support to this prediction in a mixed community and clinical sample of Portuguese children.
A significant inverse relationship between SR and BMI z-score was observed, supporting the idea that a weaker SR to ingested food makes children less able to regulate their food consumption, and thereby increases the risk of excessive weight gain. SE items clustered with SR items in our factor analysis, as they did in the earlier study of the CEBQ(Reference Wardle, Guthrie, Sanderson and Rapoport14), and this trait was also negatively associated with BMI z-score. FF was negatively associated with BMI z-score, with leaner children being rated as fussier and as rejecting novel foods. Existing research using this construct has had mixed results, with some animal studies indicating the reverse relationship explained by over-consumption when palatable foods become available(Reference Schachter24). However, studies of clinical samples(Reference Carruth, Skinner, Houck, Moran, Coletta and Ott25–Reference Wudy, Hagemann and Dempfle27) indicate that fussy children generally eat less and more slowly, which accords with the present findings. EUE was lowest in children with higher BMI z-scores whereas EOE was positively related to BMI z-score. These directional effects are theoretically supported by the work of Braet and van Strien(Reference Braet and van Strien12) who argue that emotional stress may lead to the inhibition of appetite in non-obese individuals, whilst acting as an appetite stimulant for individuals at risk of developing obesity.
The CEBQ sub-scales which reflect positive appetitive responses to food tended to show positive associations with BMI. FR was higher in children with the highest BMI z-scores, resembling findings with the externality scales of the Dutch Eating Behaviour Questionnaire(Reference Braet and van Strien12) and items in the Three-Factor Eating Questionnaire(Reference Stunkard and Messick28). This supports the theory that those at risk of developing obesity may exhibit heightened responses to external food cues. Our results also indicate a positive relationship between EF and BMI z-scores which replicates previous findings(Reference Wardle, Guthrie, Sanderson and Rapoport14). FR items clustered with items measuring EF in our factor analysis, which is logical as both groups of items cover elements relating to interest in food.
Older children tended to have lower scores on FF and SE. Although the current paper reports only cross-sectional data, longitudinal research suggests attenuation of ‘food avoidant’ behaviours is age-related and is likely to reflect movement through developmental milestones(Reference Ashcroft, Semmler, Carnell, van Jaarsveld and Wardle16). Longitudinal study designs represent an opportunity to unpack the trajectory of eating-style development and the interactions between phenotype and environment in young children.
One limitation to the application of results from this study is the non-probabilistic sampling method. A key concern was to recruit a sufficient number of participants for a factor analysis, and although we succeeded in doing so, the sample cannot be considered representative of Portuguese children and the findings need to be repeated in other samples. A second consideration is that we did not track the children's BMI over time, and thus cannot conclude whether CEBQ eating styles were a cause or consequence of weight status. Further longitudinal designs will be a valuable addition to the evidence base on the role of eating behaviours in the aetiology of obesity.
Conclusion
The importance of the eating style concept lies in its contribution to understanding the behavioural pathways to obesity. Our results suggest that the CEBQ is a valuable tool for identifying specific eating styles that may be implicated in the development of obesity in children. Use of the CEBQ in future research might further aid our understanding of inherited behavioural phenotypes, and guide health education initiatives(Reference Viana, Guimarães, Teixeira and Barbosa29). Behavioural interventions to mitigate the impact of these behaviours in higher- risk families might be an important approach to obesity prevention.
Acknowledgements
There are no known conflicts of interest to be acknowledged with regards to this article, and no extra sources of funding were required to carry out the research. V. V. was responsible for the conception and design of the study, S. S. was responsible for data collection and J. S. drafted the article. All authors contributed to the interpretation of results. All authors approved the final version for publication.
Appendix
Factor structure and internal reliability of the Children's Eating Behaviour Questionnaire (CEBQ) items

Factor loadings of principal components analysis of all Children's Eating Behaviour Questionnaire (CEBQ) items

* Removal of low loading items marginally improved the internal reliability of factor 3/FF from 0.73 to 0.80, but was unchanged for EF/FR. Cronbach's α for FF was still within acceptable limits when all items were included. Both low loading items were considered to have high face validity and were retained in the final model to preserve the original structure of the CEBQ.
Pearson's correlations between Children's Eating Behaviour Questionnaire (CEBQ) sub-scales (n 249)

*P < 0·05,
**P < 0·001 (two-tailded).



