Google Books Ngrams is a novel and ripe data source for political science. However, scholars have not engaged with Ngrams to the extent possible, given its richness. This article describes Ngrams, discusses its benefits and drawbacks, outlines previous uses, and tests two motivating examples of our own. The primary purpose of this article is to give scholars a roadmap for future research using Google Books Ngrams data in political science.
This article describes Ngrams, discusses its benefits and drawbacks, outlines previous uses, and tests two motivating examples of our own. The primary purpose of this article is to give scholars a roadmap for future research using Google Books Ngrams data in political science.
Ngrams are best thought of as a type of content analysis in which scholars can track the usage of terms in books in several languages across centuries. In many ways, using this data source is similar to tracking word usage in newspapers such as The New York Times. The advantages compared to newspapers are that the length of time is much longer, it is free, and data are extremely easy to collect and use. Additionally, books contain a different, novel sample of texts and may represent a different set of priorities than newspaper coverage. There are two main ways to use these data: (1) track changes in word usage in discourse over time, and (2) use Ngrams as a proxy variable for some underlying latent variable that may be difficult to measure. As with any research using a sample and specific search terms, there is an error component that cautions any conclusions drawn, which is discussed in depth herein.
Our first validity test comes from comparative politics. We created a cross-sectional time series (XSTS) model to show how usage of the phrase “political corruption” in Italian-, French-, German-, and Hebrew-language books strongly correlates (r=0.86) with Transparency International’s well-cited Corruption Index for Italy, France, Germany, and Israel, respectively. The second test, from American politics, uses Ngrams to show how the explosive growth in usage of the phrases “Asian American,” “Latino,” and “Hispanic” in American books strongly correlates with real-world changes in these populations after the Immigration and Nationality Act of 1965. These phrases were virtually nonexistent in American books before this law greatly expanded immigration from these groups. The correlation is more than 90%, and Ngrams data are virtually identical to census data for changes in the Asian American and Hispanic populations. The success of our validity tests shows that Ngrams data can function as proxy for novel, difficult-to-measure variables.
GOOGLE BOOKS NGRAMS: THE BASICS
An “Ngram” is a string used for automated data retrieval (Brown et al. Reference Brown, Della Pietra, deSouza, Lai and Mercer1992; Cavnar and Trenkle Reference Cavnar and Trenkle1994). A uni-gram consists of one word, bi-grams are two words, and tri-grams are three-word phrases.Footnote 1 Google’s Ngram strings are words and phrases from its digitized catalog, which is equal to roughly 15% of all books ever published (Michel et al. Reference Michel2011). Using Ngrams for research can be considered an extension of coding the running record, such as The New York Times and other notable newspapers. However, before Ngrams, there was no systematic way to measure the running record in books. To generate the dataset available for analysis, Michel et al. created a lexicon of about 361 billion words and phrases (Lin et al. Reference Lin, Michel, Lieberman, Orwant, Brockman and Petrov2012; Michel et al. Reference Michel2011).
An “Ngram” is a string used for automated data retrieval (Brown et al. Reference Brown, Della Pietra, deSouza, Lai and Mercer1992; Cavnar and Trenkle Reference Cavnar and Trenkle1994). A uni-gram consists of one word, bi-grams are two words, and tri-grams are three-word phrases.Footnote 1 Google’s Ngram strings are words and phrases from its digitized catalog, which is equal to roughly 15% of all books ever published (Michel et al. Reference Michel2011).
How to Obtain and Analyze Ngram Data
Researchers using Ngram data have two options for testing hypotheses. The first method is to use the native Google Ngram Viewer as a descriptive tool.Footnote 2 The default Ngram Viewer gives researchers a quick, easily readable graph measuring their Ngram of interest. To obtain the data for numerical operationalization, one simply hovers over the lines with the cursor to gather the Ngram density measure by year.
Figure 1 provides an example. Imagine a researcher has a hypothesis about the importance of “slavery” versus “states’ rights” in the prelude to the American Civil War. Using Ngrams as shown in figure 1, the usage of “slavery” in American English publications rapidly increased as war neared in the 1860s but usage of the phrase “states’ rights” did not. This comports with evidence that slavery was the main issue discussed by political elites, not states’ rights.
Google Ngram Viewer: Slavery and States’ Rights (Case Insensitive)
Note: Available at https://bit.ly/2HqYKk1. Accessed on April 25, 2018.

A second method for analysis is to use the raw Ngram data, which are freely available via download.Footnote 3 The Ngram web page explains the iterations of data availableFootnote 4 and has several hundred links from which raw data may be downloaded in eight languages.Footnote 5 The latest available files were compiled in 2012 (Orwant Reference Orwant2012). The data are downloaded as a compressed tab-separated file. The files for version 2 contain columns noting the specific Ngram in question, the year, the number of times the Ngram was used overall, and the number of distinct publications in which the Ngram was used. Version 1 contains all of the same information as well as the number of pages where the phrase occurred.
Regardless of the method, successful use of these data requires that researchers use well-considered, precise words or phrases (King, Lam, and Roberts Reference King, Lam and Roberts2017). Ngrams are valid and reliable to the extent that search-term queries are accurate for the variable concept and timeframe in question. Basically, if researchers use the proper key word and account for its meaning temporally, Ngrams will produce a valid and reliable measure. When using the Ngram Viewer, this requirement is obvious but when using the downloaded corpus, precision is even more crucial. This is because, as a practical matter, downloading the entire corpus for a given language may be time and technologically prohibitive. The files are massive, and researchers ultimately would have to choose their Ngrams in any event; therefore, that decision should be made upfront. Thus, unless the research question or empirical objective requires the entire corpus of an available language, the most efficient strategy is to download only the Ngram set necessary for the empirical investigation—or simply to use the Ngram Viewer and measure the Ngram variable by year.
Potential Concerns with Ngram Data
Using Ngrams without their contextual information or acknowledging pertinent social conditions for their use is problematic. For instance, scholars should always remember that published books represent the perspectives of scholarly agendas, elite discourse, and popular concerns and tastes for their published era. Researchers must acknowledge this and construct their Ngram queries accordingly to ensure valid and reliable data generation. For the purposes of social science, situating the use of Google Ngrams within a solid theory accounting for the contextual effects is vital and should be the first consideration for any scholar before using these data.
There are two chief concerns that any researcher should be aware of when using these data. First, as noted previously, it is crucial that researchers consider all possible case and part-of-speechFootnote 6 aspects of their Ngram. For instance, the bi-gram “climate change” generates the Viewer in figure 2a. This is a case-sensitive search so the graph represents only the percentage of usage in American English generated by “climate change” as a lower-case bi-gram. Figure 2b displays the case-insensitive search results. Although the general trend is similar over time, the various capitalization issues denote differing densities of usage. Assuming there is no theoretical expectation about case sensitivity, researchers should use the case-insensitive search function to create an additive measure. However, if they choose to download raw data, they should take care to gather all relevant iterations of their Ngram to avoid data loss or bias.
Google Ngram Viewer for Iterations of “Climate Change”
Note: Available at https://books.google.com/ngrams. Accessed on March 23, 2018.

The second concern is that these data are generated from a mere sample of published books. The nature of the sample is explained in detail by Michel et al. (Reference Michel2011) and Lin et al. (Reference Lin, Michel, Lieberman, Orwant, Brockman and Petrov2012) and is a main critique in Koplenig (Reference Koplenig2017); Ophir (Reference Ophir2010); and Pechenick, Danforth, and Dodds (Reference Pechenick, Danforth and Dodds2015). Pechenick, Danforth, and Dodds (Reference Pechenick, Danforth and Dodds2015), specifically, noted that the part-of-speech tags and other qualifiers can impact the results that researchers obtain in important ways; therefore, the theoretical underpinning of search terms is a paramount consideration. Similarly, Koplenig (Reference Koplenig2017) argued that without the accompanying metadata (i.e., contextual information), Google Ngrams is no better than junk information making researchers feel better because they have data at their disposal.
With Ngrams, context is crucial: consider how the market for books changed as literacy spread. If scholars compare word usage across centuries, context will be an issue to consider in formulating search queries. Because book authors in the 1800s and earlier were often from elite backgrounds and books were sold to the literate class, books from that era probably cover scholarly agendas and elite discourse more than popular concerns or tastes. As mass literacy spread, popular concerns and tastes became more prevalent in books. In summary, situating the search term in its historical and linguistic context is crucial for obtaining accurate Ngram data. Provided that researchers understand this fact and account for it in their analyses, there is no reason that this becomes a critical failure for the data.Footnote 7
PREVIOUS USES OF NGRAMS IN ACADEMIC LITERATURE
Google Ngrams hold great promise for scholars in a variety of fields. Historians and cultural scholars see this resource as a tool for efficiency and scope (Manovich Reference Manovich and Gold2012; Ophir Reference Ophir2010). Using Google Ngrams, scholars have shown how functional differentiation evolved in modern society (Roth Reference Roth2014), how cultural change evolved in China (Zeng and Greenfield Reference Zeng and Greenfield2015), and how increased urbanization changes how language is used in the United Kingdom (Greenfield Reference Greenfield2013). Furthermore, some scholars use Google Ngrams to measure the effect of their field and theories as compared to other fields in the academy (Chen and Yan Reference Chen and Yan2016).
For political science, Google Ngrams is still a nascent tool in the published literature. Shea and Sproveri (Reference Shea and Sproveri2012) showed how the debate about “nasty” politics in the United States is not, in fact, a new discussion. Additionally, Hassanpour (Reference Hassanpour2013), using arguments from normative theories about political speech, made the case for understanding the changes in political semantics in several political contexts through Google Ngrams. Finally, Bentley et al. (Reference Bentley, Garnett, O’Brien and Brock2012) showed how changes in the use of language around climate-change–related information can become more diffused in society, which should make people more aware of understanding this important political issue. Crucially, despite previous usage in the field, we do not yet have—but require—a validity test for Google Ngrams to test a wider applicability beyond descriptive use.
VALIDITY TESTS USING TWO EXAMPLES
To assess the validity of Ngram data for political science research, we used motivating examples from comparative and American politics.
Correlation with Corruption
Our first example shows how comparativists might use these data in a multi-country study. We examined political corruption because it is both endemic to politics and an important topic within the field of comparative politics (Golden and Picci Reference Golden and Picci2005; e.g., Lancaster and Montinola Reference Lancaster and Montinola1997). Usage of the phrase “political corruption,” theoretically, should correlate with actual corruption because the salience of a given issue would be communicated through books about politics. If Ngrams correlates with established measures of corruption, we know that Ngrams reliably correlates with a central topic for scholars of comparative politics.
As a test case for Ngrams on real-world politics, we hypothesized that usage of the phrase “political corruption” in published books in French, Italian, German, and Hebrew will have a strong correlation with Transparency International’s Corruption Perceptions IndexFootnote 8 for France, Italy, Germany, and Israel. We chose these test languages because—when compared to English or Spanish, for instance—they have publishing industries localized primarily in one country, with perhaps French as an exception. Also, other languages in Ngrams (e.g., Chinese) do not have a free press, which limits open discussion of political corruption.
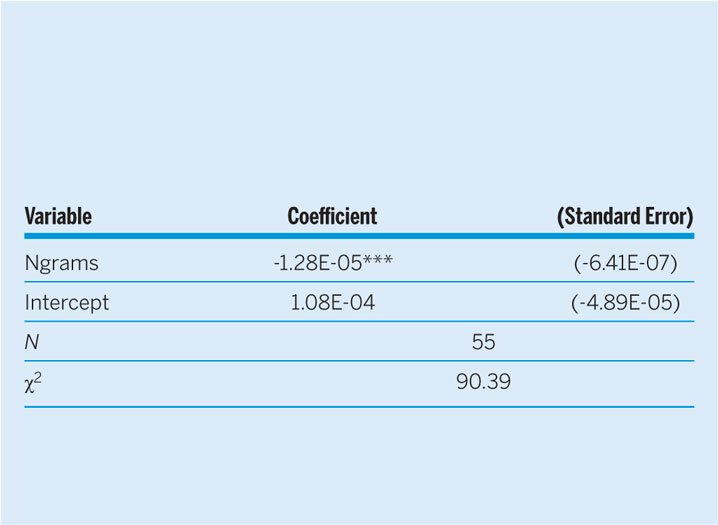
To test our hypothesis, we examined all uses in French-, Italian-, German-, and Hebrew-language books from 1995 to 2008 for political corruption in these languages.Footnote 9 The dependent variable is the Corruption Index for France, Italy, Germany, and Israel. The year 1995 is the beginning of the Corruption Index data and 2008 is the end of the Ngrams data; therefore, those were all possible years to test our hypothesis. We used the XSTS model shown in table 1 with these longitudinal data, which are by country, by year. The Corruption Index is coded on a scale of 0 to 100, with more corruption having a lower value. As such, we expected the statistical relationship to be negative.
XSTS “Political Corruption” Ngram on Transparency International’s Corruption Perceptions Index

Note: Cells represent unstandardized coefficients and standard errors for a cross-sectional times-series regression model for political corruption Ngrams and Transparency International Corruption Perceptions Index. Two-tailed significance test where *p<0.05, **p<0.01, ***p<0.001.
Note that the model is statistically significant with a p-value of less than 0.000. Interpreting these results, we see that around 87% of the variation in the Corruption Index is captured by the Ngrams, suggesting that Ngrams is a valid proxy measure of the Corruption Index (see online appendix table 3 for the pairwise correlations). This result shows how Ngrams reflects real-world events based on language in published books.
CORRELATION WITH ASIAN AMERICAN AND HISPANIC CENSUS DATA
Turning to American politics, we examined race and ethnicity using Google Ngrams. Racial categories are socially constructed, not a function of biology and genetics (Smedley and Smedley Reference Smedley and Smedley2005). As such, racial and ethnic groupings change over time due to societal influences, including social-scientific and demographic classification systems and legal definitions for racial and ethnic groups (Ferrante and Brown, Jr. Reference Ferrante and Brown2001).
We examined how the changes in the immigration system may have resulted in the social construction of new pan-ethnic racial identifiers: “Asian American” and wide-scale usage of the pan-ethnic identifiers “Hispanic” and “Latino.” Asian Americans and Hispanics have constantly immigrated to the United States since its founding and in mass numbers since the 1850s. Yet, throughout this entire history, the people we now refer to as “Asian Americans” and “Hispanics” were mostly considered as part of distinct ethnic groups based on nationality. Our hypothesis is that because the Immigration and Naturalization Act of 1965 led to a significant increase in immigration from East Asian and Latin American countries, it will correlate with expanded usage of a social construction of pan-ethnic racial and ethnic labels to categorize these new immigrants.
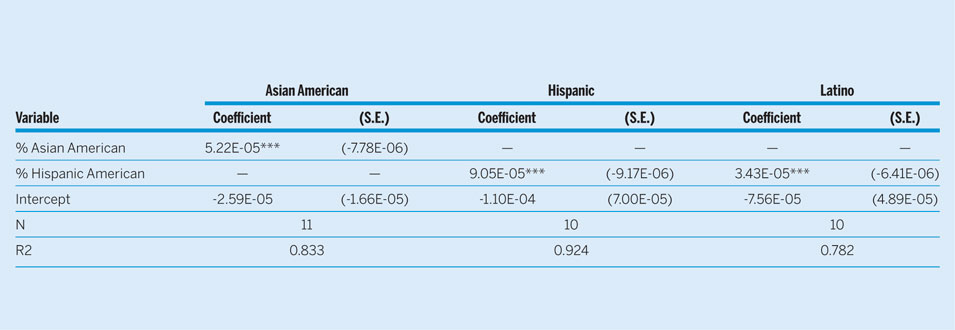
To test this relationship, table 2 shows an ordinary least squares regression model for “Asian American,” “Hispanic,” and “Latino” Ngrams and decennial census data for percentages of Asian Americans, Hispanics, and Latinos in the United States since 1900. For example, usage ranges from almost no usage of “Asian American” in 1960 at less than 0.0000001% of all English words used in American books to a 0.000240% increase in 2000. That is, the results show a 240,000-times increase in usage from immediately after the bill passed until its peak in 2000. This phrase ranges from literally unused for decades to explosive growth after 1965. Although not dispositive, we believe that this is evidence that the large increase in immigration changed how these people were described in published books. More important, the R2 for these models is very high, between 78% and 92% of the variation (see online appendix tables 4 and 5 for the pairwise correlations). This shows that Ngrams is a valuable proxy variable that adequately describes population changes for these groups.
OLS Regression of Population Percentage on Ngram Density

Note: Cells represent unstandardized coefficients (in scientific notation) and standard errors for an ordinary least squares regression model for “Asian American,” “Hispanic,” and “Latino” Ngrams and decennial census data for percentages of Asian Americans and Hispanics in the United States since 1900. Two-tailed significance test where *p<0.05, **p<0.01, ***p<0.001.
CONCLUSION
As we enter the world of “big data,” our costs to find or generate data are rapidly decreasing while our capacity to use the data we obtain is exponentially increasing. Importantly, data long considered to be unquantifiable are increasingly available and useable in a large-scale way. Google Ngrams is one tool that makes the previously unmeasurable measurable. As we show in examples from comparative and American politics, Ngrams has both face and construct validity and is reliable for hypothesis testing and describing changes in politics. This suggests that scholars can use these freely available data to explore variables for which there may not be readily available data or as a way to measure change in elite disclosure.
As we enter the world of “big data,” our costs to find or generate data are rapidly decreasing while our capacity to use the data we obtain is exponentially increasing.
An important question to consider is: What types of questions can Ngrams help political scientists answer that could be otherwise unanswerable due to data limitations? Beyond being a descriptive tool (see the “states’ rights” versus “slavery” example) or as a proxy (see the validity tests), Ngrams may help scholars identify or examine emerging or understudied concepts or populations. For instance, surveys are only recently measuring gender identity in a way that will give scholars estimates for the transgender population. Ngrams is a novel tool that can provide longitudinal data for understanding perceptions of this population and give scholars a timeframe for the emergence of this identity as a subject in published books. Using Ngrams as a starting point, scholars then can use other research techniques to fill in gaps about the attitudes, lives, and realities of this and other understudied populations.
Of course, there are limitations. One is that the last round of book digitization ended in 2011. However, now that the courts have cleared the way (The Authors Guild v. Google, Inc. 2016), Google may begin again. Although further validity tests may be warranted with Ngrams, we now know with careful theory building, specific empirical hypotheses, and savvy use of the Google Books Ngram datasets, scholars have an excellent resource to measure political phenomena in an often-neglected medium: published books.
SUPPLEMENTARY MATERIAL
To view supplementary material for this article, please visit https://doi.org/10.1017/S1049096519001318
ACKNOWLEDGMENTS
We thank the anonymous reviewers for their constructive feedback and support for this article. Authorship is listed alphabetically, indicating equal authorship.