Representative democracies must necessarily group constituents into voting districts by partitioning larger geographical territories. Gerrymandering is the act of purposely constructing voting districts which favor a particular electoral outcome. In the United States, the power to draw district lines within a state belongs to the state legislature or districting commission. Thus, self-interested politicians with this authority could gerrymander—manipulate the district lines of their territory—to maximize the electoral outcome for their own party. Gerrymandering for political gain is morally questionable as it reduces the power of the electorate, and this practice is not restricted to any political party or country. Indeed, the Supreme Court of the Untied States has recently heard two gerrymandering cases, the first Whitford v. Gill (2018) concerned the 2011 redistricting plan for Wisconsin due to Republican legislators, and the second Benisek v. Lamone (2018) was regarding changes made to the boundaries of Maryland’s sixth district by the Democratic Party. Furthermore, in principle, there are instances in which elaborate redistricting could be applied with benevolent intent, such as ensuring the proper representation of minority groups (based on ethnicity, religion, or other identifiers) which are not spatially localized. Such majority-minority districts have also been the focus of Supreme Court hearings, for example Shaw v. Reno (1993) and Miller v. Johnson (1995).
Political gerrymanderers aim to maximize the number of districts in which constituents of an opposing party will lose the majority vote, thereby minimizing the opponent’s political influence. However, districts are commonly required to conform to certain general requirements:
• Connectedness: Each district must comprise a single, connected region.
• Uniformity: All districts in a territory must have approximately equal populations.
• Shape: Districts should be generally compact, but legal stipulation is limited.
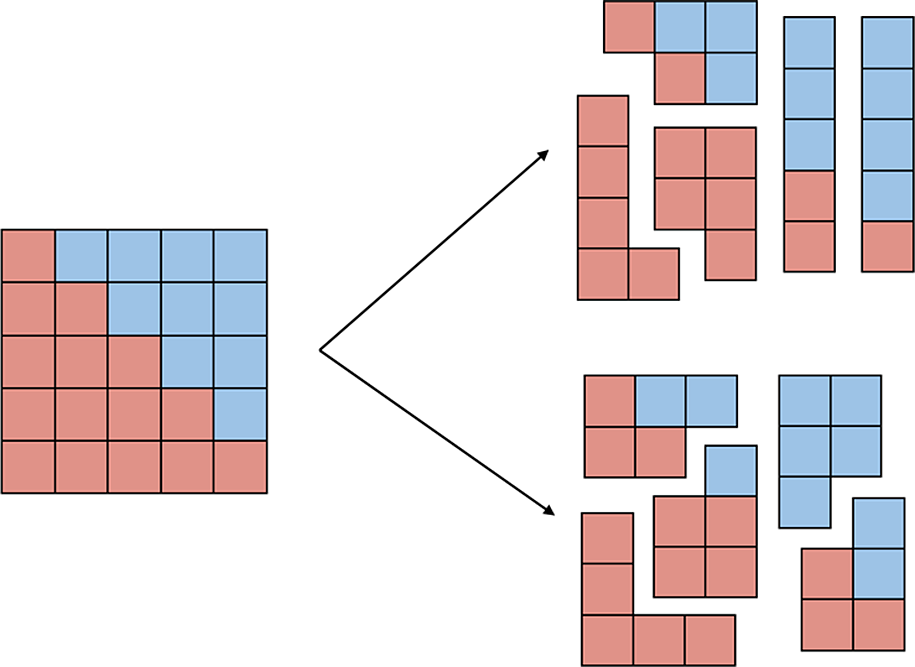
Despite these requirements, clever redistricting can have significant consequences. Consider an election involving two parties, which we label red and blue, and a territory which can be modeled as a 5  $\times $ 5 grid. Each of the 25-unit squares denotes a territorial unit, and its color represents the overall party affiliation of its voters. For the purpose of this simple example, we will assume a uniform population (thus each unit has equal voting weight) and a voter preference such that 60% (40%) of the units favor red (blue).
Given the split in voter preference, an impartial districting into five districts should be expected to yield three red-majority districts and two blue-majority districts. However, as shown in Figure1, it is possible for the blue party to gerrymander the territory so that it wins three out of the five districts, thereby winning a majority of districts. Conversely, the red party can construct four red-majority districts instead of three. Thus, an entity with the power to set the district lines can potentially arrange for whatever result it desires if unconstrained by other considerations. This illustrates a simple but powerful gerrymandering strategy in which opposition voters are “packed” into districts in a manner which wastes opposition votes.
Sample 5 $\times $5 territory with two different district allocations.

The main pursuit of this work is to construct algorithms which take a distribution of voters on a lattice and returns a set number of gerrymandered, equal-population, connected (or mostly connected) districts. Lattice studies of redistricting can clearly provide a great deal of insight, and thus we use our model to quantify some general statements concerning gerrymandering. In particular, we use our lattice population models to compare gerrymandered districts to geometrically constructed “fair” districts and examine how this changes the net vote in each district and the overall election result, in order to quantify to what extent gerrymandering is advantageous to the proponent party. Moreover, by applying common measures of gerrymandering to the districts generated via our algorithm, we are able to provide a quantitative assessment of whether these measures can detect and potentially constrain gerrymandering.
An influential paper of Friedman and Holden (Reference Friedman and Holden2008) systematically explored algorithmic approaches of “packing” and “cracking” voters into districts, arriving at the mantra “sometimes pack, but never crack,” and propose a novel packing procedure for strategically gerrymandering a territory. Despite providing a number of excellent insights, the gerrymandering algorithm proposed in Friedman and Holden (Reference Friedman and Holden2008) entirely neglects the spatial distribution of voters and thus generally leads to highly disconnected voting districts. In the present paper, we develop a lattice model which encodes population distributions and voter preferences. Using this lattice model, we study the spatial profile of the aggressive gerrymandering strategy outlined in Friedman and Holden (Reference Friedman and Holden2008) and shall show that it generally leads to highly disconnected districts.
Specifically, in this work, we study four strategies for gerrymandering. The first strategy is an implementation of the Friedman and Holden (Reference Friedman and Holden2008) method which references a lattice voter distribution. The latter three strategies are novel algorithmic approaches we propose here:
• Friedman–Holden (FH) packing (Section 2): Districts are formed from the most partisan voters from both parties, with a bias such that most districts favor the gerrymander’s party. The algorithm does not required the districts to be connected.
• Spatially Restricted Friedman–Holden (SRFH) packing (Section 3.1): The FH packing strategy is adapted to ensure almost all districts are connected.
• Saturation packing (Section 3.2): Opposition voters are packed into a small number of districts, skewing the partisan bias in the majority of districts.
• Genetic gerrymandering (Section 4): Starting from sets of random districts, we iteratively mutate these configurations to maximize some predefined fitness function. Choosing the fitness function appropriately yields both fair or gerrymandered sets of districts.
To some extent the algorithms developed here are driven by two competing goals
i) Maximising the number of districts won by the gerrymanders party;
ii) Aiming for connected (or mostly connected) districts.
Indeed, it is a common legal requirement that voting districts are a single connected region, however, as we show in Section 2, the approach of Friedman and Holden (Reference Friedman and Holden2008) leads to all districts being highly disconnected. In contradistinction, in the genetic gerrymandering algorithm, we develop here all districts are guaranteed to be connected, and in the Saturation and SRFH packing strategies, only the final district remains disconnected. In the latter case, the final district typically has only a small number of distinct pieces and connectivity can often be achieved through minor swaps between districts. Hence, providing a significant improvement on the algorithmic gerrymandering strategy of Friedman and Holden (Reference Friedman and Holden2008).
We note here that there is a sizeable body of literature focusing on minimizing, optimizing, and detecting gerrymandering. In particular, several groups have proposed methods to construct fair districts, which are population equal and non-partisan (for instance (Sherstyuk, Reference Sherstyuk1998; Altman and McDonald, Reference Altman and McDonald2011; Puppe and Tasnadi, Reference Puppe and Tasnadi2015)), or which favor a particular outcome (see e.g., (Sherstyuk, Reference Sherstyuk1998; Friedman and Holden, Reference Friedman and Holden2008; Puppe and Tasnadi, Reference Puppe and Tasnadi2009; Apollonioa et al., Reference Apollonioa2009). Additionally, several studies have presented a range of geometric tests, such as voting district compactness and convexity, to detect gerrymandering, for example (Roeck, Reference Roeck1961; Schwartzberg, Reference Schwartzberg1966; Oxtoby, Reference Oxtoby1977; Young, Reference Young1988; Niemi et al., Reference Niemi, Groffman, Calucci and Hofeller1990; Polsby and Popper, Reference Polsby and Popper1991; Chambers and Miller, Reference Chambers and Miller2010; Hodge et al., Reference Hodge, Marshall and Patterson2010; Wang, Reference Wang2016; Duchin, Reference Duchin2018).
This work is structured as follows: In Section 1, we outline a new procedure for generating lattice models of population and voter distributions. In Section 2, we outline a specific model of aggressive gerrymandering, proposed by Friedman and Holden (Reference Friedman and Holden2008), and using our lattice models, we demonstrate that this leads to disjointed districts. In Section 3, we outline two packing algorithms, one of which is based on similar principles to Friedman and Holden’s approach, and both of which take into account spatial information regarding voters. Section 4 presents a further algorithmic gerrymandering strategy based on genetic algorithms, with the distinct advantage that it automatically outputs connected districts. In Section 5, we apply our codes to generate a number of gerrymandered territories, presenting both instructive examples and Monte Carlo studies which quantify the impacts of gerrymandering. Then, in Section 6, we apply our Genetic Gerrymandering algorithm to a voter distribution which models the rural-urban partisan slit observed in the United States. Finally, in Section 7, we give a summary of results, a discussion of their implications, and suggest potential directions for subsequent studies.Footnote 1
1 Modelling Voter Distributions on Lattices
A manner of generating large sets of quasi-random population and voter distributions can provide a flexible tool for studying the general features of population subdivisions and gerrymandering. Abstracting away from purely data-driven studies of voter distributions can allow both more general analyses and more specialized studies depending on how one implements the model. In this section, we outline an elegant manner of constructing models of a voter distribution. Specifically, we propose to study a population distribution which is modeled on a binomial distribution which approximates well a discretized Gaussian distribution with random fluctuations. Such a distribution is a good model for a city or town in the absence of natural boundaries. We then superimpose a spread of partisan bias on this population. While the notion of modeling voters via lattice distributions has been previously explored in applications of statistical physics to sociopolitical research for example (Chou and Li, Reference Chou and Li2006; Wall, Reference Wall2008; Castellano, Santo, and Vittorio Reference Castellano, Santo and Vittorio2009), to our knowledge, there are no previous studies which apply lattice techniques to assess the viability of specific gerrymandering strategies for a given voter distribution.
1.1 Lattice Models of Population Distributions
We first define the key concepts that will be used throughout this work, which concern modelling geographical regions with a population of voters, which we refer to as territories. In most representative democracies, it is common to split territories into small indivisible cells called territorial units (such as census units), with each unit containing a potion of voters. In this work, we model territories as lattices:
Definition 1 A territory S is a square lattice in  $\mathbb {Z}^2$, where each lattice site
 $(i,j)$ defines a territorial unit
 $T_{i,j}$ carrying a population value
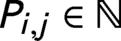 $P_{i,j}\in \mathbb {N}$ and a voter preference
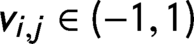 $v_{i,j}\in (-1,1)$. The total population of the territory is defined as
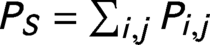 $P_{S}=\sum _{i,j} P_{i,j}$.
We shall call a population distribution on a territory S a set of fixed values for all  $P_{i,j}$ and call a “voter” (or “partisan”) distribution a set of fixed values for all
 $v_{i,j}$. We call S equipped with a population distribution a “population model” and S equipped with both a population and voter distribution will be referred to as a “voter model.”
Definition 2 Given a territory S, a district D is a finite union of territorial units, that is, $D=\cup _{(i,j)\in I} T_{i,j}$ for an index set I. The district population is defined as
 $P_D=\sum _{(i,j)\in I} P_{i,j}$.
In contrast to arbitrary graphs, lattice territories can be efficiently manipulated and are ideal for our analysis, since the distributions input to our algorithms and the districts output can all be represented as square matrices. Furthermore, the lattice structure provides intuitive notions of adjacency and connectedness between the territorial units:
Definition 3 Territorial units at  $T_{i,j}$ and
 $T_{k,l}$ are said to be adjacent if
 $i=k\pm 1$ and
 $j=l$, xor (exclusive or)
 $j=l\pm 1$ and
 $i=k$.
Definition 4 A territorial unit  $T_{i,j}$ is reachable from
 $T_{k,l}$ if there exists a sequence of adjacent territorial units beginning at
 $T_{i,j}$ and ending at
 $T_{k,l}$.
Given the above definitions of adjacent units and reachable units, we can express a simple notation of district connectedness:
Definition 5 A district D is connected if any  $T_{i,j}\in D$ is reachable for every
 $T_{k,l}\in D$.
Since we are interested in cases where the territory is partitioned into a set of equal population districts, we introduce the following definition:
Definition 6 A valid districting is a set of n disjoint districts  $\{D_i\}$ for
 $i\in \{1,2,…,n\}$ such that
 $S=\cup _{i\leq n} D_i$ and for fixed
 $t\in \mathbb {R}$ one has
 $-t\leq |D_i|-|D_j|\leq t$ for
 $i,j\in \{1,2,…,n\}$.
The quantity n denotes the total number of districts in S. We call t the population threshold, which allows for small variations in population between districts, while requiring approximately equal district populations. Throughout this work, we will take  $t \sim 0.01\times P_S/n$, such that differences between districts are percent-level.
Since it is of interest to consider population distributions which model real world situations, here we initiative a study in this direction by considering a quasi-Gaussian distribution of population much as would be appropriate in a large city in which the population is highly dense toward the center and becomes diffuse at large radial distances. To approximate a Gaussian population spread with random fluctuations, we implement a walker function (see e.g., Shiffman (Reference Shiffman2012)) on a 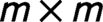 $m\times m$ lattice with
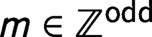 $m\in \mathbb {Z}^{\mathrm {odd}}$ with the central lattice site designated
 $(0, 0)$. The walker function is essentially a simple agent-based model (see e.g., Macal and North (Reference Macal and North2005)) which undergoes time step evolution. In this case, an agent is an object associated to a single lattice site at a given time step and the walker function is a set of probabilistic rules which determine how the spatial location of agents evolve between time steps. The agent represents an individual of the population and thus the probabilistic evolution of agents leads to random fluctuations in the population distribution. We will exploit these random fluctuations in the population distribution to implement Monte Carlo methods later in this work.
For a given territory S, one can construct a population model with total population  $P_S$ via the walker function, as detailed below. We take a
 $m\times m$ lattice and consider
 $P_S$ agents with the following starting distribution (at time step
 $t=0$)
 $$ \begin{align} P_{i,j}\big|_{t=0}= \left\lbrace \begin{array}{ll} P_S & \text{for}~(i,j)=(0,0) \\ 0 & \text{otherwise} \end{array} \right.\!\!\!\!\!\!. \end{align} $$
Thus, each integer unit of population is associated to an agent on the lattice and, prior to evolution via the walker function, the whole population of the territory is located at the central lattice site. For each time step, an agent moves with fixed probability to any lattice site adjacent to its current location with equal probability, with the restriction that agents remain within the  $m\times m$ lattice. Each agent is allocated a fixed number of moves, and move counts across all agents follow a normal distribution centered at the minimum number of moves needed to reach
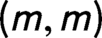 $(m,m)$ from
 $(0,0)$. Once an agent has used its prescribed moves, it remains in its terminal unit.
After all agents have taken their prescribed moves the walker function outputs the number of agents at each lattice site  $(i,j)$ and this is identified with the population
 $P_{i,j}$ of the territorial unit
 $T_{i,j}$. The walker function provides a value for
 $P_{i,j}$ for each
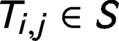 $T_{i,j}\in S$ and thus defines a population model (but not a voter model, since the
 $v_{i,j}$ remain undetermined at this stage). The population spread due to this algorithm well approximates a two-dimensional Gaussian distribution. The default output for population units
 $P_{i,j}$ along
 $j=0$ well approximates the Gaussian
 $P_{x,0}=P_{0,0}~\mbox {exp}[-x^2/2c^2]$ the width, controlled by c, can be varied in the code with the default value used herein being
 $c=3.3$.
1.2 Modelling Elections on the Lattice
With this lattice model of population distributions, we next implement a voting distribution within the population which shall lead to the premise of voting and electoral events.
Definition 7 The proponent (opponent) is the party which benefits (loses) from gerrymandering. A territorial unit  $T_{i,j}$ is a proponent unit if
 $v_{i,j}> 0$, an opponent unit if
 $v_{i,j} < 0$, or neutral if
 $v_{i,j} = 0$.
We let the proponent party correspond to positive extremity, that is  $v_{i,j}>0$, and designate this the “red” party, with the opponent the “blue” party. We assume all voters cast ballots, so
 $v_{i,j}>0$ corresponds to the average vote in territorial unit
 $T_{i,j}$ favoring the proponent. We also assume that the gerrymander knows the values
 $v_{i,j}$ with certainty, although this could be relaxed.
Definition 8 The net territory vote (or popular vote) of a territory S is the sum  $N_S:=\sum _{i,j} P_{i,j}v_{i,j}$. A territory is said to be balanced if
 $N_S\approx 0$. For a district
 $D=\cup _{(i,j)\in I} T_{i,j}$ in S, the district vote is
 $N_{D}=\sum _{(i,j)\in I} P_{i,j}v_{i,j}$ and the percentage district vote share is
 $X_D=100\times N_{D}/P_D$.
We say that the red party wins the popular vote in S if 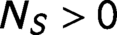 $N_S>0$; conversely, blue wins (red loses) the popular vote if
 $N_S<0$. However, rather than the popular vote of the whole territory, what is typically most important is the district-wise overall vote. Similar to the popular vote, for n districts, we say that red wins the district vote of district
 $D_k$ for
 $k\in \{1,2,…,n\}$ if
 $N_{D_k}>0$ and we say blue wins (red loses) the district vote if
 $N_{D_k}<0$.
The distinction between the district vote and the popular vote implies that a given party can lose the latter, while securing the most districts. Typically, the most important outcome is the number of districts won by each party. Thus, gerrymandering fundamentally exploits the differences between the local and global properties of distributions. Realistic numbers of districts n in a given territory range from 2 to  $\mathcal {O}(10)$; for example, Hawaii has only 2 congressional districts, while California has 53. In our statistical studies, we will typically take
 $n=5$.
Since elections are dynamic and inherently uncertain, the gerrymanderer risks losing if the plan is to win a district by only a single vote. Introducing a vote threshold w ensures that the gerrymanderer’s party wins a given district with a minimum margin. We call a district “safe” for red if  $N_{D_k}>w$, for a fixed prescribed
 $w\in \mathbb {Z}$ which is called the vote threshold (conversely,
 $N_{D_k}<-w$ is safe for blue). We typically take
 $w\sim 0.01\times P_S/n$, for n districts, such that safe districts favor the proponent with a margin of at least 1%.
The threshold  $\omega $ is taken to be fixed value for all districts. A more refined threshold could require a relative (percentage) excess of the population in each district, however, fixing
 $\omega $ to a predefined value for all districts greatly simplifies the algorithmic construction. Moreover, since the populations are not fixed until the end of the redistricting and since the district populations are required to be approximately balanced this is a very reasonable approximation. The results with a fixed
 $\omega $ for all districts will not discernibly differ from constructions using a district population dependent threshold, providing the district populations are comparable.
1.3 Modelling Voter Preference Distribution
We implement voter preference in terms of a number of specified points of peak partisan bias, “sources,” with voter preference falling towards neutrality away from these peaks.
Definition 9 Given a territory S, a source point is a pair  $E_{i,j}=\{(i,j),e\}$ characterized by its location
 $(i,j)\in S$ and the magnitude
 $e\in \mathbb {R}$ of the source. We require that any set of source points gives
 $|v_{i,j}|\leq 1 \forall T_{i,j}\in S$.
To match with our previous (arbitrary) assignment that 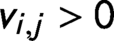 $v_{i,j}>0$ corresponds to the red party, we call
 $E_{i,j}$ a red source when
 $e>0$ and a blue source when
 $e<0$. Source points can be located at arbitrary lattice sites, and the voter preference at a given territorial unit
 $T_{i,j}$ is a function of the distance d from these source points, following a
 $1/d$ power law:
Definition 10 The vote contribution  $\Delta _{k,l}$ from a source by
 $E=\{(i,j),e\}$ to the net vote of territorial unit
 $T_{k,l}$, where
 $(i,j)$ and
 $(k,l)$ are separated by distance
 $d(T_{i,j},T_{k,l})$ is
 $$ \begin{align} \Delta_{k,l} = \frac{e}{\max[1, d(T_{i,j},T_{k,l})]}~, \end{align} $$
where the distance function (the metric) is taken to be  $d(T_{i,j},T_{k,l}) := \sqrt {(k - i)^2 + (l - j)^2}$ . Given
 $\alpha $ source points
 $\{E_\alpha \}$ for
 $\alpha \in \{1,2,…,m\}$, whose positions are chosen independently, we denote their contribution to
 $v_{i,j}$ as
 $\Delta _{i,j,\alpha }$ (where
 $\alpha $ labels the contribution from each source)
 $$ \begin{align} v_{i,j} = \sum^m_{\alpha=1}\Delta_{i,j,\alpha}~. \end{align} $$
This implies that the vote contribution from a given source falls linearly with distance d from the source.Footnote 2 Because of the  $1/d$ power law, the source points represent local maxima of the voter preference, with sign
 $(e)$ indicating the favored party. Balanced territories require at least one blue and one red source, so we will be focus on scenarios with two or more sources.
To summarize, given a territory S, we use the walker function of Section 1.1 to fix the  $P_{i,j}$ values of S and by designating a set of source points and referring to Equation (3), we fix
 $v_{i,j}$ values of S, thus defining a voter model. As an example, we assign lattice sites immediately left and right of the origin
 $(0,0)$ to serve as blue and red source points
 $\{E_{B},~E_{R}\}$ with
 $E_R=\{(-1, 0),1\}$ and
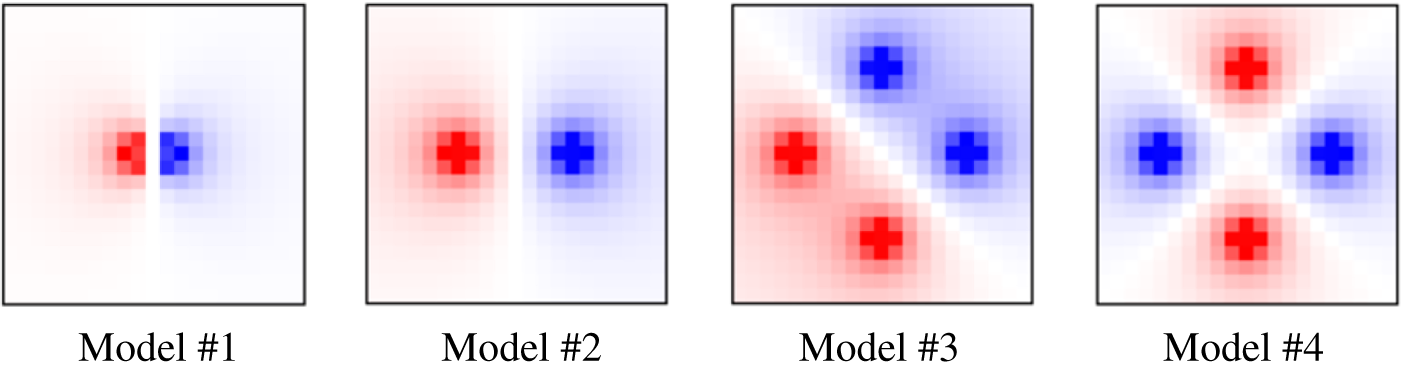
 $E_B=\{(1, 0),-1\}$. The combination of the two-dimensional quasi-Gaussian population distribution and the sources
 $\{E_{B},~E_{R}\}$ produces the voter distribution shown in Figure 2 (leftmost panel). The color intensity indicates the magnitude of the net voter preference
 $v_{i,j}$ and the center of these colored regions corresponds to the positions of the two source points.
Visualization of voter distributions for models #1–#4 of Table 1.

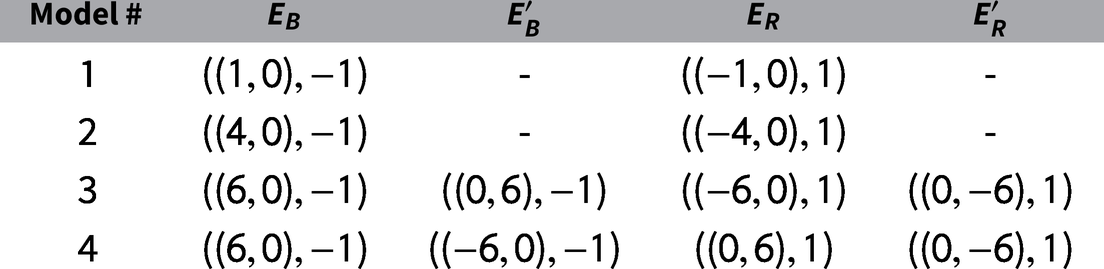
In subsequent examples and statistical analyses presented throughout the remainder of this work, we shall consider a number of specific benchmark voter modelsFootnote 3 with a quasi-Gaussian population distribution and particular source point distributions, as given in Table 1 above:
Models with two or four source points for territories based on  $21\times 21$ square lattices. A dash indicates that the source point is not included in a given model.

All of the benchmark models have balanced territorial votes:  $N_S\approx 0$. The voter distribution of models #1–#4 are illustrated in Figure 2. These examples show that the method above can implement a variety of voter distributions. In Section 6, we consider one additional voter distribution which models the urban–rural partisan divide prevalent in the United States. The benchmark models of Table 1 are particularly instructive since the lack of spherical symmetry makes them more challenging to gerrymander and thus are ideal for testing the utility of our algorithms.
2 The FH Packing Strategy
There are two fundamental strategies in algorithmic gerrymandering: packing and cracking. First, a gerrymanderer can dilute the voting power of the opponent party either by packing the most concentrated opponent-voting subpopulations into a small number of districts. Second, one can crack the most concentrated opponent population into several districts so that the most concentrated or extreme voting base for the opponent party never gains a majority. A strategic application of voter packing underlies the approach of Friedman and Holden (Reference Friedman and Holden2008).
As an the example consider a gerrymanderer that favors the red party and whose goal is that 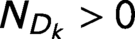 $N_{D_k}>0$ in the maximum number of districts
 $D_k$ for
 $k\in \{1,2,…,n\}$ in a given territory. Friedman and Holden (Reference Friedman and Holden2008) considered a pseudo-normal voter extremity distribution and generated districts by simply partitioning the bell curve of the population by extremity. The first district is formed by joining the most extreme subpopulations, that is, the bell curve tails, so that (i) their combined population is approximately the average district population and (ii) the right tail is sufficiently larger than the left tail. The latter condition signifies that the extreme right-party voters are sufficient to override the extreme left-party vote in their district.
The above process will, in essence, “waste” the opponent’s strongest voting population in a district it cannot likely win. This process is repeated on the subsequent districts and the final district is composed of the remaining population. Thus, by construction, the later districts are comprised of mostly moderate voters and, for balanced territories, are typically won by the opponent party. This approach has a number of merits but suffers from the lack of spatial considerations. The FH method equates to unrestricted “cherry picking”: the gerrymanderer has the freedom to select scattered population chunks for placement in the same category, as we demonstrate shortly. Notably, if even a single district is disconnected, the districting plan is typically legally prohibited.
A useful measure of failure, is the number of connected components of each district:
Definition 11 A connected component  $C\subseteq D$ of a district D is a (nonempty) set of territorial units in D such that given a territorial unit
 $T_{i,j}\in C$, another territorial unit
 $T_{k,l}$ also lies in C if and only if
 $T_{i,j}$ is reachable from
 $T_{k,l}$.
A district can be decomposed into its set of connected components  $C_i$ and we shall write
 $D=\cup _{i\leq r} C_i$, where r is the number of connected components. If any territorial unit in D is reachable from all other territorial units in D, then
 $r=1$ and we say that D is connected. The number of connected components is important for the analysis of the spatial distributions arising through the algorithms studied.
2.1 Friedman and Holden’s Algorithm on Lattice Territories
Friedman and Holden (Reference Friedman and Holden2008) outline a packing strategy which ignores the spatial data of the voter distribution. In order to demonstrate how this strategy leads to highly disconnected districts, we shall reformulate the strategy of Friedman and Holden (Reference Friedman and Holden2008) for generating districts in terms of an algorithmic approach applied to a lattice voter model and we will refer to this algorithm as “FH Packing.” Then by neglecting spatial data during the redistricting process, but tracking the positions of the territorial units allocated to each district, we can assess the connectivity of the districts constructed via FH packing.
First, since voting districts are legally required to have comparable populations, we define a target population  $P_{D\pm }:=\left (P_S/n\pm t\right )$ to ensure that all districts have approximately equal populations, in terms of t the population threshold t (from Definition 6), the total population
 $P_S$, and the number of districts n. The value of
 $P_{D\pm }$ is computed before the algorithm is executed and each district should satisfy the following population condition
 $$ \begin{align} P_{D-}\leq P_{D_k}\leq P_{D+}~. \end{align} $$
Also, the majority of district should satisfy the district win condition
 $$ \begin{align} N_{D_k}>w~. \end{align} $$
Later districts, in particular, the final district, must have an opponent bias if the territory is balanced. Only when the algorithm is satisfied with the composition of a given district will it proceeds to form the next district, until all n districts are formed.
To implement FH packing strategy on a lattice our algorithm iteratively assigns single territorial units to a district, one district at a time, such that the end result favors the proponent. We call a territorial unit unassigned unit if it has not yet been assigned to a district and denote the set of unassigned units U. As territorial units are assigned to districts by the algorithm, they are deleted from U. For a territory S on a  $m\times m$ lattice there are initially
 $m^2$ unassigned territorial units in U and n (empty) districts
 $D_k$ for
 $k\in \{1,2,…,n\}$. We implement the FH packing strategy by first sorting the territorial units in order of decreasing voter extremity
 $v_{i,j}$, using a quicksort method (Hoare, Reference Hoare1961), and relabeling the elements of this ordered set
 $\{\hat {T}_1,\hat {T}_2,\ldots \hat {T}_{m^2}\}$, such that
 $\hat T_1$ corresponds to the strongest unit vote for the opponent party and
 $\hat T_{m^2}$ is the strongest unit vote for the proponent. More precisely, the strongest unassigned opponent unit is
 $T_{i,j}\in U$ if
 $v_{i,j}\leq v_{k,l}$ for all
 $T_{k,l}\in U$, or equivalently it is
 $\hat T_\beta \in U$ if for all other
 $\hat T_\gamma \in U$ one has
 $\beta <\gamma $. Conversely,
 $\hat T_\beta $ for
 $\beta $ the largest index in U is the strongest unassigned proponent unit.
Implementing a discretised version of the strategy outlined in Friedman and Holden (Reference Friedman and Holden2008), our algorithm forms each district D by iteratively adding the strongest the unassigned proponent unit followed by the strongest unassigned opponent units, until  $P_D>P_{D_-}$. The algorithm then calculates the district vote
 $N_{D_k}$ and compares it to the vote threshold w. If
 $N_{D_k}>w$ and
 $P_D<P_{D_+}$ then the district is complete and the algorithm repeats this process to create the remaining districts, with the exception of the last district. It may be that in forming a given district, while the district satisfies
 $P_D>P_{D_-}$, the district vote is calculated to be less than the vote threshold. In this case, the algorithm adds the strongest remaining unassigned proponent units until
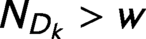 $N_{D_k}>w$, and at each step checks that
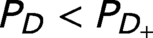 $P_D<P_{D_+}$. Once the district vote is sufficiently large, the district is complete. When the population limit is exceeded,
 $P_D>P_{D_+}$, our algorithm removes the last unit added and tries the next in the ordered list until it identifies an addition to the district that does not violate the limit. For large vote thresholds w or small population thresholds t, this districting algorithm may fail (i.e., no district satisfies simultaneously Equations (4) and (5)), but this is rarely a problem for percent-level w and t. Finally, the last district
 $D_n$ is identified with the remaining unassigned territories after the first (
 $n-1$) districts are constructed. If the territory is balanced, as we assume, then it is impossible for all districts to favor the proponent, and thus it is expected that for the final district
 $N_{D_n}<0$. By design, the final district is primarily comprised of moderate voters. The only requirement on the final district is that it satisfies
 $P_{D-}\leq P_{D_n}\leq P_{D+}$ which is commonly the case for reasonable t.
For a smaller population threshold, and thus a more stringent requirement of population uniformity, the final district may fail the population constraint. In this case, after constructing the final district the algorithm will make a number of amendments to the district compositions such that the populations are within the threshold. In the case that  $P_{D_n}> P_{D+}$, the proponent-favoring territorial units on the exterior of the final district are transferred to adjacent districts. If
 $P_{D_n} < P_{D-}$, then the opponent-favoring units in other districts and adjacent to the final district will be transferred to the final district.
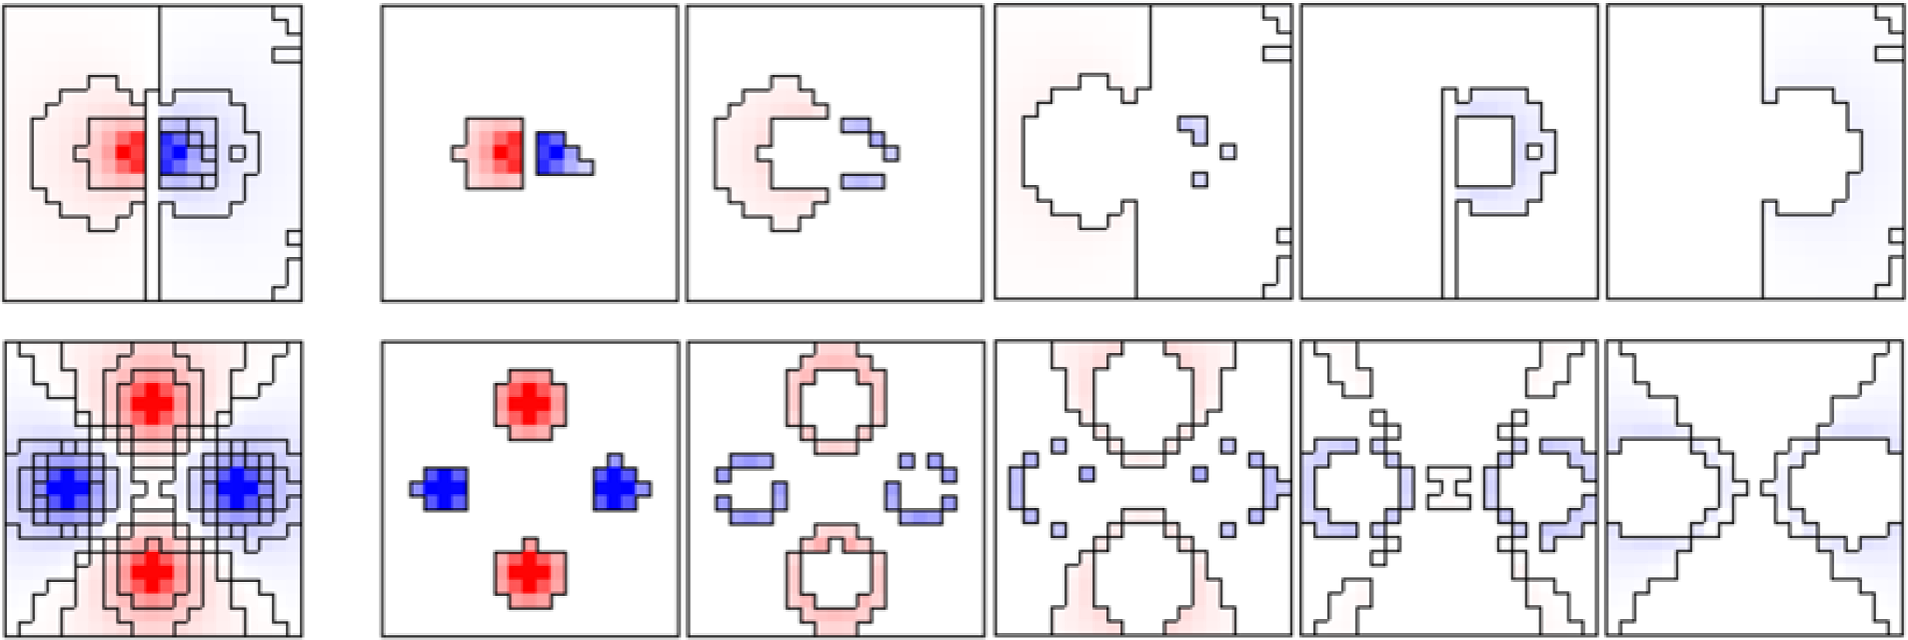
Example executions are shown in Figure 3 and a flow chart illustrating the steps of this algorithm is presented in the online Supplementary Material. We show the output of our implementation of the algorithm of Friedman and Holden (Reference Friedman and Holden2008), as described above, partitioning a  $21\times 21$ lattice territory into five districts for benchmark models #1 and #4 (defined in Table 1). The intensity of the color indicates the partisan extremity of a given territorial unit and the black lines indicate divides between districts. The left most panel illustrates the whole territories, while the panels to the right show, in order, the composition of Districts 1–5 in order of construction. Observe that the district compositions output by this algorithm are all typically disconnected, and this shall be quantified through Monte Carlo studies shortly.
Example districting results for benchmark model #1 (top) & #4 (bottom) of Table 1 with a Gaussian population distribution and a balanced vote. The gerrymander’s party is colored red, and in both cases wins the popular vote in three of the five districts.

2.2 Impact of Friedman and Holden Packing Method
Before examining whether the districts constructed emulating the Friedman and Holden method are connected, we shall first look to quantify what degree of advantage this gerrymandering procedure gives to the proponent by comparing to a nonpartisan model of districting. To assess the impact of gerrymandering we construct a voter model on a  $21\times 21$ lattice territory S, where the population distribution is quasi-Gaussian as in Section 1.2, the source points follow the benchmarks of Table 1, and the total populationFootnote 4 is fixed to be
 $P_S\approx 4700$ (up to
 $0.5\%$ fluctuations). Since the walker function introduces random fluctuation in the population distribution, each run returns a different redistricting. Thus, we can assess the impact of gerrymandering for a given set of source points via a Monte Carlo approach using multiple runs of the algorithm.
Specifically, we generate a set of distinct redistricting plans on 30 different  $21\times 21$ lattice population models with balanced votes
 $N_S\approx 0$ for each of the four benchmark source point placements (as shown in Figures 2, and partition the territory into five districts (i.e., take
 $n=5$). For each district
 $D_k$, for
 $k\in \{1,2,…,5\}$ , we calculate the average district vote
 $N_{D_k}$ and population
 $P_{D_k}$, and the average number of district wins for the proponent
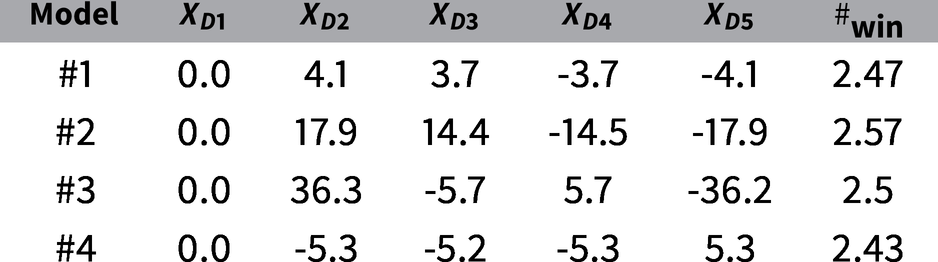
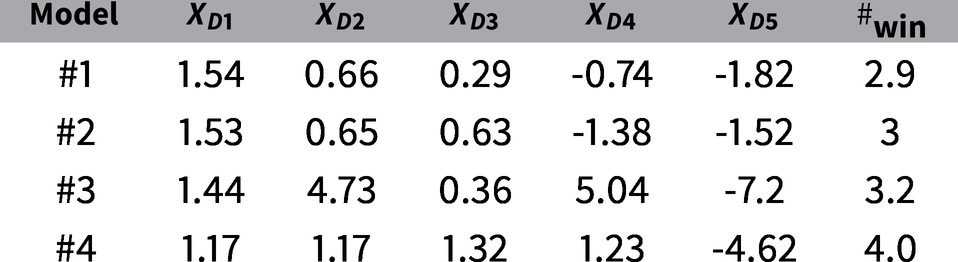
 $\#_{\mbox {win}}$. In Table 2, we show the average vote share
 $X_{D_k}$ (cf. Definition 8) in each district (where the districts are enumerated by order of construction) following redistricting via FH packing and averaging over 30 runs. The vote share is normalized such that if the entire population votes for one party
 $X_D=\pm 100$ and an even vote split returns
 $X_D=0$.
Average population and percentage vote share  $X_D$ in each district formed using the FH method.

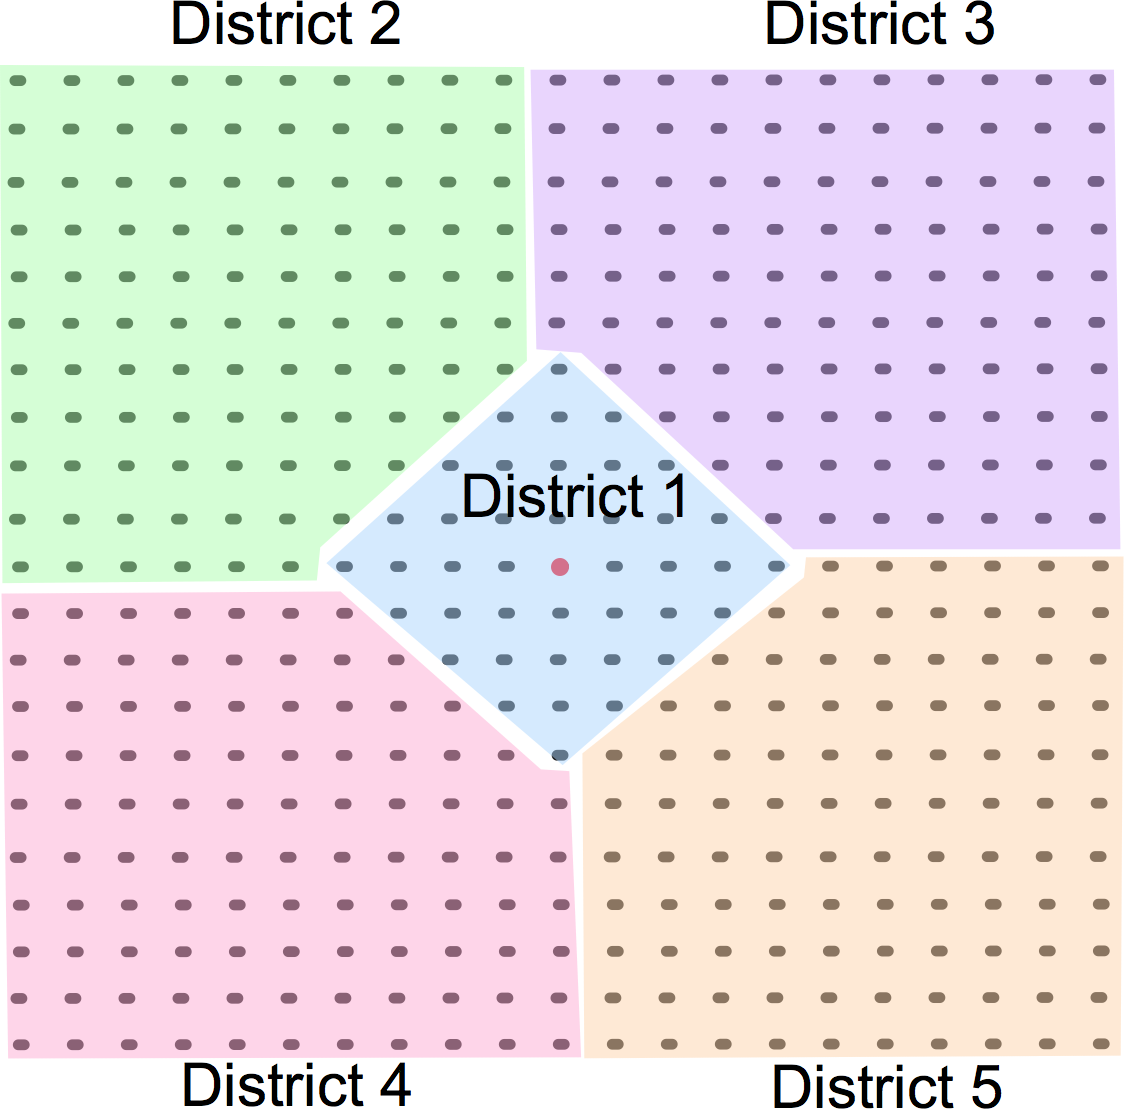
It is insightful to compare these results to some “fair” partitions of the population. Since the population approximates a two-dimensional Gaussian, any spherically symmetric partition of the population which does not take into account the voter distribution can be considered a nonpartisan districting. We shall construct a nonpartisan  $n=5$ districting by allocating the central cells to District 1 and then symmetrically partitioning the set of territorial units not assigned to District 1 to create Districts 2–5. We choose to partition Districts 2–5 by simply drawing the district lines along the horizontal and vertical mid axes, and assigning the territorial units on the borders to the adjacent district in the clockwise direction. The size of District 1 is fixed such that the five territories have approximately equal populations, thus it is determined by the Gaussian spread and population threshold t. The resulting districts are illustrated in Figure 4.
A fair symmetric districting of a  $21\times 21$ lattice.

To assess the impact of gerrymandering we compare predicted results for the case of gerrymandered districts determined by our implementation of the FH packing strategy to the vote for the symmetric districts outlined above for balanced territories. Generating 30 population distributions on S, we calculate both the average vote share per district  $X_{D_k}$ and the average number of proponent district wins
 $\#_{\mbox {win}}$, as shown in Table 3.
Average percentage vote share per district  $X_D$ for idealized non-partisan symmetric districts.

Through the comparison of Tables 2 and 3 it is clear that FH packing significantly impacts the electoral outcome, skewing the predicted number of district wins  $\#_{\mbox {win}}$ in favor of the proponent party. However, as we show next, the districts constructed via FH packing are generically disconnected and therefore typically legally prohibited.
2.3 Connectivity of Friedman and Holden Districts
Since the FH method includes no spatial data, one might expect disconnected districts. In what follows, we shall quantify the failure of the FH packing method to produce connected (and thus legal) districts. To this end, we shall take the districts constructed in Table 2, output the assignments of the territorial units, and identifying the number of connected components in each district.
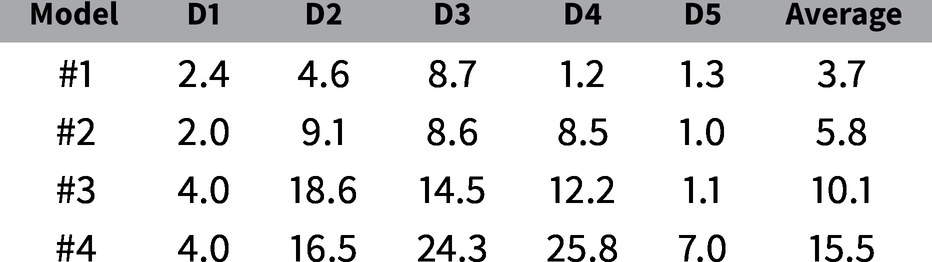
To show that the districts constructed via FH packing are highly disconnected, we take the outputs of the 30 runs of FH packing on S generated previously and calculate the mean number of connected components for each district (labeled D1 to D5) and the mean over all districts for the four benchmark source point models. The results are displayed in Table 4 and Figure 3 shows one (of the 30) district composition output by the algorithm for each benchmark model, where one can see that the districts are highly disconnected.
Number of connected components for districts created by our algorithmic implementation of the FH packing strategy.

Under the above settings we find the strategy of Friedman and Holden (Reference Friedman and Holden2008) typically outputs districts with  $\mathcal {O}(10)$ components. Importantly, disconnected districts are legally prohibited. Thus, while the FH method is simple and easy to implement, it is too simplistic to give a realistic model of redistricting and makes it clear that it is critical that algorithmic approaches take into account the spatial distribution of voters.
3 Packing with Spatial Restriction
We dedicate this section to introduce two novel algorithms that gerrymander voter distributions on lattices in a manner that strongly favors the proponent and gives mostly connected districts: SRFH Packing and “Saturation” Packing. In SRFH, packing the gerrymander aims to guarantee wins in the majority of districts, but lose the later constructed (moderate) districts, whereas the saturation strategy relies on constructing districts to be discarded with significant opponent biases. In Section 4, we introduce one further strategy based on genetic algorithms. Python codes for each algorithm are provided online.
3.1 Spatially Restricted FH Packing
We introduce here the SRFH Packing algorithm, which is a modification to the FH packing approach that allows the inclusion of spatial data. This SRFH algorithm forms each district by first including the strongest opponent and proponent unassigned units, as well as a path of territorial units between them (which necessarily includes moderate voters). The algorithm then successively adds highly polarized units of both parties which are adjacent to the forming district, until it satisfies the population requirement and the net vote favors the proponent party, that is until the district satisfies Equations (4) and (5).
Districts are construction as follows districts, with the exception of the final district. Initially there are x unassigned territorial units; similar to the FH algorithm the first step is to sort, via quicksort, the unassigned units in order of decreasing voter extremityFootnote 5  $v_{i,j}$ and relabel the ordered set
 $\{\hat {T}_1,\hat {T}_2 \ldots \hat {T}_x\}$. To form a new district, the algorithm adds the unassigned units
 $\hat T_1$ and
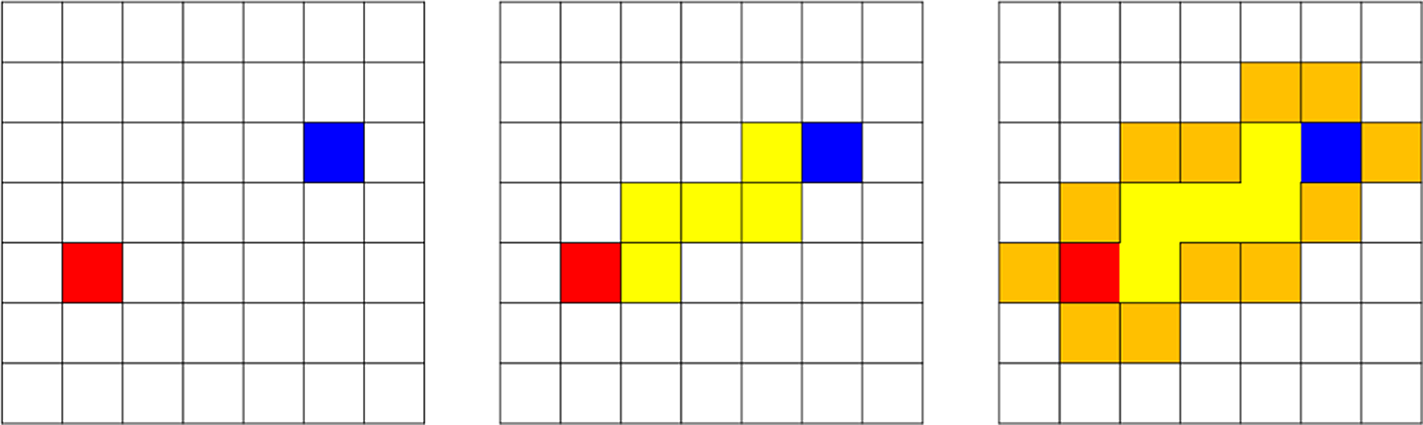
 $\hat T_x$ to the district and the shortest path between them that avoids all already assigned territorial units, as in Figure 5. We use a Grassfire algorithm Bium (Reference Bium1964) to remove assigned units when determining the shortest path. If a given path between
 $\hat T_1$ and
 $\hat T_x$ exceeds the target population
 $P_{D\pm }$, then the next shortest path is selected, but this is typically not an issue.
Left: An example of the most extreme proponent and opponent units. Center: One of the four shortest paths through unassigned territory between the extreme endpoints. Right: the set of territorial units (orange) considered for addition to the district.

While  $P_{D_k}<P_{D-}$, the algorithm will repeatedly add to the district the most extreme territorial unit that is unassigned and adjacent to it. If the net vote of the district does not sufficiently favor the proponent party, as determined by a vote threshold parameter w, then the algorithm will successively add proponent units to the district. Once the net vote favors the proponent, the algorithm adds opponent units to balance the vote. After adding each unit to a given district, the algorithm calculates the current district population
 $P_D$ and fixes the district when
 $P_D>P_{D-}$. It then checks that
 $P_D<P_{D+}$, if this check fails, the most recent territorial unit added is replaced with an alternative adjacent unit, until the above is satisfied. After a connected set is validated as a district, the algorithm recurs on the remaining sorted list of territorial units to create another district. The algorithm will typically produce districts in order of decreasing
 $N_{D_k}$, with the proponent vote being stronger than the opponent vote. The remaining unassigned units after the construction of
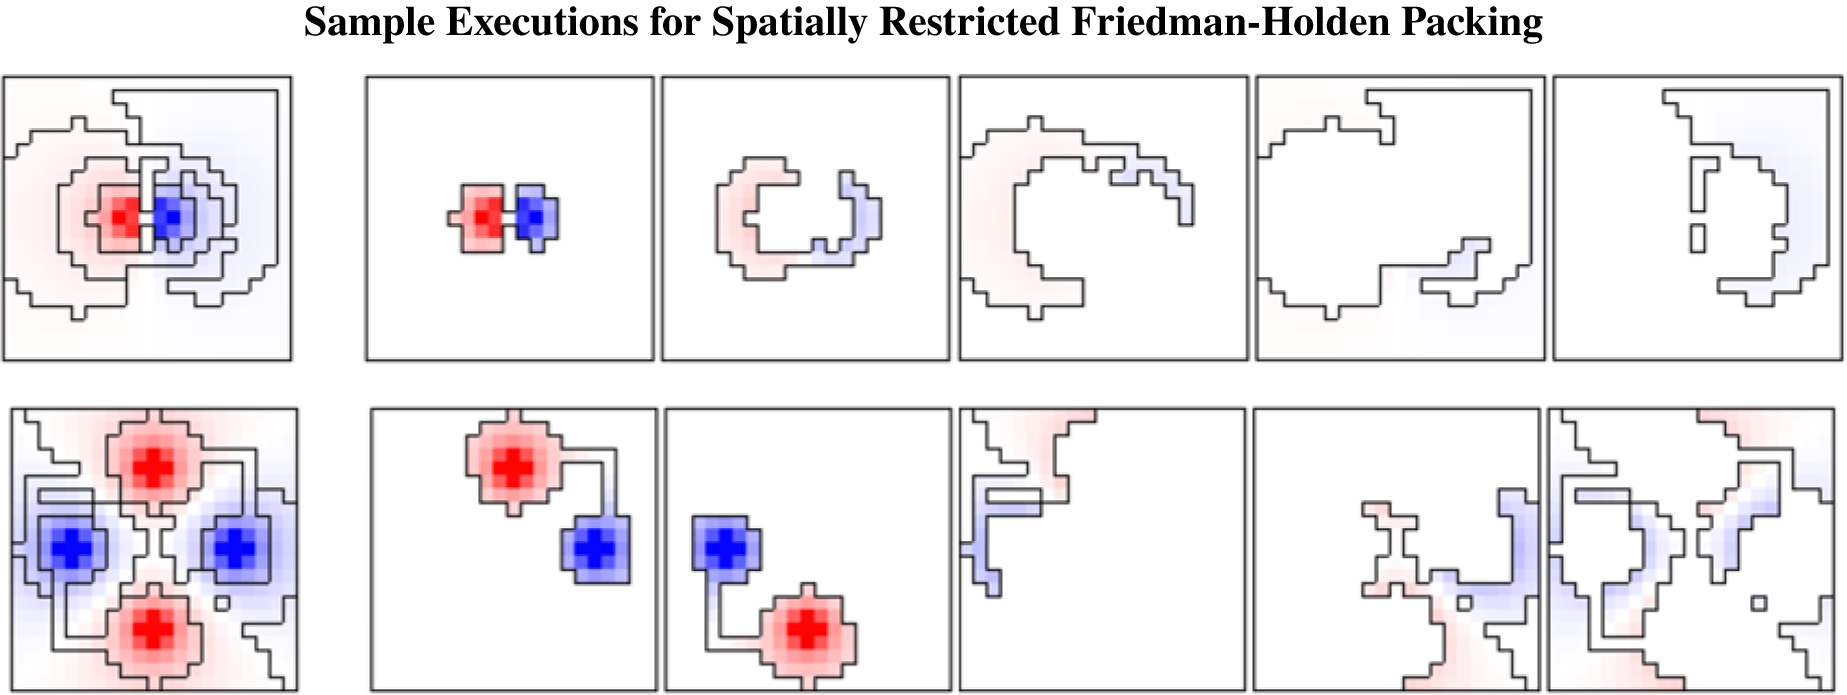
 $n-1$ districts are assigned to the final district, and thus the last district is typically disconnected. The Supplementary Material provides a flowchart of this algorithm. Figure 6 shows an example output of the SRFH Packing strategies, in which we partition a
 $21 \times 21$ lattice into five districts for the benchmark voter models #1 and #4 of Table 1.

3.2 A Saturation Packing Algorithm
We now introduce an alternative approach we call Saturation Packing, which implements the simple strategy of packing extreme opponent voters into a single compact district. The Saturation Packing algorithm builds on the previous framework of the SRFH method, however, prior to constructing any districts, each territorial unit is assigned a priority value based on its net vote and its average distance from proponent source points.Footnote 6
Definition 12 For a territory S with  $\alpha $ proponent source points
 $E_1, \ldots , E_\alpha $, we define the priority
 $z_{i,j}$ of a territorial unit
 $T_{i,j}$ to be
 $$ \begin{align} z_{i,j} := -v_{i,j} \cdot \frac{1}{\alpha}\sum_{j=1}^{\alpha}d\left(E_j, T_{j,k}\right). \end{align} $$
Once all priorities are assigned, the list of territorial units is sorted in order of decreasing priority and the territorial unit with the greatest negative priority at the beginning of the sorted list is added to the collection  $D_1$, that will eventually form the first district. Then, the algorithm searches over all territorial units adjacent to
 $D_1$ and adds the next highest negative priority unit to
 $D_1$. This last process is repeated until
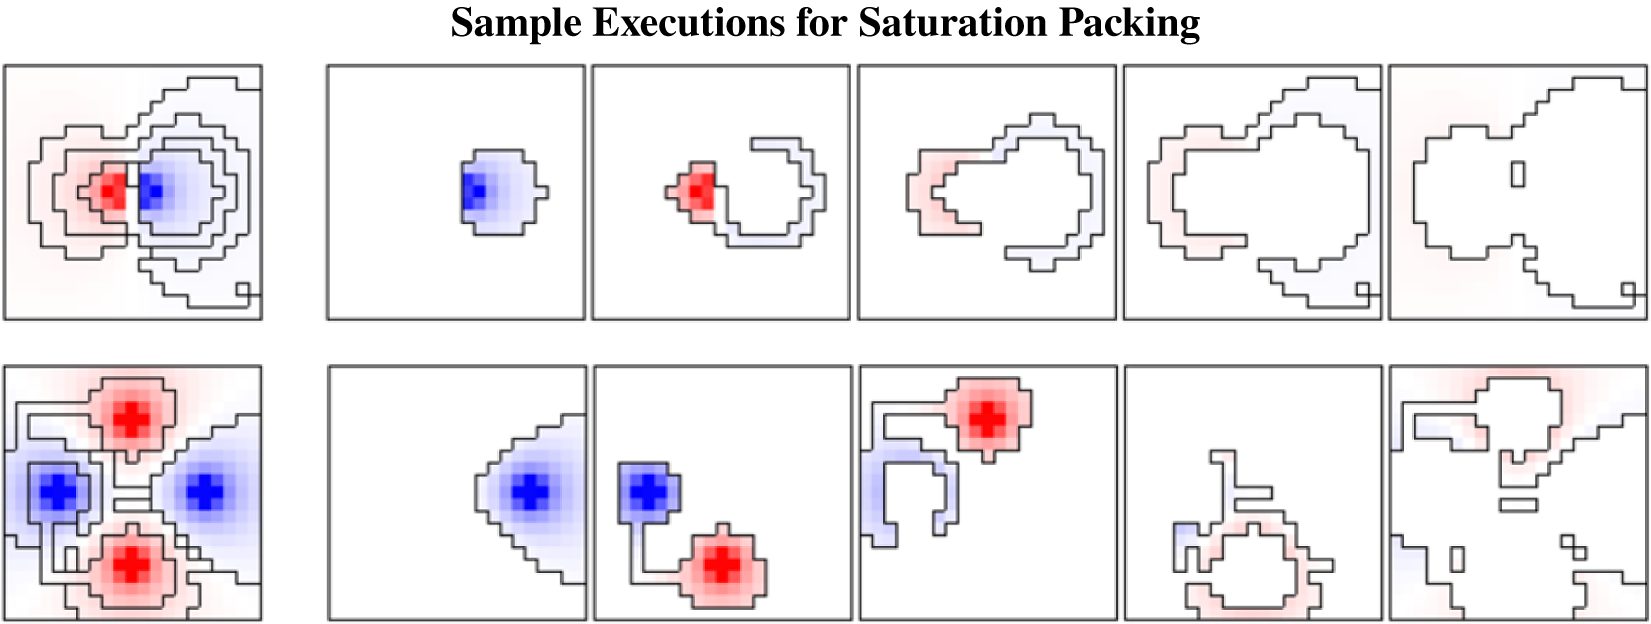
 $P_{D_1}> P_{D-}$. After District 1 is constructed via the Saturation Packing algorithm, all subsequent districts are created using the SRFH Packing algorithm from the previous section. A flowchart for this algorithm is given in the Supplementary Material. Figure 7 presents an example outputs of the Saturation Packing strategy.

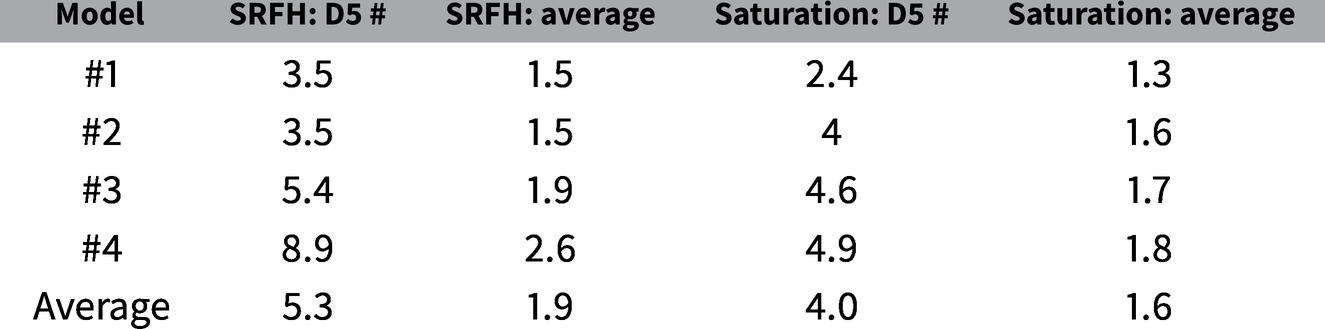
Observe in Figures 6 and 7 that, with the exception of District 5, the districts created are connected, which is a notable improvement on the original strategy of Friedman and Holden (Reference Friedman and Holden2008) which typically produced  $\mathcal {O}(10)$ components for each district. Following similar methodology to Table 4 with 30 trails, in Table 5, we quantify the number of connected component in the final district (“D5 #”) for both Saturation and SRFH Packing, as well as stating the average number of connected components for all districts (“average”) for comparison with Table 4.
Average number of connected components for District 5, and average number of connected components over all five districts, for the Saturation and SRFH algorithms.

As shown in Section 2.3, the basic FH Packing method, which does not account for the spatial distribution of voters, the average number of connected components is  $\mathcal {O}(10)$ components (cf. Table 4), whereas for our algorithms with spatial restrictions the average is
 $\mathcal {O}(1)$. With so few components one can potentially achieve connectivity in postprocessing with a small number of swaps, and in a real world environment one could also possibly exploit geographical features or utilize the empty area external to territory to arrange for the final district to be connected. We quantify the effectiveness of these different districting strategies in Section 5.
4 Genetic Gerrymandering Algorithm
In Section 3, we advanced on the basic strategy of Friedman and Holden (Reference Friedman and Holden2008) by including spatial restrictions through what we called the Saturation and SRFH packing algorithms. However, those methods both rely on assigning territorial units to districts in manner that satisfies local requirements without reference to the global assignments and thus typically the final districts are disconnected. While one can potentially “fix” the final district following the completion of the algorithm, this is somewhat unsatisfactory. In order to resolve this issue that the final district remains disconnected, we introduce here a new class of gerrymandering algorithm which we call Genetic Gerrymandering (GG), based on the general ideas of genetic algorithm approaches. Rather than constructing districts by selecting particular territorial units, this genetic algorithm takes a starting configuration of districts and evolves it over a number of iterations towards some goal. From some arbitrary initial “seed” set of districts the algorithm generates a number of mildly altered variants (mutations), it then calculates a fitness index for each of the sets of districts and retains the district sets with the highest index values, before repeating the process. After several iterations the system converges on a particular outcome.
One distinct benefit of this procedure is that since the initial seed is a set of connected districts, provided that connectivity is respected in subsequent mutations, then the final set of gerrymandered districts will also be connected. To our knowledge, genetic algorithms have not been applied to the question of how to optimally gerrymander a territory to provide highly partisan outcomes. There has, however, been a good deal of work on implementing fair districting using genetic algorithms, for example (Forman and Yue, Reference Forman and Yue2003; Bacao, Lobo, and Painho Reference Bacao, Lobo and Painho2005; Chou et al., Reference Chou, Chu and Li2007; Altman and McDonald, Reference Altman and McDonald2011; Vanneschi et al., Reference Vanneschi, Henriques and Castelli2017).
4.1 The Gerrymandering Index
In order to gerrymander the districts, one needs to construct a fitness index which favors the proponent party. Although there is no unique way to construct this index, any good fitness index for gerrymandering should take into account the number of districts which are winnable for the gerrymanders’ party and the population spread. The latter is taken into consideration to ensure that the districts have approximately equal populations, in order to make the districts legally valid. The fitness function we construct depends on these two qualities and it allows the algorithm to skew the populations if it provides an advantage to the proponent party.
Let W be the number of safe proponent districts plus half the number of contended districts (those with  $\left |N_{D}\right | < w$) given by
 $$ \begin{align} W =\sum_{k=1}^n \Theta(N_{D_k}-w)+\frac{1}{2}\left[n-\sum_{k=1}^n \Theta(N_{D_k}-w)-\sum_{k=1}^n \Theta(-N_{D_k})\Theta(|N_{D_k}|-w)\right], \end{align} $$
where  $\Theta $ is the Heaviside
 $\Theta $ function. The safe proponent districts are those with
 $N_{D}> w$ and the number of contended districts can be counted as the total number of districts n minus the total number of safe (proponent and opponent) districts. We also define the following population measure
 $$ \begin{align} g := \frac{1}{P_S}\left(\max\limits_{1\leq k \leq n}\left(P_{D_k}\right) - \min\limits_{1\leq k \leq n}\left(P_{D_k}\right)\right). \end{align} $$
The quantity W and the measure g characterize the salient properties of a given district plan for the purposes of gerrymandering, and using these we define the following gerrymandering fitness index, given by the ratio of districts won minus the population spread:
 $$ \begin{align} G := \frac{W}{n}-g~. \end{align} $$
The index G takes values in the interval  $\left [0, 1\right ]$, with the most desirable outcome for the gerrymanderer occurring for those sets of districts with the highest fitness index. For this algorithm the population measure g replaces the earlier population threshold t and the algorithm positively weights, and thus over multiple mutations tends toward, balanced populations between districts. This index G we consider is fairly simple, defined by just two parameters, and one could certainly construct more elaborate indexes, but this simple form is sufficient to explore the prospects of gerrymandering a given territory.
4.2 Random Seed
The other component of the genetic algorithm is the definition of a set of seed districts for the genetic gerrymandering algorithm, being a random starting configurations of districts, and the mutation procedure which generates the iterations. Our starting point for the genetic gerrymandering algorithm is an arbitrary partition of the territory into n connected districts which is referred to as the seed districting. We construct this random seed as follows: for a partition of the territories into n districts we randomly select n territorial units label these  $\tilde T_k$ for
 $k=1,\ldots n$, and perform a flood fill (Smith, Reference Smith1979; Glassner, Reference Glassner2013) around these units. Via the flood fill algorithm each of the territorial units is assigned to the nearest unit in
 $\{\tilde T_k\}$, calculated using the distance function defined in Section 1.3. Thus each initial district
 $D_k$ is the set of units which are closest to the seed
 $\tilde T_k$. Units which are equidistant from two seeds are assigned to the set carrying the lowest numerical label
 $k\in (1,n)$.
This flood-fill approach to random districting guarantees connected districts that are typically convex and compact. Although this method does not enforce population equality, the random districtings start out highly equitable from a geometric standpoint, and the district populations tend to balance out as they evolve due to the definition of the index G.
In our implementation the random seeds are chosen with a flat distribution, that is every unit has equal probability regardless of population, however, in the real world, the size of census units commonly varies according to the population density which could potentially lead to clustering of random seeds around urban areas. This clustering could be remedied by weighting the seed placements accordingly, however, note that the subsequent genetic evolution makes the system somewhat (but not entirely) insensitive to the placement of the seeds. Additionally, we note that the known voter distribution might be used to inform the seed placement (rather than being entirely random), we intend to return to explore this refinement in future work.
4.3 Mutation Procedure
The final component of the genetic gerrymandering algorithm is to randomly alter the districts, identify the mutated district which maximizes G, and iterate this procedure. Our mutation procedure swaps certain units between adjacent districts on each iteration in a manner that preserves connectedness of each district and favors balanced populations.
Definition 13 For a territorial unit T in district D, a district  $D'$ (for
 $D\neq D'$) is said to be an adjacent district to T if there exists a
 $T'\in D'$ which is an adjacent unit to T.
To implement the mutation process, we assign a value  $L_{i,j}$ to each
 $T_{i,j}\in S$ and define
 $M:={\textrm {max}}[L_{i,j}]$ over all
 $T_{i,j}\in S$. The quantity
 $L_{i,j}$ describes a territorial units propensity to switch to a different adjacent district during the mutation procedure. Then for all
 $T_{i,j}\in S$ with
 $L_{i,j}> 0$, a mutation on T is performed with probability
 $L_{i,j}/M$, removing
 $T_{i,j}$ from its old district and adding
 $T_{i,j}$ to the lowest-population district adjacent to
 $T_{i,j}$. By choosing the assignments of
 $L_{i,j} $ appropriately this transfer of territorial units always make the district populations more balanced and thus the voting districts quickly become significantly more equitable (in just a few generations). Specifically, we assign the value
 $L_{i,j}=0$ to the territorial unit
 $T_{i,j}$ in district D if
 $D-T_{i,j}$ is not connected. Otherwise,
 $L_{i,j} := \max \left (P_D - P_{D'}\right )$ over all districts
 $D'$ adjacent to
 $T_{i,j}$. Thus, if a given territorial unit
 $T_{i,j}$ lies in the same district as each of its adjacent territorial unit, then
 $L_{i,j} = 0$ and
 $L_{i,j} \neq 0$ occurs only for territorial units on a border between districts.
In summary, a set of N seed districts forms generation 1 and our algorithm then performs the following iterative procedure for generation i: it identifies the  $\sqrt {N}$ cases (rounding appropriately) with the highest G indices and to these
 $\sqrt {N}$ cases it applies the mutation procedure
 $\sqrt {N}$ times. Because of the probabilistic nature of the mutations this produces N different offspring, which comprise generation
 $i+1$. With each iteration, the set of districts evolve toward a local maximum of G. After a preset set number of iterations the algorithm outputs the set of districts with the best G index from the final generation. Typically, after
 $\mathcal {O}(10)$ iterations the algorithm converges. A flowchart is provided in the Supplementary Material.
4.4 Sample Executions of Genetic Gerrymandering
For our example run, we construct  $N= 100$ random seed districtings for the first generation and the algorithm selects the 10 with highest G index to mutate. At each stage, the algorithm runs the mutation method
 $10$ times on each parent, producing
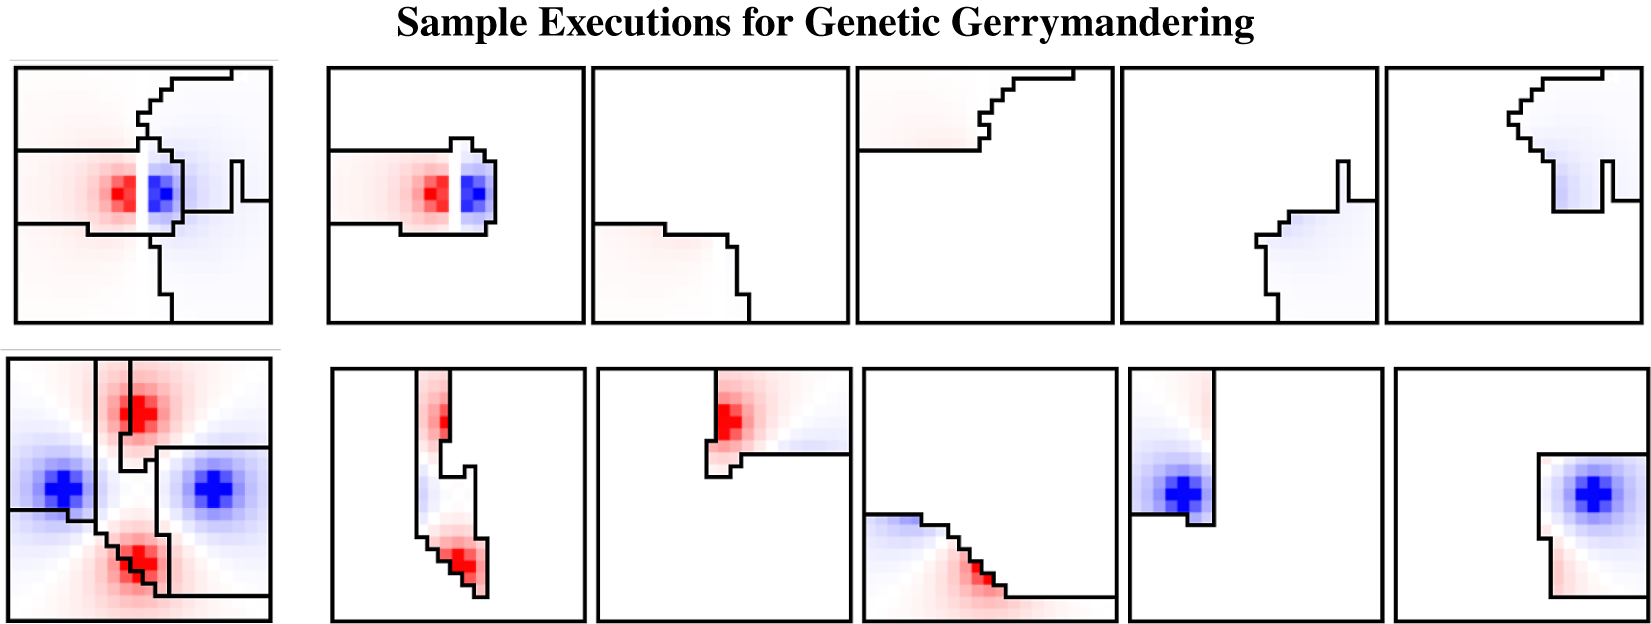
 $10\cdot 10 = 100$ offspring. This evolution is iterated over 12 generations, and the final districting output is the set in the last generation with the highest G index. In Figure 8, we present a sample executions of the genetic gerrymandering algorithm applied to the benchmark models #1 and #4 of Table 1, in analogy to Figures 3, 6, and 7.

Before closing this section, we note that the genetic gerrymandering algorithm developed above can be adapted to construct fair districtings simply by changing the fitness index, and we present these modifications along with a sample execution in the online Supplementary Material. As mentioned above, the use of genetic algorithms to fair districting has been previously studied in the literature, for instance (Forman and Yue, Reference Forman and Yue2003; Bacao et al., Reference Bacao, Lobo and Painho2005; Chou et al., Reference Chou, Chu and Li2007; Altman and McDonald, Reference Altman and McDonald2011; Vanneschi et al., Reference Vanneschi, Henriques and Castelli2017) and, indeed, many of the existing algorithms for fair districting are far more sophisticated than the one we discuss below. However, the genetic heuristic and mutation procedure developed in our genetic gerrymandering algorithm is distinct and original, and it is interesting that, at least in our simplified lattice models, fair districts can be readily constructed from the simple and intuitive criteria we stipulate.
5 Results
Through the algorithms developed here, we shall quantify some general statements about gerrymandering. To this purpose, we consider the subdivision of a  $21\times 21$ lattice S into
 $n=5$ districts, with population
 $P_S\approx 4700$ and voter distributions as in Table 1. The population and vote thresholds are fixed to be
 $t = 0.05 \times P_S/n$ and
 $w = 5$ in all relevant cases.
Due to the inherent randomness built into the population distribution we can use the districts output by the redistricting algorithms with spatial restrictions, developed in Sections 3 and 4, to study aspects of gerrymandering via a Monte Carlo approach. Specifically, we generate a large sets of gerrymandered territory for the case of five districts and undertake a statistical analysis to quantify the advantage which gerrymandering brings to the proponent party and other characteristics of gerrymandered territories.
While Monte Carlo methods have been previously employed for detection of gerrymandering, for instance (Herschlag, Reference Herschlag2018; Herschlag et al., Reference Herschlag, Ravier and Mattingly2017), and also toward constructing fair districts, for example (Fifield et al., Reference Fifield2015), to our knowledge, this is the first study to apply a Monte Carlo approach to look to quantify general features of gerrymandering.
5.1 Quantitative Impact of Different Gerrymandering Strategies
The primary aim of the gerrymanderer is to maximize the predicted number of districts won  $\#_{\mbox {win}}$ during an election. The secondary aims are to construct proponent districts with
 $N_D\gg 0$ and to arrange for opponent districts with
 $N_D\approx 0$, such that the districts constructed are secure from potential swings in the voting preferences against them, and can capitalize on swings in their favor to pick up additional districts.
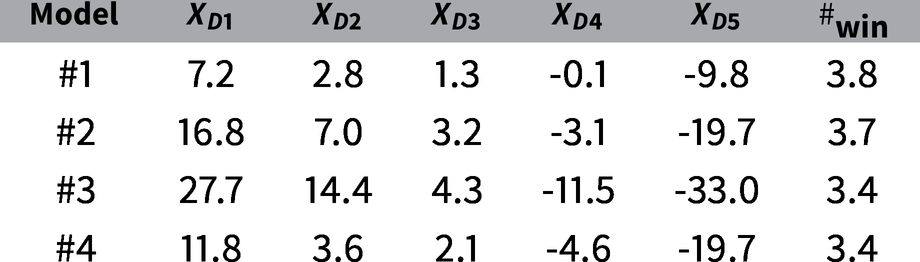
To assess the impact of gerrymandering we compare predicted election results for each of the gerrymandering algorithms developed above to the nonpartisan symmetric districting model outlined in Section 2.2 and illustrated in Figure 4. The predicted election results of the symmetric districting model are given in Table 3. Taking first the SRFH Packing algorithm, and following a similar methodology to Section 2.2, we generate 30 population distributions on S and calculate the average net vote per district  $N_{D_k}$ and the average number of district wins for the proponent (
 $\#_{\mbox {win}}$):
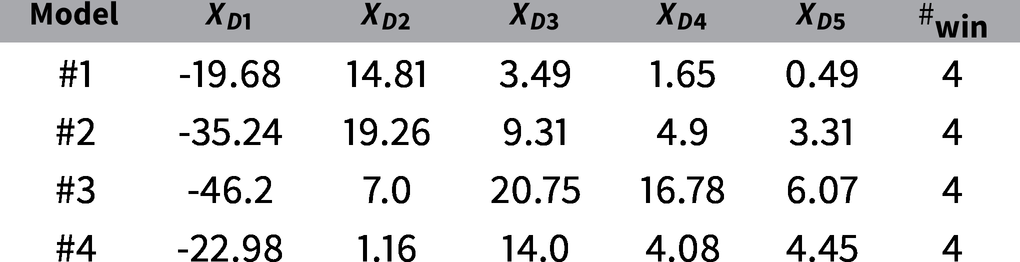
In the case of gerrymandering via Saturation packing, we find that, although blunt, it can be extremely effective in securing districts for territories with a balanced vote:
Finally, we consider applications of the Genetic Gerrymandering algorithm, after each run we label the districts in order of net vote (prior to calculating the district averages):
Since in each case above, the territorial vote is close to balanced,  $N_S\approx 0$, in a fair election the expected average number of proponent districts wins is
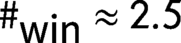 $\#_{\mbox {win}}\approx 2.5$. This is seen to be the case in Table 3 for symmetric districting with symmetric sources. However, as anticipated, for the gerrymandered districts generated by our algorithms one observes clear skews in favor of the proponent. Specifically, SFRH Packing (Table 6) leads to the proponent always winning 65% of districts and Saturation Packing (Table 7) results in an impressive 80% of district wins for the proponent. For Genetic Gerrymandering (Table 8) the proponent wins around 70% of districts and, moreover, this has the important benefit of guaranteed connected districts.
Average district vote share (%) after SRFH Packing of Section 3.1.

Average district vote share (%) after Saturation Packing of Section 3.2.

Average district vote share (%) after Genetic Gerrymandering algorithm of Section 4.

5.2 Compactness Tests
One of the most identifiable traits of gerrymandering is that it typically leads to highly nonconvex or noncompact districts. Motivated by this common trait, researchers (Roeck, Reference Roeck1961; Schwartzberg, Reference Schwartzberg1966; Oxtoby, Reference Oxtoby1977; Young, Reference Young1988; Niemi et al., Reference Niemi, Groffman, Calucci and Hofeller1990; Polsby and Popper, Reference Polsby and Popper1991; Chambers and Miller, Reference Chambers and Miller2010; Hodge et al., Reference Hodge, Marshall and Patterson2010) have proposed geometric measures that can potentially be used to identify gerrymandering. It should be noted that simple geometric tests, while intuitive, do have certain drawbacks. For instance, they often do not account for variations in district boundaries due to natural or legal borders (e.g., coastlines or national borders) and do not incorporate information on population distributions or demographics. Regardless, it is interesting to calculate these geometric measures for the gerrymandered districts arising in our work, in order to ascertain which index values likely indicate aggressive gerrymandering.
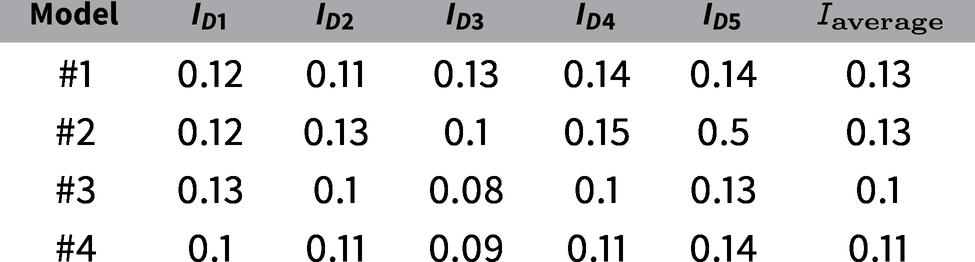
We shall examine the most intuitive dimensionless gerrymandering measure: the isoperimetric quotient index (Polsby and Popper, Reference Polsby and Popper1991), defined as  $I_D:=4\pi A/P^2$, for a district D of area A and perimeter P. The index is normalized to the circle, and deviations of a district from a circle give
 $I_D<1$. In Table 9, we give the average
 $I_D$ for each district produced via Genetic Gerrymandering (labeling districts in ascending
 $N_D$ after each run) as well as the mean
 $I_D$ for all districts averaged over 30 runs.
Isoperimetric quotient of districts produced by genetic gerrymandering.

In order to demonstrate that the districts generated by the Genetic Gerrymandering algorithm could potentially be detected and constrained by isometric quotient tests, we compare the  $I_D$ values of Table 9 to the isometric quotients calculated for the idealized nonpartisan symmetric districts of Section 2.2, these are given in Table 10.
Isoperimetric quotient indices for idealized nonpartisan symmetric districts

Since the idealized nonpartisan symmetric districts follow simple geometric construction rules, without reference to the voter distribution, the same  $I_D$ value is found for models #1–#4 (up to negligible fluctuations in the population distribution).
From the above analysis we find that our gerrymandering method always leads to an average  $I_D$ which is much lower than the symmetric “fair” districts. Moreover, some of the gerrymandered districts have very low
 $I_D$ values, for instance the average value for District 3 of model 3 was
 $I_{D3}^{(\#3)}\approx 0.08$, which is significantly lower than the isoperimetric quotient of the typical symmetric district with
 $I_D\approx 0.71$. We conclude that gerrymandered districts constructed via our Genetic Gerrymandering algorithm typically lead to highly noncompact districts for realistic distributions of voters.
These results suggest that if redistricting were restricted by compactness constraints then the extent to which one can impact an election could be curtailed, and many aggressive gerrymandering methods (in particular our own) would be less effective. Thus, this provides further support for the need for democratic governments to place some form of compactness requirement on redistricting schemes, and complements similar arguments and findings presented in for example (Schwartzberg, Reference Schwartzberg1966; Polsby and Popper, Reference Polsby and Popper1991; Altman, Reference Altman1998; Hodge et al., Reference Hodge, Marshall and Patterson2010; Humphreys, Reference Humphreys2011; Chou et al., Reference Chou2014; Bowen, Reference Bowen2014)
6 Application to Partisanship Trends in the United States
In the previous sections, we have applied our algorithms to the task of gerrymandering some benchmark voter models with multiple high density centers of partisan polarisations. While these toy models are perhaps not representative of realistic U.S. partisan distributions, the configurations of models #1–#4 provide a good test of the districting algorithms developed here since they are challenging to gerrymander effectively. In this section, we turn to consider an alternative voter model inspired by observations of voting patterns in the United States.
A common trend which has been noted that in the United States is that typically urban centers vote for the (relatively left leaning) Democratic Party, and the average voter is generally more likely to vote for the (right wing) Republican party as population density decreases (Politicalmaps.org, 2016). Indeed, it has been widely reported that “small-town and rural areas tilt so much more toward the GOP than urban areas” (Brownstein, Reference Brownstein2018). We next outline a lattice voter model to represent this general trend which leads to a distribution which favors Democrats near the population peak and the voter extremity transitions to increasingly favor the Republican Party as population density decreases.
We first highlight that a logistic curve is an intuitive model for population density, since as one approaches an urban center it is reasonable to expect that the population density grows exponentially at first and then subsequently starts to saturate as one approaches the central region. In particular, consider the following function (which builds on a logistic function)
 $$ \begin{align} \begin{aligned} L(\Delta)=M_0 \times \Delta_{\textrm{Max}} \left[\left(1 - \frac{\Delta}{\Delta_{\textrm{Max}}}\right) - \frac{1}{1 + \exp\left[k (\Delta_0 - \Delta)\right]}\right], \end{aligned} \end{align} $$
where  $\Delta $ is the radial distance from the population peak,
 $\Delta _{\textrm {Max}}$ is the average maximum distance of units from the peak as determined by the lattice size (for
 $21\times 21$ lattice this is
 $\Delta _{\textrm {Max}}\approx 12$),
 $\Delta _0$ is the distance at which partisanship is neutral and the parameters
 $M_0$ and k control aspects of the shape and magnitude of the function. The inclusion of the
 $(\Delta /\Delta _{\textrm {Max}})$ term modifies the standard logistic function to make the partisan falloff more gradual.
We realize the urban–rural distribution in lattice voter models via a single central blue source point at  $(0,0)$ and
 $4n$ (for
 $n\in \mathbb {N}$) red sources distributed symmetrically on the perimeter of the lattice with equal partisan strength
 $E_R$. Therefore, on a
 $21\times 21$ lattice, a model which well characterizes the observed partisan distribution can be found taking
 $n=2$ with red source points at:
 $ \{(-10,-10),~ (10,-10),~ (10,-10),~ (10,10), ~(0,-10),~ (0,10),~ (-10,0),~ (10,0)\}.$ Let us consider the case that the territorial net vote is balanced, this can be arranged by judiciously fixing the relative magnitudes of the source points, with
 $E_B=-1$ and
 $E_R\approx 0.7$.
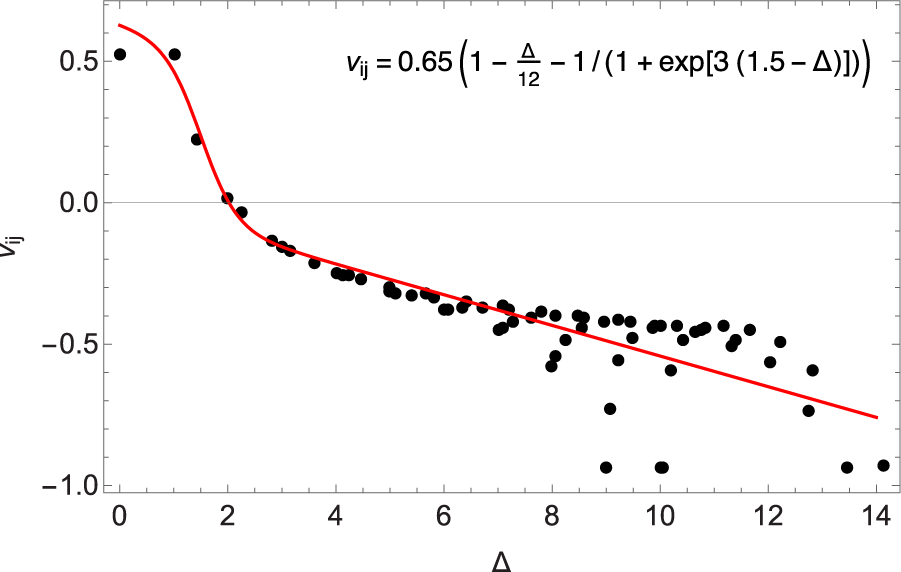
In Figure 9, we compare the expression of Equation (10) with the  $v_{ij}$ values of every unit produced from our code. We find that the radial partisanship distribution produced by the code can be reasonably approximated by the logistic function of Equation (10) with
 $M_0\approx 0.05$ and
 $k=3$ with
 $x_0$ fixed to the point at which
 $v_{ij}\approx 0$ in the lattice data, being
 $x_0\approx 1.5$ in this case.
Voter extremity  $v_{ij}$ as a function of distance from centre
 $\Delta $ for a
 $21\times 21$ lattice with urban-rural model source point distribution. Each point is the
 $v_{ij}$ of one or more territorial unit (some points are degenerate) and the lattice model is seen to reasonably approximate the trend of the modified logistical curve (red, solid) of the form stated.

To study territories with balanced total votes in this set up, we must either change the Binomial distribution parameters of our population model to arrange for a more sharply peaked distribution than the default model used in earlier sections or add a density spike in the central region. Specifically, in the analysis below we implemented a density spike on top of the initial Gaussian distribution by including a second randomly walking population with a very restricted number of moves. In our study below, we restricted the second walker population to 3 moves and set the population of the second group to be 40 times that of the first walker population. Thus, this construction gives a sharply peaked population in the central few lattice sites appended with shallow Gaussian tail, such that taking the extremity distribution of the urban–rural model results in a balanced vote for the territory .
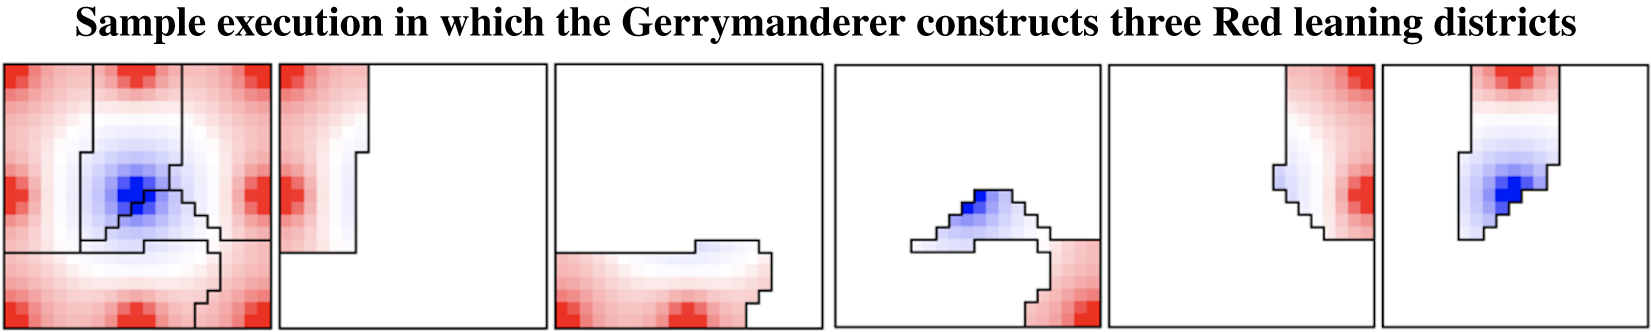
The purpose of this voter model is to better imitate representative U.S. partisan distributions by gradually altering the partisanship from left-leaning to right as distance from the urban center is increased. Note that unlike the previous models of Table 1 which had a Red $\leftrightarrow $Blue interchange symmetry, the placement of sources is very different for the two partisan extremities and thus it is interesting to consider how either party would best gerrymander a given territory. We apply our Genetic Gerrymandering algorithm to this distribution, and illustrations of the gerrymandered districts which favor the Red party is shown in Figure 10. Furthermore, we can run the algorithm multiple times following the Monte Carlo approach of Section 5 and in Tables 11 and 12, we present the expected district net vote, isoperimetric quotient, and number of district wins in the case that a gerrymanderer divides a balanced territory into five districts favoring first the Blue Party and then the Red Party.
Average district vote share (%) for a model of U.S. partisanship after Genetic Gerrymandering.

Isoperimetric quotients for a model of U.S. partisanship after Genetic Gerrymandering.

Genetic Gerrymandering applied to a realistic U.S. partisan distribution. The party which occupies the population peak is shown blue to indicate a match to the tendency for urban centers to lean toward the Democratic Party. The example shows a territory with balanced vote is gerrymandered such that the Blue party is expected to win three out of five districts.

Comparing with the previous applications of the Genetic Gerrymandering algorithm in Tables 8 and 9, we observe that the method is comparably effective for voter extremities modeling the rural–urban split, however, the isoperimetric quotients scores are noticeably worse. The expected number of district wins is approximately 4 (out of 5) for gerrymandering in favor of the Blue Party, which provides a notable benefit to the Blue Party. For the Red Party this is seen to be a similar result of 3.8 expected wins, which is a significant advantage. This is comparable to the results for the benchmark models of Table 1 for which the expected number of districts wins was approximately 3.7 out of 5.
7 Summary and Conclusions
The assignment of power to the electorate is the fundamental strength of representative democracies. Political gerrymandering, if left unchecked, threatens to undermine democratic systems. Since gerrymandering issues can be formulated as well-stated mathematical problems, one can develop tools and tests to identify and inhibit such practices.
We have presented a number of tools for studying gerrymandering and used these to examine central questions to gerrymandering. A lattice model for population distributions was developed and we proposed several algorithms to partition lattice territories into gerrymandered, equal-population, connected (or mostly connected) districts. We used our lattice model to argue that the method of Friedman and Holden (Reference Friedman and Holden2008) is unrealistic since it generally leads to disconnected districts. However, the techniques of packing and cracking remain central tools for gerrymandering, and we carried these ideas in constructing our own algorithmic approaches. To this end, we developed three novel gerrymandering algorithms, SRFH Packing, Saturation Packing and Genetic Gerrymandering, and example executions of these strategies are shown in Figures 6–8. Moreover, we subsequently applied our Genetic Gerrymandering algorithm to study a voter models of the rural-urban partisan divided which has been observed in U.S. congressional districts.
The probabilistic population fluctuations inherent to our voter models, allowed us to employ Monte Carlo methods to study the effectiveness of our gerrymandering algorithms. We found that Saturation Packing, the blunt strategy of packing opposition voters into a small number of districts, provided the most effective manner to secure district for a balanced vote. Moreover, our Saturation Packing algorithm led to a less fractured final district than SRFH Packing, with around 25% fewer components. Genetic Gerrymandering was highlighted as our most complete algorithm, since it outputs districts which are connected with balanced populations as typically required to be legally valid, and moreover the model presented won 70% of districts on average for the gerrymanderer in the trials ran.
This work is focused on providing a “proof-of-principle” regarding the potential of lattice studies for gerrymandering with the aim of identifying general classes of algorithms might be most well suited for redistricting problems. The next logical step for this research direction would be a systematic analysis of diverse theoretical configurations and studies using real world data. In particular, to provide robust claims regarding the impact of gerrymandering to the likely number of districts wins and isopermetric quotient score one should undertake a comprehensive analysis that systematically considers different partisan and population distributions in the context of a specific gerrymandering algorithm. Moreover, it would be insightful to consider different population distributions other than quasi-Gaussian distributions centered in the middle of a square grid, including the addition of natural boundaries, such as coastlines and rivers. Such natural boundaries could be reasonably included within a lattice model with predefined units with zero population during the construction of the population model.
Another important aspect that we will study in subsequent work is to explore the application of such lattice models to real world data. One clean and simple study which may be insightful would be to extract a trend line for the vote margin X as a function of population density  $\rho $ and then define a function
 $v_{ij}(\rho )$ which reproduces the trend line, replacing the source model of voter extremity used here. Indeed, there are several other extensions of our algorithms which would be interesting to explore, such as incorporating third-party candidates and nonvoting electors. Furthermore, our current algorithms assume complete knowledge about the population distribution and voter preferences, but in reality, a gerrymanderer has imprecise information about these distributions, which leads to uncertainty in the voter preference distributions. Voter uncertainty can be implemented by allowing each
 $v_{i,j}$ to have some probabilistic fluctuations. One might also implement “voter shocks” to model swings in the popular vote by
 $\mathcal {O}(10\%)$ after redistricting is complete, as discussed in Friedman and Holden (Reference Friedman and Holden2008). Both of these extensions directly affect the required vote threshold w, since if w during redistricting is not sufficiently large, the proponent party may lose the election.
We used the outputs of our gerrymandering algorithms to empirically argue that gerrymandering can provide a significant advantage for the gerrymanderer’s party, and that the partisan connected districts output by our algorithms typically fail isoperimetric quotient tests. Notably, while connectivity is legally mandated, compactness is not always. Thus, our work adds further support for implementing some legally mandated compactness requirements for redistricting to inhibit political gerrymandering.
Acknowledgments
We would like to thank Tanya Khovanova and the editor, replicator, and anonymous referees for helpful interactions, also Fidel I. Schaposnik Massolo and Laura P. Schaposnik for comments on a draft of the manuscript. J.U. is grateful to the Simons Center for Geometry and Physics (Program: Geometry and Physics of Hitchin Systems) for their hospitality and support. This research was undertaken as part of the MIT-PRIMES program.
Data Availability Statement
The replication materials for this paper can be found at Gatesman and Unwin (Reference Gatesman and Unwin2019).
Supplementary Material
For supplementary material accompanying this paper, please visit https://doi.org/10.1017/pan.2020.22.