I. INTRODUCTION
Gas sensors are widely used in different fields of application, like in intelligent process management, environmental protection, security, and medical diagnostics. To fulfill the growing demands of these rapidly evolving fields, the fast development of highly sensitive and selective gas sensor materials is essential.
Most commonly applied gas sensors are metal oxide-based conductometric or resistive sensors, so-called chemiresistors. These sensors rely on a change in electrical resistance upon surface reactions with reactive analyte gas(es). That achievement goes back to Brattain and BardeenReference Brattain and Bardeen1 for Ge and to HeilandReference Heiland2, Reference Heiland3 for the semiconducting ceramic ZnO. Then, Seiyama et al.Reference Seiyama, Kato, Fujiishi and Nagatami4, Reference Seiyama and Kagawa5 and TaguchiReference Taguchi6 further developed the concept toward the first commercial product—a fire alarm sensor. The metal oxides, which are in use today, are predominantly SnO2, ZnO, TiO2, WO3, and In2O3.Reference Eranna, Joshi, Runthala and Gupta7 More recent examples are mainly based on ternary oxides, such as rare-earth perovskites, LnBO3 (Ln = lanthanide series; B = Cr and Fe), which are also applied as materials in electrodes of fuel cells,Reference Yokokawa, Sakai, Horita and Yamaji8 (photo)catalysts,Reference Xinshu, Honghua and Guogang9, Reference Peña and Fierro10 and magneto-optics.Reference Keller, Mistrik, Visnovsky, Schmool, Dumont, Renaudin, Guyot and Krishnan11 In particular, several orthoferrites of which LaFeO3 and SmFeO3 are the best studied materials among this class of substancesReference Martinelli, Carotta, Ferroni, Sadaoka and Traversa12, Reference Niu, Du and Du13 have been investigated with respect to CH3OHReference Arakawa, Tsuchi-ya and Shiokawa14 and NO2 sensitivity.Reference Aono, Traversa, Sakamoto and Sadaoka15 Most recently, LaFeO3 has been the subject of first-principles studies of the molecular oxygen adsorption on Fe ion sites,Reference Liu, Hu, Cheng, Qin, Zhao and Yang16 and LnFe0.9Mg0.1O3 (Ln = Nd, Sm, Gd, and Dy) has been tested for C2H5OH sensitivity.Reference Liu, Hu, Cheng, Qin and Jiang17 Ilmenite oxides, such as CoTiO3, in combination with Ta2O318 have been applied for humidity detection, while the p-type semiconductor CoTiO3was initially published as an ethanol detecting material in 1999.Reference Chu, Liu, Wang and Meng19
A way to overcome the limitations of such oxides in terms of selectivity is the application of foreign elements or oxides for surface and volume doping. The material doping widens up the parameter space since, besides the chemical composition and doping, processing parameters, microstructure, electrode layout, etc. have to be taken into account. However, so far, progress in this field has been made mainly empirically, i.e., in a one-by-one approach, since descriptors for such multicompound and multiparameter systems are missing.
The development of structure–property relations and finally descriptors for such complex systems would be desirable, which rely on large data sets holding a high confidence level. The application of high-throughput experimentation (HTE) and combinatorial techniques may be an appropriate way to cope with this challenge because they allow for keeping most parameters constant while selectively varying just one. Thus, these methods accelerate both the sample preparation and characterization by ensuring identical sample processing as well as the systematic evaluation of reliable statistical data.Reference Potyrailo and Mirsky20
This review gives an overview about the advances in the application of HTE for the development of novel resistive gas sensor materials and for the analysis of structure–property relations. It will acquaint the reader with the important quality factors of chemiresistors and their working principle together with the influence of microstructure and doping on the sensor performance (see Sec. I) and will introduce a high-throughput approach developed for accelerated impedimetric screening of resistive gas sensor materials (see Sec. II). Selected examples for illustrating improved sensor performance as well as structure–property relations will be given (see Sec. III), and finally, the opportunities and limitations of the approach will be discussed (see Sec. IV).
A. Quality factors
An ideal gas sensor responds precisely and immediately to the prevailing ambient chemical or atmospheric conditions. The four quality factors, which quantify the sensor performance, are the sensitivity, selectivity, response time, and stability.
The sensitivity S is defined as the ratio between output signal and measured property. For chemiresistors, it is described as the ratio of the change in output signal y, i.e., the change in electrical resistance, to the concentration x of the analyte gas [Eq. (1)].Reference Kohl and Waser21 Hence, the sensitivity describes the sensibility of a sensor material to detect a certain analyte concentration from an ambient atmosphere. Very often, the sensor response is given instead of the S to express different calculated ratios of the analyte resistance to the reference resistance (see Sec. II. D).
 $$S\, = \,{{dy} \over {dx}}\quad.$$
The selectivity Q reflects the ability of a sensor to differentiate between the specific gas x to be detected and the other components of gaseous environment x′ and expresses the cross-sensitivity [Eq. (2)].
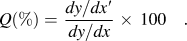 $$Q(\% ) = \,{{dy/dx\prime} \over {dy/dx}}\, \times \,100\quad.$$
The response time expresses numerically the attended response or recovery time Δt 90% of the output signal to reach 90% of its saturation value after turning on or off an analyte gas.Reference Kohl and Waser21 It is determined by the chemical reaction kinetics between material surface and analyte molecules and, therefore, by diffusion processes and surface reactions.
The stability describes the long-term stability of a sensor material in maintaining its output signal over a longer period of time and in detecting systematically varying concentrations of analyte gas. It reflects the reproducibility of a measurement and can be affected by (thermal) aging of the sensor layer as well as by poisoning of the sensor’s surface comparable to the properties of catalysts. The stability concerns both the structural and the electrophysical properties of the sensor material during long-term operation, which is an often neglected demand in research but essential for commercial products.
B. Working principle
Since the first generation of chemiresistors was based on unmodified binary metal oxides, e.g., SnO2, In2O3, ZnO, Fe2O3, WO3, etc., the present model of their working principle was developed from their most abundant applied examples.Reference Eranna, Joshi, Runthala and Gupta7, Reference Bârsan22 Thus, of these n-type semiconductors in which charge transport results from mobile electrons, SnO2 applied in Taguchi sensorsReference Taguchi6 (Figaro Engineering Inc., Osaka, Japan) and In2O3 are the best investigated materials.Reference Bârsan, Schweizer-Berberich and Göpel23–Reference Korotcenkov25 Nowadays, p-type semiconductors, e.g., CoO and perovskite structures such as LnBO3(Ln = lanthanide series, B = Cr and Fe) in which charge transport occurs via holes, are also used.Reference Eranna, Joshi, Runthala and Gupta7
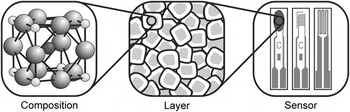
The active element of a gas sensor device basically consists of an interdigital electrode structure coated with a porous sensing layer composed of nanocrystalline particle assemblies. Microscopically, the gas sensing is restricted to the particle surface, which interacts with the ambient atmosphere and serves as receptor for target molecules (Fig. 1). Then, the polycrystalline sensing layer is electrically conducting due to sintered grain contacts and acts as transducer along percolation paths. Macroscopically, the electrode structure provides the measurable signal in terms of an electrical resistance, i.e., the sensor response, and works as output of the entire sensing layer.Reference Yamazoe, Sakai and Shimanoe26, Reference Yamazoe27
Layout of chemiresistors: receptor (chemical composition of near sensing surface), transducer (idealized nanoparticle layer without sintering necks), and output function (coated and uncoated front as well as back of sensor element (from left to right)]. Adapted from Ref. Reference Yamazoe, Sakai and Shimanoe26.

Upon closer inspection, the sensing mechanism reveals preliminary physisorption via van der Waals forces and subsequent chemisorption via electron transfer of ambient oxygen at the nanoparticle surface. Thereby, the nature of the ionosorbed species ranging from molecular to atomic strongly depends on the prevailing temperature before, finally, their incorporation into the oxide lattice occurs.Reference Bârsan22, Reference Bârsan, Schweizer-Berberich and Göpel23 During the exothermal oxidation process, i.e., ionosorption, the oxygen species adsorbed at the surface become chemically bound and, consequently, constrain as electron acceptors the thereto required bonding electrons at the particle surface causing an electron-depleted region near the solid surface.Reference Samson and Fonstad28–Reference Göpel and Schierbaum31 Thereby, the surface coverage of oxygen ions, which is determined by the Weisz limitation, and their negative potential determine the depth of the positively charged space charge layer.Reference Weisz32, Reference Lampe, Fleischer, Reitmeier, Meixner, McMonagle, Marsch, Göpel, Hesse and Zemel33 According to the energy band model, the surface potential causes a bending of the valence and conducting band at the intergrain contacts with a barrier height of surface potential in the range of 0.5–1.0 eV. Thus, the layer depth, i.e., the Debye length, which is characteristic for every semiconductor and temperature, as well as the barrier height, i.e., Schottky barrier, are directly affected by the amount and nature of ionosorbed oxygen. According to the thermodynamic equilibrium condition of ionosorbed oxygen, the height of Schottky barrier determines the electron flow along the percolation paths leading to a specific total base resistance of the entire layer.Reference Barton, Merhari, Ferkerl and Catagnet34, Reference Madou and Morrison35
A shift of that equilibrium state is provoked by reducing gases, e.g., H2, CO, hydrocarbons, etc., via adsorption, intermediates, and consecutive reactions, which finally leads to a desorption of CO2 or a total oxidation to CO2 and H2O in case of CO or hydrocarbons, respectively.Reference Lenaerts, Honore, Huyberechts, Roggen and Maes36 During the desorption step of the reaction products, the previously localized electrons are released back to the bulk oxide, and hence, the electron density is reduced and the Schottky barrier is decreased. But on the contrary, oxidizing gases, e.g., NOx, SO2, O3, etc., supply additional surface oxygen via direct chemisorption and, thus, consume bulk electrons via incorporation into the oxide lattice. Altogether, the variable partial pressures of reducing and/or oxidizing analytes determine the total resistance of the sensing material, whereby in case of p-type semiconductors, the output occurs in opposite direction.
This idealized modelReference Ogawa, Nishikawa and Abe37 is simplified by the presence of adsorbable oxygen in (synthetic) air and can be extended by taking into account the detected analyte and the formed intermediates. Furthermore, depending on the prevalent atmosphere, a real systemReference Bârsan and Weimar38 suffers from water and other molecules, e.g., hydroxyl groups, carbonates, etc., which have a significant impact on the surface sites and chemical reactions at the surface. Since the reaction rate of surface chemistry generally depends on temperature, the working temperature strongly influences the elementary chemical processes at the surface and gas diffusion into the porous sensing layer. Thus, the sensitivity toward a specific and cross-sensitivity toward other analytes may reach a maximum and minimum at different temperatures, respectively.Reference Nemov and Yordanov39, Reference Pardo and Sberveglieri40 A more detailed description can be found elsewhere.Reference Franke, Koplin and Simon41–Reference Bârsan, Koziej and Weimar43
C. Microstructure
Besides the surface chemistry and working temperature, the microstructure of the material strongly influences the sensor performance. Thereby, the thickness and porosity define the total surface area, which is accessible for interpenetrating gas molecules.Reference Göpel and Schierbaum31, Reference Benkstein and Semancik44 For spherical particles, their size determines both the porosity of layer and, thus, the accessibility of surface. In case of large and middle sizes, i.e., >20 nm and 10–20 nm particles, the conductivity is dominated by the bulk as well as by both the particle size and grain boundaries, and thus, the sensor response is independent (>20 nm) and dependent (10–20 nm) on the average particle size, respectively. But in case of small sizes, i.e., <10 nm, the electron-depleted zones extend over the entire particle volume and lead to completely depleted energy bands. At this special case, which is commonly called “flat band condition,” the conductivity strongly depends on the particle size and the sensitivity significantly increases.Reference Yamazoe27, Reference Xu, Tamaki, Miura and Yamazoe45–Reference Rothschild and Komem47
Hence, an ideal sensor is composed of small nanoparticles in terms of a thin layer featuring macroporesReference Shimizu, Jono, Hyodo and Egashira48 to provide a large surface for analyte detection and extended percolation paths at the same time. Beyond that, various structural and electronic defects on the sensing surface are stabilized by the higher curvature of smaller particlesReference Korotcenkov49, Reference Schmidt-Mende and MacManus-Driscoll50 leading to an increased reactivity of different crystallographic faces and reaction kinetics.Reference Gurlo51, Reference Seyed-Razavi, Snook and Barnard52
D. Doping
The performance of sensor material in terms of sensitivity, selectivity, thermal aging, etc. can be modified via doping at which surface and volume doping are applied either to deposit doping elements as particles at the oxide surface or to incorporate them as constituent or secondary phase into the oxide lattice, respectively. In the present context, the term doping refers to any modification of a base material by addition of a foreign material and, thus, does not equate to the bulk doping of ultrapure materials by infinitesimally small amounts (ppm range) of highly dispersed impurities known from the semiconductor technology.
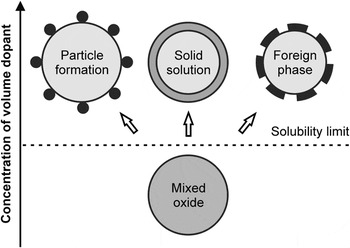
Volume dopants directly alter the material and sensor properties of base material because the additives, i.e., 1–10 wt%, are already introduced during the synthesis step. The resulting multicomponent materials exhibit new electrical, chemical, and physical properties due to the incorporation of inert, e.g., metal oxides, or catalytically active additives, e.g., transition metals. Thereby, even minor quantities of additives could lead to unpredictable new sensing properties, and beyond, mayor quantities, which extend the mutual solubility limit of host and guest, could moreover result in the segregation of layers or formation of phases, i.e., discrete particles, solid solutions or foreign phases (Fig. 2).Reference Korotcenkov53 The main interacting factors influenced by volume doping are related to the microstructure (e.g., network, morphology, crystallography, etc.), composition (e.g., elemental composition, stoichiometry, thermal stability, etc.), electrical property (e.g., electron exchange rate, free charge carriers, surface potential, etc.), and catalysis (e.g., catalytic activity, active phase, adsorption/desorption, etc.).Reference Korotcenkov49 However, the unpredictable impact on the sensing performance of a given base material still demands a basically empirical approach in search of ideal sensor materials since enhancement of one parameter might simultaneously degrade another.Reference Korotcenkov53
Layer segregation and phase formation of volume dopants above solubility limit of host and guest. Adapted from Ref. Reference Korotcenkov53.

Active surface dopants improve the selective interaction with the target analyte because they are deposited subsequent to the preparation of sensing material or layer, and thus, they are located as separate particles on top of the surface. The modification of sensing surface enhances both the sensitivity and selectivity by lowering reaction time and working temperature, which also increases the long-term stability. For the deposition by, for instance, impregnation or spraying techniques, typically, noble metals, e.g., Rh, Pd, Ag, Pt, Au, etc., transition metal oxides, e.g., of Fe, Co, Cu, Zn, etc., or main group elements, e.g., B, Se, etc., are applied as catalytically active dopants. Subsequent thermal treatment leads to a distribution of metallic or oxidic clusters at the sensing surface, which catalytically promote or inhibit chemical reactions. Besides the doping element, the sensing properties are tunable by the cluster dimension and intercluster distance whereby the sensitization can be achieved by using superficial clusters as well as atomically distributed Pt and Pd at (sub)surface sites.Reference Kappler, Bârsan, Weimar, Diéguez, Alay, Romano-Rodriguez, Morante and Göpel54, Reference Cabot, Arbiol, Morante, Weimar, Bârsan and Göpel55
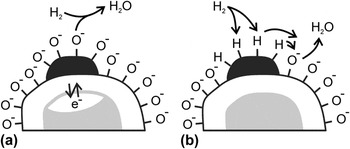
Basically, two mechanistic models, i.e., the electronic and chemical sensitization, explain the shift of maximum sensitivity to lower working temperatures.Reference Yamazoe27, Reference Korotcenkov53, Reference Morrison56, Reference Kohl57 In case of electronic sensitization [Fig. 3(a)], the space charge area is significantly enlarged by doping with strong electron acceptors, e.g., AgO/Ag, PdO/Pd, and CuO/Cu, and thus, the redox state and chemical potential are different toward analytes. This kind of sensitization is also specified as redox state changing.Reference Yamazoe27 In case of chemical sensitization [Fig. 3(b)], the surface reactions are catalyzed by doping with catalyst clusters acting as adsorption sites, and thus, activated fragments of the respective analyte are transferred to the sensing surface and the surface potential is lowered. This process of analyte activation is described as “spillover” effect.Reference Yamazoe27 In both cases, the conductivity and sensitivity of a sensor material are increased by applying reducing gases, e.g., H2. But also, dopant diffusion into the metal oxide lattice and (subsequent) alloy formationReference Tsud, Johanek, Stara, Veltruska and Matolin58, Reference Nehasil, Janecek, Korotcenkov and Matolin59 or synergetic effects of several dopants as in heterogeneous catalysis are feasible.Reference Ruiz, Cornet, Shimanoe, Morante and Yamazoe60, Reference Mohr, Hofmeister, Radnik and Claus61
(a) Electronic sensitization (i.e., redox state changing) and (b) chemical sensitization (i.e., analyte activation) by surface doping of base material. Adapted form Refs. Reference Yamazoe, Sakai and Shimanoe26 and Reference Yamazoe27.

Since nanoparticles and dopants are employed to increase the sensitivity and selectivity of a distinct base material, the crystallite shape can be applied as well for that purpose due to energetically different adsorption sites of crystal facets.Reference Gurlo51, Reference Seyed-Razavi, Snook and Barnard52 However, also, physical and chemical auxiliaries as porous or rather catalytic filters and oriented or functionalized membranes, e.g., zeolites, catalytic sieves, passive membranes, etc., are arranged in front of sensor devices to block parasitic or poisoning interferants.Reference Fong, Abdullah, Ahmad and Bhatia62–Reference Pijolat, Viricelle, Tournier and Montmeat67
The large number of variable parameters together with the unpredictable but significant influence of preparation history require novel methodologies for the rapid characterization of potential gas sensor materials. HTE turns out to be a promising step in this direction.
II. HIGH-THROUGHPUT EXPERIMENTATION
The “multiple sample concept” or rather the vision of HTE goes back to 1970 enabling the simultaneous processing of “expensive and time-consuming” steps in an integrated material development workflow.Reference Hanak68 It implements sample plates, which facilitate the parallel processing and easy handling of up to several dozen samples that are typically distinguished by a composition spread (gradient library of one parameter).Reference Hanak69 However, the large number of materials or compositions produced on a short timescale requires adequate rapid analysis and probing techniques at the same time. With respect to chemiresistor development, the impedimetric characterization, which is also applied in material development including superconducting,Reference Xiang and Schultz70 dielectric,Reference van Dover, Schneemeyer and Fleming71 magnetoresistive,Reference Briceño, Shang, Sun, Schultz and Xiang72 photochemical active,Reference Baeck, Jaramillo, Brändi and McFarland73 and catalytically active materials,Reference Reichenbach and McGinn74, Reference Hagemeyer, Strasser and Volpe75 has proven to be a valuable tool for the search of novel gas sensing materials.Reference Aramova, Chang, Tageuchi, Jabs, Westerheim, Gonzalez-Martin, Kim and Lewis76
Combinatorial approaches have helped to advance the conventional “empirical trial and error process” by intelligent combination of different materials or components of the synthesis workflow.Reference Dagani77 In a first step, an expanded diverse parameter space is constituted by the discovery strategy, i.e., primary screening, to find novel or alternative materials. To optimize hits of the primary screening and to narrow the parameter space, secondary screening follows, whereby a statistical and intelligent design of experiments should minimize the experimental operating expense and maximize the knowledge gained on the basis of multidimensional parameter optimization by descriptors, genetic algorithms, artificial neural networks, and, last but not least, by experience.Reference Maier, Stöwe and Sieg78
The here presented approach to search for novel and improved gas sensor materials is based on semiconducting nanoparticulate metal oxides and utilizes high-throughput impedance spectroscopy (HTIS). For the HTIS screening of various materials, multielectrode array substrates were designed, on which 64 different samples can be electrically characterized independently.Reference Simon, Sanders, Jockel, Heppel and Brinz79–Reference Simon, Sanders, Jockel and Brinz81 The advances by using the high-throughput setup to gain information about the complex interplay between base material, doping element, and the gas phase are described to understand how this interplay is affected by the different control parameters, such as temperature and processing conditions. The gain in knowledge will be demonstrated by selected examples illustrating the effect of volume and surface dopants as well as the effect of particle size on the sensing material.
A. Sensor fabrication
For the preparation of metal oxide nanoparticles, the so-called polyol synthesis was applied. This method allows an easy control of chemical composition on the molecular (precursor) level, low processing temperatures, and application to substrates of any size and shape.Reference Figlarz, Fiévet and Lagier82–Reference Siemons, Weirich, Mayer and Simon87 Thus, this procedure overcomes some drawbacks of conventional solid-state reaction techniques, such as high calcination temperatures and formation of by-products. Thereby, “polyol” stands for polyalcohols with high boiling temperatures providing sufficient solubility for inorganic salts or complexes. The polyol acts as a chelating solvent widely suppressing agglomeration of the particles formed. Hence, the method allows for preparing a wide range of high-purity binary and multinary oxides with high specific surface area and flexible volume doping. A detailed description of the reaction procedure applied in our works can be found elsewhere.Reference Siemons, Weirich, Mayer and Simon87–Reference Siemons and Simon89
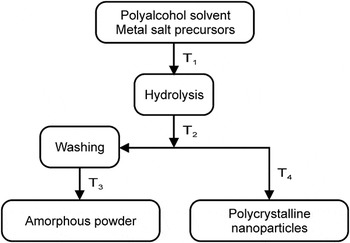
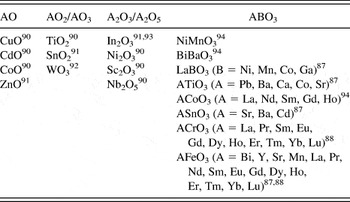
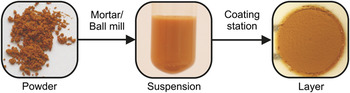
In brief, in a typical experiment, precursors are dispersed in diethylene glycol and the resulting mixture is heated up to T 1 (80–140 °C) under vigorous stirring until a clear solution is obtained. If necessary, a surplus of hydrolysis agent is added to cause precipitation of the product. The emerging suspension is heated for several hours up to T 2 (160–190 °C) and, subsequently, cooled to room temperature. To obtain amorphous material, the suspension is dried at T 3 (<80 °C), and to yield crystalline material, it is annealed at T 4 (500–900 °C) for 2–12 h. For each individual synthesis, the reaction parameters need to be optimized with respect to particle size, yield, and purity. Figure 4 illustrates the workflow, which has been applied, while Table I shows the different (volume-doped) materials, which have been prepared by the polyol method.
Polyol-mediated synthesis to yield base and volume-doped materials.

Base and volume-doped materials prepared via polyol method.

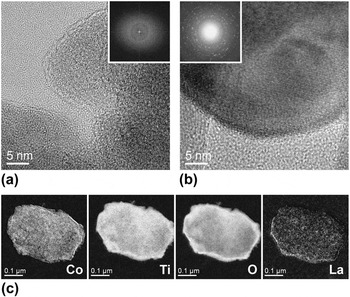
For all materials synthesized, so far, the initial characterization was carried out by powder x-ray diffraction (XRD) measurements on thin films in transmission. Powder morphology was examined by scanning electron microscopy (SEM) and transmission electron microscopy (TEM) analysis. X-ray fluorescence spectroscopy (XRF) was used to image the element distribution in the samples. For SrTiO3, Fig. 5 exemplary shows the material analysis by high resolution TEM (HRTEM) and fast Fourier transformation (FFT) as well as energy-filtered TEM (EfTEM).Reference Siemons94, Reference Siemons and Simon95
Analysis of CoTiO3 volume doped by 2 at.% La (supposed in A-position of ABO3) via HRTEM images and FFTs (insets) of (a) amorphous (400 °C/1 h) and (b) crystalline (700 °C/1 h) material, respectively, and (e) EfTEM images of single particle concerning composition elements (Co, Ti, O, and La; no gray scale available).Reference Siemons94, Reference Siemons and Simon95

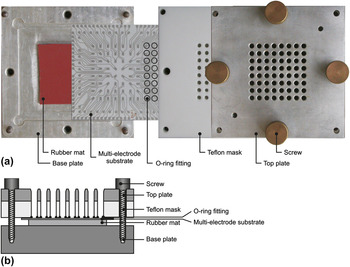
For deposition as thick films (Fig. 6), the powder material was dispersed by mixing in a mortar or in a ball mill with a solution of poly(iminoethylene) in water. The obtained suspension was directly applied to the electrode structure by using a coating station [Fig. 7(a)].Reference Koplin91, Reference Siemons, Koplin and Simon96 The station consists of a Teflon block equipped with 8 × 8 array of holes, which are sealed by an O ring fitting against the electrode substrate [Fig. 7(b)], forming 64 wells (214 μL volume each). The base and top plate keep the configuration together whereby a rubber mat evenly distributes the pressure from the screws on the embedded multielectrode substrate (MES). For the coating of an entire MES, multiple suspensions were pipetted into the 64 wells of the coating station in such a way that each material is statistically applied several times. Finally, the sample materials are dried and calcinated to give sensor layers.
Sensing layer deposition via coating station: powder material, material suspension, and sensing layer (thick film) on top of electrode structure. Adapted from Ref. Reference Siemons94.

Coating station: (a) single parts (photograph; top view), adapted from Ref. Reference Siemons, Koplin and Simon96, and (b) ready to use device (graph; lateral cut), adapted from Ref. Reference Koplin91.

This synthesis procedure and station design are well suited for efficient and automated preparation and coating through a pipetting robot.Reference Koplin91
B. High-throughput setup
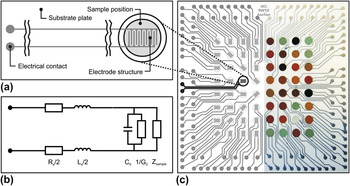
For rapid impedimetric screening, screen-printed platinum leads form an 8 × 8 array of 64 interdigital capacitors [IDCs, Fig. 8(a)] on an alumina substrate (side length of 105 mm). The corresponding circuit equivalent is needed to describe the individual electrical properties of different IDCs on a MES [Fig. 8(b)]. Each IDC of MES [Fig. 8(c)] has a structure width of 110 μm and each well has a diameter of 5 mm, being capable for resistive as well as for capacitive measurements.Reference Simon, Sanders, Jockel, Heppel and Brinz79, Reference Franzen, Sanders, Jockel, Scheidtmann, Frenzer, Maier, Brinz and Simon80, Reference Siemons and Simon97
Interdigital electrode structure: (a) IDC layout in detail (graph), (b) corresponding equivalent circuit, and (c) MES layout of uncoated (left; graph) and coated (right; photograph) substrate whereby well 34 is highlighted. Adapted from Refs. Reference Simon, Sanders, Jockel, Heppel and Brinz79 and Reference Siemons and Simon97.

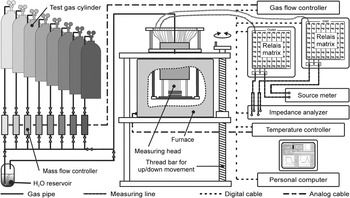
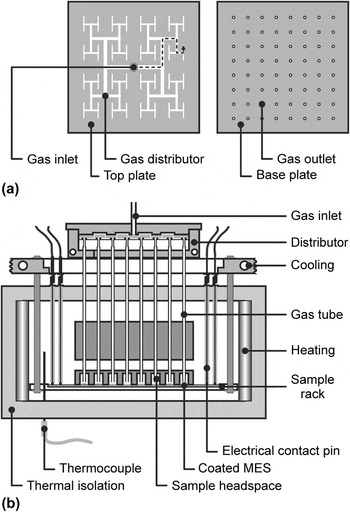
The HTIS working station consisting of gas supply, measuring station, and instrumental equipment (Fig. 9) enables the processing of time-consuming process steps like heating up or sample conditioning in parallel. Thereto, coated sample plates are inserted into the measuring head [Fig. 10(b)] whereby the leads to each IDC are electrically connected via Al2O3-covered platinum wires in the measuring head. Spring-loaded contact tips ensure constant contact pressure and connect the IDCs via high frequency capable relay matrices (multiplexers) to the measuring instruments. The composition of the test gases is managed via gas flow controllers and can be humidified by bubbling the carrier gas through a water reservoir at defined temperature. A gas distributor with T-tree geometryReference Bergh and Guan98 [Fig. 10(a)] equally splits the incoming gas stream and provides an almost equal gas flow to the individual headspaces of each sample position.Reference Simon, Sanders, Jockel and Brinz81, Reference Koplin91, Reference Siemons, Koplin and Simon96
HTIS working station: gas supply, measuring station, and instrumental equipment (just 2 of 128 measuring lines are exemplified, i.e., well 11).

Measuring head and furnace of HTIS station: (a) gas distributor with stream splitting by binary tree (top view) and (b) individual gassing of sample positions on embedded MES (lateral cut; one path of gas flow is exemplified by dotted arrow). Adapted from Refs. Reference Koplin91and Reference Siemons, Koplin and Simon96.

C. High-throughput screening
The sensor experiments are typically carried out within an intended temperature range in 25 or 50 °C steps to approach the best working temperature of respective material setting. Starting at the highest temperature avoids material sintering and aging during the subsequent electrical measurements. Before each measurement, a preliminary gas flow was held for 30 min to reach adsorption equilibrium except for the highest and every subsequent lower temperature at which the conditioning time is extended to 240 and 90 min, respectively. For the screening of sensitivity and selectivity, a standardized gas sequence consisting of alternating (humidified) synthetic air serving as reference and certified test gases of different concentrations are applied with a constant gas flow of 100 sccm. Thereby, all test gas measurements are followed by a measurement in reference atmosphere to investigate the reversibility of material response. At each temperature and gas atmosphere, the impedimetric characterization is carried out in a frequency range from 10 to 107Hz with 15 measuring points per frequency decade and an amplitude of 0.1 Vrms. The electrical screening of all sample positions of MES requires about 25 min at a particular atmosphere and temperature.
D. Data evaluation and visualization
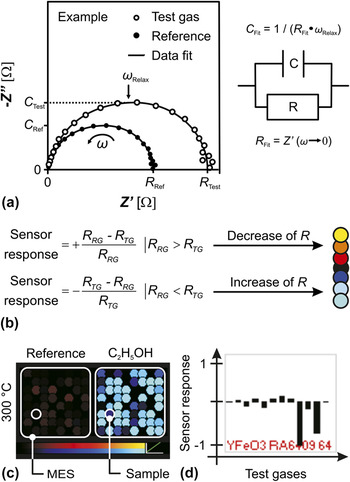
For data reduction and evaluation, the measured impedance data are visualized in terms of Argand plots, i.e., the real part Z′ versus the imaginary part −Z″ of complex impedance [Fig. 11(a)]. Automated data fitting is performed by adapting impedance functions of a corresponding circuit element, i.e., a resistor R and capacitor C in parallel. This procedure reduces the electrical material properties to one value each for the resistance R and the capacitance C, respectively. After the enormous reduction of measurement data, the value C is related to the geometric capacitance of electrode structure and R to the extrapolated DC resistance. Hence, a resistance change compared to the initial reference condition is used for the evaluation of material sensitivity at a particular test gas atmosphere. The fitting by a single RC circuit equivalent was adequate concerning the examples reported herein.
Reduction and visualization of measurement data: (a) Argand plot (left) with data fits of impedance functions by circuit equivalent (right), adapted from Ref. Reference Siemons, Koplin and Simon96, (b) calculation of sensor response (left) and corresponding color code (right), (c) Trellis plot detail due to reference and test gassing of MES at distinct temperature, and (d) fingerprint detail concerning total sequence of reference and test gassing of discrete sample.

The sensor response represents the material response toward the respective test gas and measurement condition whereby R TG and R RG stand for the resistance fit under test gas and reference gas conditions, respectively [formula in Fig. 11(b)]. If the resistance is decreasing or increasing under test gassing, the values of sensor response will range from 0 to 1 or 0 to −1, respectively. The application of the mentioned formula for sensor response basing on the initial reference state in contrast to the commonly used sensor response = R RG/R TG and sensor response = R TG/R RG in case of R RG > R TG and R RG < R TG, respectively, allows for the simple discrimination of oxidizing and reducing analytes or n-type and p-type semiconductors, respectively.
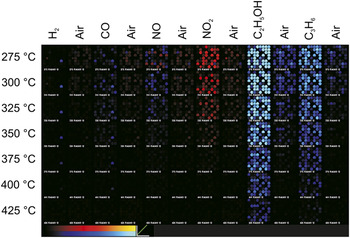
The changes in resistance are translated into a multicolor code depending on the direction and extent of particular change [Fig. 11(b)]. Regarding a MES, the color changes are visualized by means of Trellis plots [Fig. 11(c) left], whereby the dot diameter scales down with the measuring failure provoked by data scattering or measurement limits. Hence, the 8 × 8 square matrix illustrates the sensor response of a MES at a distinct temperature and test gas atmosphere and, thus, reflects the changes toward the initial state (reference). Moreover, further investigations of a discrete material are achieved by means of fingerprints [Fig. 11(c) right] regarding the total sequence of gases at a single temperature. Plotting the fingerprints of all MES positions as array enables the comparison of characteristic patterns for materials of the same composition due to their statistical distribution. Both kinds of data visualization, the Trellis plot and fingerprint, help to easily identify the materials with the best gas sensing performances.Reference Frantzen, Sanders, Scheidtmann, Simon and Maier99
A Trellis plot for seven different temperatures (275, 300, 325, 350, 375, 400, and 425 °C) and the sequence of six test gases (H2, CO, NO, NO2, C2H5OH, and C3H6) are shown in Fig. 12 belonging to a MES coated with various volume-doped LnCrO3 and LnFeO3 materials.Reference Siemons, Leifert and Simon88 According to the definition of sensor response [see formula in Fig. 11(b)], the perovskite materials (LnMO3) show p-type semiconducting behavior. Most of the tested samples possess a pronounced sensitivity toward the applied hydrocarbons, while the sensitivity toward C2H5OH is much higher than toward C3H6 and a good reversibility on the timescale of the experiment. Further, the samples exhibit less cross-sensitivities toward the other test gases and, especially, NO2, which vanish at higher temperatures.
Trellis plot of MES coated with various LnFeO3 and LnCrO3 materials visualizing the sensor response toward sequence of alternating reference and test gassing (synthetic air and H2, CO, NO, NO2, C2H5OH, and C3H6, respectively) at several temperatures (275–425 °C in 25 °C steps).

In Sec. III, selected examples will illustrate the material screening by introducing results for surface and volume doping representing the reproducibility of preparation and measurements that finally lead to the discovery of new gas sensing properties and structure–property relations.
III. SELECTED EXAMPLES
The HTE approach exhibits good reproducibility of both preparation and measurement, the rapid characterization of sensor properties, and finally, the nontrivial finding of structure–property relations. In the following three studies, the surface and volume doping as well as the particle size are the respective parameters under investigation.
In case of surface-doped In2O3 at 250–400 °C (see Sec. III. A)Reference Sanders and Simon93 as well as of volume-doped LnCrO3 and LnFeO3 (Ln = lanthanides) at 200–500 °C (see Sec. III. B and III. C),Reference Siemons, Leifert and Simon88 the synthetic air was humidified [relative humidity (RH) = 45% at 25 °C] and used as reference. As certified test gases, 25 ppm H2, 50 ppm CO, 5 ppm NO, 5 ppm NO2, 40 ppm C2H5OH (not in the In2O3 case), and 25 ppm C3H6 each in synthetic air were applied. However, for NO tests, N2 was chosen as balance to avoid NO2 formation. In case of different sized Fe3−xO4 at 50–300 °C (see Sec. III. C),Reference Belle, Bonamin, Simon, Santoyo-Salazar, Pauly, Bégin-Colin and Pourroy100 500 ppm CH4, 10 ppm NO, 500 ppm H2, and 100 ppm NH3 were used as test gases, and dry N2 was applied as balance (except of argon in the H2case).
A. Surface doping
For n-type semiconductor In2O3, a material and data library of corresponding preparation and experiment parameters was generated on the basis of previous works.Reference Sanders, Siemons, Koplin, Simon, Lu, Hahn, Weissmuller and Gole101 Since the base metal oxide of all samples has been derived from a single synthesis, the qualitative and quantitative diversity of material was achieved by various surface dopants and dopant concentrations. Thus, the respective study dealing with three different MESs (as described in the following three paragraphs) aimed at the reproducibility of identical samples, diversity of doping elements, and sensor performance of dopant concentration.Reference Sanders and Simon93
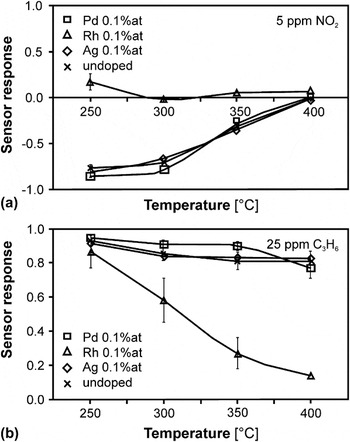
At 1st MES, the reproducibility of material preparation and homogeneity of sensor behavior were proven by comparison of the sensor responses of the undoped In2O3 and three doped samples (i.e., 0.1 at.% Pd, Rh, and Au) resulting in 16 sample positions. The good homogeneity of temperature-dependent sensor responses toward the analytes H2, NO, NO2 [Fig. 13(a)], and C3H6 [Fig. 13(b)] was confirmed by minor standard deviations. In contrast, significant deviations were found concerning the sensor responses toward CO caused by the catalytic activity of some materials, and thus, the conversion of CO with ambient O2 resulted in a concentration gradient of that analyte along the MES. The undoped In2O3 exhibited a higher sensor response toward reducing (i.e., H2 and C3H6) and oxidizing analytes (i.e., NO and NO2) due to a resistance decrease and increase, respectively, at lower temperatures. Among the surface dopants, Rh showed the most pronounced effect on the sensor performance because it nearly suppressed the cross-sensitivity toward NO2, changed the NO character from oxidizing to reducing at lower temperatures, and gave the highest sensor response toward H2at 250 °C.
Sensor response of In2O3-based samples (i.e., undoped and surface doped by 0.1 at.% Ag, Rh, and Pd) toward (a) 5 ppm NO2 and (b) 25 ppm C3H6 depending on temperature. Adapted from Ref. Reference Sanders and Simon93.

At 2nd MES, the influence of doping element on the sensor properties was widely screened by the quantity of doping elements at a single concentration (i.e., 0.1 at.%). All the In2O3-based materials under investigation possessed a high sensitivity toward reducing analytes (i.e., H2 and C3H6), but only noble metal-doped materials (i.e., Rh, Pd, Pt, Ag, and Au) showed an increased CO sensitivity. The oxidizing analytes (i.e., NO and NO2) typically caused an increasing resistance leading to an irreversible and totally reversible change under reference gassing at the lowest and higher temperatures, respectively, on the timescale of the respective experiment (15 min). Furthermore, Ir and Rh doping of base material decreased the resistance toward NO, whereby in case of Ir, the resistance increased during the reference gassing, and further, Ru and Ce doping decreased the sensitivity toward NO and NO2.
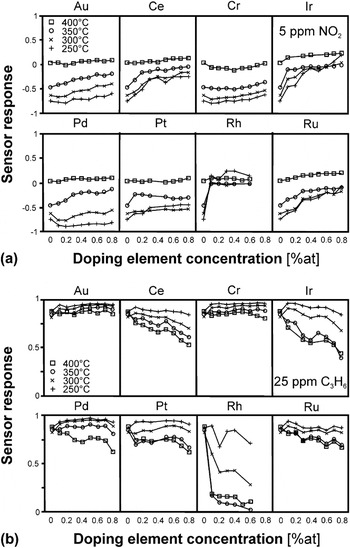
At 3rd MES, the influence of dopant concentration (i.e., 0–0.8 at.% in 0.1 at.% steps) on the sensor performance was further investigated selecting those elements that have already exhibited a significant impact on In2O3 performance (i.e., Cr, Ru, Rh, Pd, Ag, Pt, Ce, Ir, and Au). The surface dopants Rh, Ir, Ru, and Ce are grouped and assorted due to a similar and descending influence, respectively. The doping by these elements inverted the impact of oxidizing analytes (i.e., NO and NO2 [Fig. 14(a)]) into reducing analytes and simultaneously suppressed their oxidizing influence with increasing element concentration. Thereby, the impact of reducing analytes (i.e., H2 and C3H6 [Fig. 14(b)]) was depressed as well. The doping by Pt and by Cr, Au, and Pd generally decreased and increased the sensor response, respectively, except toward C3H6 at 250 °C and toward C3H6.
Sensor response of In2O3-based samples (i.e., surface doped by Au, Ce, Ir, Pd, Pt, Rh, Ru, and Cr) toward (a) 5 ppm NO2 and (b) 25 ppm C3H6 depending on doping concentration (i.e., 0–0.8 at.%). Adapted from Ref. Reference Sanders and Simon93.

Finally, the preparation of sensing layer and surface doping of base material were reproduced using single sensor substrates (SESs). The usage of SESs and corresponding working station is a vital intermediate step from the HTE screening process to the commercial sensor application since they are closer to a true application. The SES layout is in accordance with the described MES layout but the SES is equipped with only one IDC structure and an integrated heater on the front and back of a naturally smaller substrate (25 × 4 × 0.75 mm), respectively.Reference Koplin91 The sensor characterizations under these more realistic measurement conditions basically confirmed the results derived from using MESs, which means the NO2tolerance in NO sensing in the range of 200–300 °C.
In addition to the notified In2O3, other materials (based on, e.g., ZnOReference Koplin, Siemons, Océn-Valéntine, Sanders and Simon102 and CoTiO3Reference Siemons and Simon95) have been prepared by surface doping with various elements, combinations, and concentrations and characterized toward their performance as gas sensors.
B. Volume doping
For further investigations of previous experiments,Reference Siemons, Leifert and Simon88 two LnFeO3 and LnCrO3 base materials have been diversified by series of volume doping (i.e., Ln = La, Pr, Nd, Sm, Eu, Gd, Tb, Dy, Ho, Er, Tm, Yb, and Lu) and, then, tested with respect to sensor response, selectivity, and response time toward C3H6 and C2H5OH.Reference Siemons and Simon103 At this, the incorporation of rare-earth metal oxides into the base oxides generates new materials, which gradually differ in their chemical and physical properties from each other.
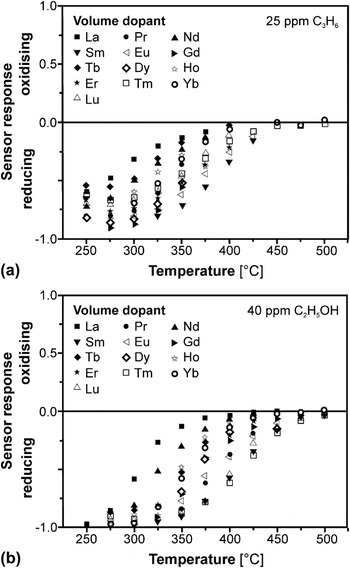
Regarding the LnFeO3 series, the sensor response toward C3H6 [Fig. 15(a)] and C2H5OH [Fig. 15(b)] was investigated by varying the working temperature (200–500 °C). The variation of temperature affected all characterized materials whereby SmFeO3, TmFeO3, and LuFeO3 exhibited the highest sensitivities toward both hydrocarbons up to temperatures of 450 °C. In contrast, LaFeO3 as the material having the largest lanthanide radius gave the smallest sensitivity. Since the high material resistance of YbFeO3 exceeded the detection limit, i.e., resistance of 20 MΩ, the appropriate measurements could merely be evaluated above 300 °C. Regarding the LnCrO3 series, the temperature of maximum sensor response was lowered in comparison to the LnFeO3 series. In both material series, the sensitivities toward C2H5OH were higher than toward C3H6 presumably due to the influence of functional OH group. The effect to discriminate between both hydrocarbons was more pronounced in case of CrFeO3 series, whereby among these, LaCrO3 and DyCrO3exhibited the lowest and highest sensitivity, respectively.Reference Heinert104
Sensor response of LnFeO3 series (volume doped by Ln = La, Pr, Nd, Sm, Eu, Gd, Tb, Dy, Ho, Er, Tm, Yb, and Lu) toward (a) C3H6 and (b) C2H5OH depending on temperature. Adapted from Ref. Reference Siemons and Simon103.

Additionally to the determination of the quality factors, sensor response, and selectivity, the HTE approach allows for the investigation of a third factor, which is the response time. Hence, the response and recovery times of LnFeO3 materials toward C2H5OH were further investigated at temperature of about 350 °C. Regarding, for instance, TmFeO3, the response and recovery times amounted to about 20 and 44 s, respectively, and remained unaffected during several cycles toward 40 ppm C2H5OH at 325 °C.Reference Siemons and Simon103
Subsequent to these studies, the SmFeO3, which has turned out to be the most sensitive material, was again volume doped by different elements (i.e., Co, K, Li, La, Pb, Mn, etc.) and concentrations (i.e., 2–20 at.%). Compared to the undoped base material showing just low sensitivity in the range of 250–325 °C among the resulting materials, the 10 at.% Co-doped SmFeO3exhibited an improved sensitivity toward CO up to 375 °C. Thus, the temperature-dependent sensing performance of latter doped sample was investigated concerning the temperature of maximum sensitivity and influence of CO concentration (i.e., 15–50 ppm). Thereby, this material possessed reversible response behavior as well as response and recovery times of up to 24 s, whereby naturally, the response time toward higher CO concentrations was shorter. The observed increase in sensitivity toward CO by Co doping is reported by literature as well.Reference Siemons, Koplin and Simon96, Reference Song, Qin, Zhang, Liu, Huang, Hu and Jiang105, Reference Lee, Song, Yoon, Kim, Kim and Choi106
C. Structure–property relation
The preparation and characterization of a quantity of structurally and chemically closely related sensor materials by varying a single or few parameters finally enable the discovery of general correlations and systematic trends. Thus, besides the development of new sensor materials, structure–property relations can be revealed between the respective sensor performance and material properties. In the following, correlations between the sensitivity and binding energy of rare-earth orthoferritesReference Siemons, Leifert and Simon88 and the particle size of spinel iron oxidesReference Belle, Bonamin, Simon, Santoyo-Salazar, Pauly, Bégin-Colin and Pourroy100 serve as selected examples.
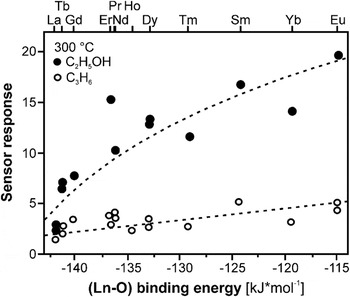
For LnFeO3 series, Fig. 16 demonstrates the correlation between the sensitivity toward both C3H6 and C2H5OH and the binding energy ΔH (Ln–O) of oxygen and lanthanide ion, respectively, since the bond strength of oxygen at the near surface sites was already proposed to be an important factor influencing the sensor properties of different rare-earth perovskites toward CH3OH.Reference Arakawa, Kurachi and Shiokawa107 The binding energy is given by the following equation, whereby CN denotes the coordination number of the metal ions, H f the molar formation energy of the oxide MmOn including the indices m and n, H s the sublimation energy of the metal, and D O the dissociation energy of O2Reference Siemons, Leifert and Simon88:
 $$\Delta H_{({\rm{M}}-{\rm{O}})} \, = \,{1 \over {{\rm{CN}}\,m}}\,\left( {H_{\rm{f}} - H_{\rm{s}} \,m - {n \over 2}\,D_{\rm{O}} } \right)\quad.$$
Structure–property correlation between binding energy ΔH (Ln–O) of Ln cations (Ln = La, Pr, Nd, Sm, Eu, Gd, Tb, Dy, Ho, Er, Tm, and Yb) versus sensor response of LnFeO3 series toward C3H6 and C2H5OH at 300 °C (no fitting data but suggested subsidiary lines are displayed). Adapted from Ref. Reference Siemons and Simon103.

Thus, the gas sensitivity depends on the binding energy in such a way that the stronger the binding between oxygen and metal ion, the smaller is the sensitivity. The transfer of this result and model to the LnCrO3 series as well as the volume doped SmFeO3is stated as the proof of concept.Reference Siemons, Leifert and Simon88, Reference Siemons and Simon97
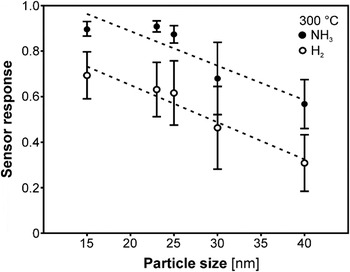
For Fe3−xO4 nanoparticles of different size, Fig. 17 reflects an almost linearly increasing sensor response toward NH3 and H2 at 300 °C depending on the nanoparticle size from 12 to 60 nm. The plotted line just serves as a guide for the eye.Reference Belle, Bonamin, Simon, Santoyo-Salazar, Pauly, Bégin-Colin and Pourroy100 At this, the smaller particles gave higher values of sensor response in the temperature range of 250–300 °C due to their higher surface to volume ratio as already reported concerning other materials.Reference Yamazoe27, Reference Xu, Tamaki, Miura and Yamazoe46 Since the effect of mean particle size on the sensor responses toward both analytes is comparable at 300 °C, it completely vanishes for H2 in contrast to NH3 at 250 °C. The samples exhibit good sensor responses toward NH3 with low cross-sensitivities toward H2 and NO at 250 °C but only slow recovery behavior after NH3 application. Thus, in addition to the selection of best working temperature, the selection of most sensitive particle size can be used to minimize or even eliminate the cross-sensitivity of Fe3−xO4toward other analytes.Reference Belle, Bonamin, Simon, Santoyo-Salazar, Pauly, Bégin-Colin and Pourroy100
Sensor response of Fe3−xO4 toward H2 and NH3 depending on the nanoparticle size at 300 °C (the dotted line just serves as guide for the eye). Adapted from Ref. Reference Belle, Bonamin, Simon, Santoyo-Salazar, Pauly, Bégin-Colin and Pourroy100.

IV. CONCLUSIONS AND PERSPECTIVES
The HTIS system presented is a valuable tool for rapid electrical characterization of different semiconducting gas sensor materials. Using the MESs and the high-throughput setup allows the impedimetric screening of a wide range of materials in a short time. Meanwhile, the application of that HTIS allowed preparing and screening of more than 1000 different materials under variable conditions.
Besides the described HTIS approach in search of new gas sensing materials, meanwhile, HTE and combinatorial methodologies are widely applied in the field of electrochemistry to enhance the development of new functional materials. Since these methodologies have primarily been successful in the pharmaceutical and medical domain, HT electrochemical methods are increasingly used by academia and industry for both synthesis and characterization. The particular electrochemical domains include the research and development of electrocatalytic (e.g., electrodes in fuel cell and batteries), thermoelectric (e.g., devices for conversion of heat back into electricity), dielectric (e.g., capacitors and radio frequency devices in computers, telecommunication, etc.), photoactive (e.g., light-emitting diodes, flat panel displays, etc.), corrosion protective (e.g., inhibitors of metal corrosion), and sensing (e.g., gas sensors in all industrial sectors) materials.Reference Muster, Trinichi, Markley, Lau, Martin, Bradbury, Bendavid and Dligatch108
All these applications having certain advantages and disadvantages were tailored to suit specific requirements. One example in the broad field of catalysis to be highlighted concerns the photoelectrochemical reduction of climate-relevant CO2 by excess clean electricity to selectively methanol or hydrocarbons for energy storage and use in direct methanol fuel cells. Thereby, a microelectrochemical cellReference Klemm, Topalov, Laska and Mayrhofer109 adopted from corrosion research and a multielement trace analysis enable the automated electrochemical characterization and catalyst degradation via a local probe technique. Thus, both series of measurements with equal parameters on different positions of graduated catalyst substrates (i.e., composition or loading)Reference Klemm, Schauer, Schumacher and Hassel110 and with variable parameters (i.e., potential and CO2 saturation) of homogeneous substratesReference Klemm, Pust, Hassel, Hüpkes and Mayrhofer111 are possible. In addition to that consideration of a single parameter, both methods can be combined by using a substrate graduated in one direction and measurements varied in another direction.Reference Klemm, Fink and Mayrhofer112
The examples given in this review may exemplify that high-throughput technologies in materials science get more and more accepted by research. With respect to technical applications, the main driving forces include broader and more detailed explored materials and process parameter spaces at a previously unavailable level of detail at a fraction of the time required for conventional experiments and, thus, eventually a faster time to market.