INTRODUCTION
As a consequence of increasing demand for natural rubber and competition with oil palm in the traditional areas, the extension of Hevea brasiliensis cultivation is accelerating in drought-prone areas, such as the southern part of northeast Thailand. Although growth and latex production are two distinct physiological phenomena in rubber trees (Rao et al., Reference Rao, Saraswathyamma and Sethuraj1998), these both are strongly related to evaporative demand and water availability. The importance of water relations for latex production is known (Pakianathan et al., Reference Pakianathan, Haridas, d'Auzac, d'Auzac, Jacob and Chrestin1989), and some authors have studied the impact of water constraints on tree water status, girth increment and latex production (Chandrashekar et al., Reference Chandrashekar, Nazeer, Marattukulam, Prakash, Annamalainathan and Thomas1998; Rao et al., Reference Rao, Rao, Rajagopal, Devakumar, Vijayakumar and Sethuraj1990). Water stress generally results from an imbalance between transpiration, driven by evaporative demand, and root–water uptake allowed by soil water availability. Drought stress occurs whenever soil water availability drops below a certain threshold, thus inducing restrictions to transpiration and growth. Frequently, but not invariably, soil dryness is coupled with strong evaporation caused by air dryness. Conversely, an atmospheric drought may occur despite water being available in the soil. A model that predicts tree water use, tree growth and latex production can be a useful tool to analyse key points of improvement in rubber tree cultivation in water-limited areas. Growth models have become a tool for making rational land use decisions and for monitoring sustainable agricultural systems if their capacity to predict crop response and identify management options is well established (e.g. Verdoodt et al., Reference Verdoodt, Van Ranst and Ye2004). These can help to identify environmental factors limiting growth and resource use and to assess productivity and profitability at various time scales (e.g. Shamudzarira and Robertson, Reference Shamudzarira and Robertson2002). For perennial crops, much less work on production models has been carried out, probably due to data limitation, relatively high research costs and the difficulties of accumulated errors in long-term simulations (Zuidema et al., Reference Zuidema, Leffelaar, Gerritsma, Mommer and Anten2005).
The Water Nutrients and Light Capture in Agroforestry Systems (WaNulCAS) model was developed by the International Centre for Research on Agroforestry (ICRAF), Indonesia as a research tool with a major objective to synthesise existing knowledge and hypotheses on above- and below-ground resource use by trees and crops at the patch scale (Van Noordwijk and Lusiana, Reference Van Noordwijk and Lusiana1999). Although it can undertake economic evaluations, the WaNuLCAS model is primarily a biophysical model that also provides a great range of outputs, including soil water, transpiration, growth of trees and crops for a given environment. This model was chosen for this study because it has already been parameterised for pure rubber tree stands and included a specific module of latex production. However, it has been mainly used for long-term (multi-annual) predictions of rubber tree growth in pure stand (Yahya, Reference Yahya2007) or in agro-forestry systems (Pinto et al., Reference Pinto, Bernardes, Van Noordwijk, Pereira, Luisiana and Mulia2005). Moreover, to our knowledge, this model has not been tested for rubber tree growing in drought-prone areas. Hence, this study had three aims: firstly, to test the possibility of using the WaNuLCAS model as an exploratory tool to analyse relationships between water use, growth and latex production on an intra-annual, daily basis and in a pure stand. The second aim was to evaluate the relative accuracy of the simulations of soil water content, tree transpiration, cambial growth and latex production. Finally, the third objective was to identify key features in the various parameterisations, which may be adapted to improve overall prediction quality in drought-prone areas. In order to address these issues, simulations were compared to field measurements in a mature rubber tree stand growing in the water-limited area of northeast Thailand. The period of analysis concerned seven months of full foliation and latex tapping from May to November. Four sub-periods were distinguished, combining contrasted magnitudes of evaporative demand and soil water availability.
MATERIALS AND METHODS
The WaNuLCAS model
The WaNuLCAS model's version 3.2 has been used in this study. The WaNuLCAS model was developed as a collection of modules in which processes are computed at a daily time step. A short description of the modules used for the simulation is given below. For more theoretical background on the modules, we refer to the original model documentation of Van Noordwijk and Lusiana (Reference Van Noordwijk and Lusiana1999).
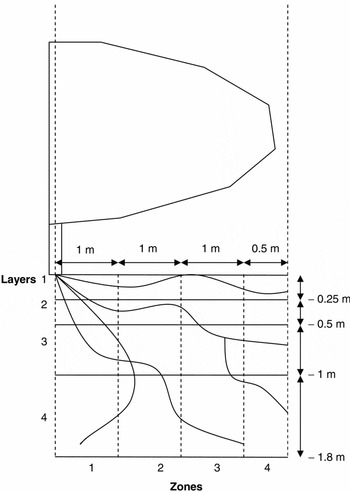
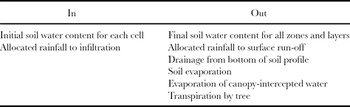
The soil is divided into four layers in the vertical and four spatial zones in the horizontal, and each layer is characterised by different soil properties (Figure 1). The soil hydraulic module includes pedotransfer functions (Wösten et al., Reference Wösten, Lilly, Nemes and Bas1998) that are used to derive the constants of the Van Genuchten (Reference Van Genuchten1980) equation depending on soil texture, bulk density and content of soil organic matter. These constants determine the relationship between soil water content, soil water potential, hydraulic conductivity and potential tree water uptake in each cell. To calculate water infiltration, the model estimates a layer-specific field capacity. Two definitions of field capacity are used: (i) field capacity is the soil water content at which downward drainage would become less than a critical value of conductivity (Kcrit) and would effectively stop, or (ii) field capacity is the soil water content that is in hydrostatic equilibrium with a water table at a distance defined from the bottom of layer 4. The higher of these two values in any cell is used. A saturated hydraulic conductivity (Ksat) is generated from the pedotransfer functions. The water balance includes vertical and horizontal transport. It incorporates the water balance inflows and outflows described in Table 1 at daily time steps.
General layout of soil layers and spatial zones in the WaNuLCAS model. Modelled trees were planted in zone 1 (adapted from Van Noordwijk and Lusiana, Reference Van Noordwijk and Lusiana1999).

In- and outflow elements of the WaNuLCAS model water balance.

Surface runoff occurs if (i) daily rainfall exceeds daily maximum infiltration, or (ii) daily rainfall exceeds the soil potential water storage. Allocation to surface runoff or infiltration in the soil layer 1 depends on the calibrated ratio between infiltration and runoff called SSI in this study, that is the ratio between reference Ksat (for degraded soil) and Ksat generated by the pedotransfer function. Infiltration then follows the tipping bucket principle for wetting subsequent layers of soil, filling a cascade of soil layers up to their field capacity.
Tree water uptake, i.e. transpiration, is driven by evaporative demand, with the possibilities determined by tree root length density and soil water availability in the various cells to which a plant has access. A ‘potential transpirational demand’ is estimated by leaf area index (LAI) and evapotranspiration rate (ET0). Hence, transpiration depends on a water demand reduction factor or stress factor:

where τ is the tree water demand, f(θ) is the water demand reduction factor (where θ is the soil water content) and τ 0 is the potential transpirational demand. The reduction factor depends on the ‘plant water potential’, which is estimated from the ‘soil water potential’.
Canopy light capture is determined by the LAI, the canopy height and Beer's law of extinction coefficient specific to rubber trees. The growth reserve pool varies with the tree potential growth and minimum stress factor regarding light, water and nitrogen. Part of the growth reserves is allocated to growth. Allometric equations are used to relate tree girth to tree biomass. They allocate predicted biomass to the different tree components: below-ground and total, above-ground biomass, which in turn is partitioned into roots, leaves and twigs, as well as branches. As for tree growth, part of the ‘tree growth reserves pool’ is allocated to ‘daily latex production’. Tapped latex depends on the ‘fraction of latex stock’ that can be tapped every day (‘tapping fraction’) and the existing ‘Brown Bast’, a physiological disease that induces reduction of latex production (Paardekooper, Reference Paardekooper, Webster and Baulkwill1989). The version of the WaNuLCAS model used here only predicts latex production by using a d/2 tapping pattern (one day of tapping – one day of rest).
Data measurements
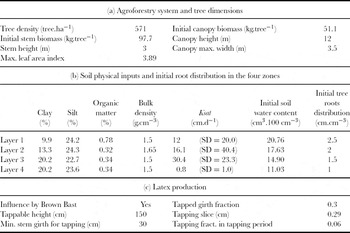
Experiment site and forestry system. The experiment site was located in Baan Sila (N15° 16′ 23.6″ E103° 04′ 51.3″, altitude = 150 m) between Satuk and Khu Muang in the Buriram province of northeast Thailand. The field was a monoculture stand of RRIM600 rubber clones planted in 1995 (i.e. 12 years old in 2007) at a 7 m × 2.5 m tree spacing over 5.5 ha, in a deep sandy soil. Average annual rainfall in this area is 1176 mm (Khu Muang station). The wet season lasts from May to October but intermittent dry spells often occur in June and July. Rubber trees have been tapped since June 2003. The stand was modelled as a half alley system as shown in Figure 1. The 2D unit represents a flat area – 3.5 m wide and 1.8 m deep. The width was arbitrarily split into four zones of 1, 1, 1 and 0.5 m. Layer bottoms were set according to main variations of soil properties in the profile, at depths of 0.25, 0.5, 1 and 1.8 m. Trees were grown in zone 1 at a density of 571 trees·ha–1 (Table 2(a)).
Inputs set in the WaNuLCAS model for simulation initialisation.

Water balance
Soil physical properties. The main soil properties (Hartmann et al., Reference Hartmann, Lesturgez, Do, Maeght, Isarangkool Na Ayutthaya and Nandris2006) of each modelled layer are provided in Table 2(b). Textures were assumed homogeneous in the four zones. The soil was degraded and poorly structured. Bulk density was high in layer 2: this compaction resulted from previous cassava cultivation. Ksat were measured with four replications. The magnitude of the measured standard deviation suggested significant spatial variability of this parameter.
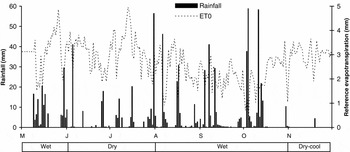
Soil water storage, infiltration and evaporation. The WaNuLCAS model requires the daily inputs of two climatic variables: rainfall and reference evapotranspiration. In Baan Sila, climatic data (air temperature, relative humidity, global radiation, wind speed and rainfall) were automatically recorded every 30 min with a Minimet station (Skye Instruments Ltd, UK) in an open field located to the east of the rubber stand, 50 m away from any tree. Recorded climate data were then aggregated as maximal/minimal (temperature, humidity), average (wind speed) or cumulated (radiation, rainfall) daily values. Daily values of reference potential evapotranspiration were calculated using the Penman–Monteith equation. Figure 2 shows the input values of the climatic data. In 2007, rainfall was approximately 965 mm (879 mm from May to November), 18% less than the long-term annual average. The wet season is often interspersed with a short dry and hot period (scarce rainfall and high evaporative demand) in June and July, a feature that occurred in 2007. Dry and cool conditions prevailed again from November. Climate data inputs were set equal in the four spatial zones. In the rubber stand, volumetric soil water content was measured once or twice each month with a neutron probe (Troxler 3300, US) calibrated for the experimental soil. Calibration was carried out separately for the upper (0–0.2-m depth) and lower (0.2–1.8-m depth) layers. Measurements were made every 0.2 m from the ground down to a depth of 1.8 m. Twelve access tubes of 2.0-m long were set up in pairs: one tube in the planting line between two trees, and the other one in the middle of the inter-row. Average measured moisture from the 12 tubes was used as observational data. Initial soil water contents (i.e. in May) are given in Table 2(b). The Kcrit value was calculated in order to get the field capacity of layer 1 equal to the soil water content at a soil water potential of −100 cm. No water table was observed below the stand in Baan Sila. A value of 10-m depth was set as input for the distance from the bottom of layer 4 to the supposed water table. Thus, the value of field capacity computed from the above-mentioned definition (ii) was insignificant. The SSI parameter (influencing the ratio between run-off and infiltration) was calibrated in order to obtain soil water stock values during periods of high rainfall (August–September–October) similar to the observed values.
Daily climate data from May to December 2007: rainfall and reference evapotranspiration.

Daily tree water use, i.e. transpiration, was estimated by the daily total sap flow in trunk xylem, ignoring changes in tree water storage (Isarangkool Na Ayutthaya et al., Reference Isarangkool Na Ayutthaya, Do, Pannengpetch, Junjittakarn, Maeght, Rocheteau and Cochard2010). The measurements of xylem sap flow density (SFD) on 11 trees in Baan Sila were made using the Transient Thermal Dissipation (TTD) system (Do and Rocheteau, Reference Do and Rocheteau2002; Isarangkool Na Ayutthaya et al., Reference Isarangkool Na Ayutthaya, Do, Pannengpetch, Junjittakarn, Maeght, Rocheteau and Cochard2010). A cycle of 10-min heating and 20-min cooling was used to measure sap flow density every 30 min. The zero flux signal was determined every night assuming that sap flow was negligible at the end of the night (see details in Isarangkool Na Ayutthaya et al., Reference Isarangkool Na Ayutthaya, Do, Pannengpetch, Junjittakarn, Maeght, Rocheteau and Cochard2010). Probes were inserted into the trunks at a height of 1.8 m above the soil. At this height, average sapwood area was estimated to be 2.04 dm2 (SD = 0.47). Three probes were inserted into each trunk to take into account the circumferential variability. An average radial profile of sap flux density was also taken into account (Isarangkool Na Ayutthaya et al., Reference Isarangkool Na Ayutthaya, Do, Pannengpetch, Junjittakarn, Maeght, Rocheteau and Cochard2010). All probes were connected to a data logger (CR10X, Campbell Scientific, Leicester, UK). Hourly SFD was cumulated over a 24-h period to calculate daily SFD and multiplied by the sapwood area. Average daily total flow of the representative trees was divided by the soil surface available theoretically for a tree (17.5 m2) in order to estimate the observed tree water uptake in millimetre. Isarangkool Na Ayutthaya et al. (Reference Isarangkool Na Ayutthaya, Do, Pannengpetch, Junjittakarn, Maeght, Rocheteau and Cochard2011) provide a detailed analysis of a data subset of these field measurements of water use.
Tree growth and light capture. The potential growth (0.01 kg.m−2) was taken from the WaNuLCAS model default values. As inputs, the model required initial stem and canopy above-ground biomass (Table 2(a)). Total above-ground biomass was calculated using the allometric relation between girth and weight. Constants for RRIM600 rubber trees were set according to Chantuma et al. (Reference Chantuma, Chantuma, Rhutherman, Tsongpanich, Bunnuam, Kongsilp and Kesawapitak2004):

where W is the above-ground tree weight in kilogram and G is the tree girth in centimetre, measured at 170 cm above the ground. The simulated girth increments were compared with observations. In 2007, girths of 232 trees were measured using a metre rule once or twice per month in Baan Sila. The maximum LAI (Table 2(a)) for 2007 was measured by collecting fallen leaves in one square meter open boxes from November 2007 till the complete defoliation at the end of January 2008. Root biomass and root length density were assumed constant for the simulation period. The average profile of root length density was taken from measurements at the site (Table 2(b), Pierret et al., unpublished report). Default model values were used for other physiological parameters.
Latex production. Observed latex production was estimated from the amount of rubber sheets produced on each tapping day on the whole plot, knowing the number of tapped trees and an average weight per rubber sheet of 1200 g. The ‘tapping fraction’ was calibrated to fit the range of expected latex production at the start of tapping period in May, taking into account the fact that 30% of the trees of the plot were suffering from Brown Bast and that the tapping system in the model could only be d/2 instead of the observed 2d/3. The used parameters in the latex module are given in Table 2(c). Other parameters have been set following the WaNuLCAS model's default values.
Evaluation of model predictions
The simulation covers the period from 1 May 2007 to 30 November 2007. The simulation assumed no limitations due to nutrients (nitrogen or phosphorus), weeds and pests. Predicted data regarding soil water content, transpiration, girth increment and latex production were compared with field measurements. The analysis used R 2 and RMSE rel:

where O and P represent observed and predicted values, respectively, and Ō represents the observed value average. The number of observations is n. R 2 and RMSE rel for transpiration estimates were compared over the seven-month period of study and for the four climatic sub-periods (Figure 2): one combining high evaporative demand and low soil water constraint (May); two periods combining high evaporative demand and high soil water constraint (June–July and November); and one combining low evaporative demand and low soil water constraint (August–September–October).
RESULTS
Water balance
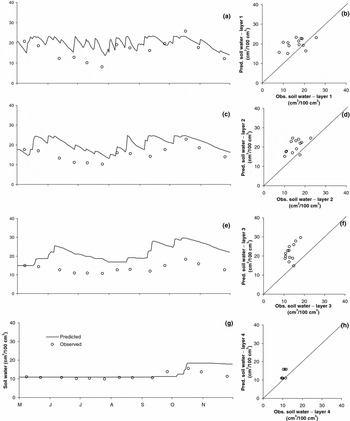
Soil water content. Observations ranged from 5 to 25% (Figure 3). Soil moisture decreased in each layer during the short dry period of June and July. Model results followed the same pattern but were often overestimated, particularly in layer 3. R 2 of layers 1, 2, 3 and 4 were 0.218, 0.307, 0.277 and 0.496, respectively, and RMSE rel values were 34.7, 39.8, 68.7 and 22.3%, respectively. For the total profile, R 2 and RMSE rel values were 0.461 and 34.9%, respectively.
Observed and predicted soil water content: (a) and (b) layer 1; (c) and (d) layer 2; (e) and (f) layer 3; (g) and (h) layer 4. Diagonal lines indicate the 1–1 lines.

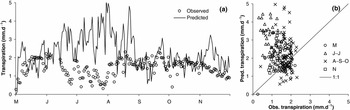
Tree transpiration. Measured values ranged from 0.3 to 2.3 mm.d−1 (Figure 4). Transpiration dramatically decreased during the intermittent droughts in June and July. It also progressively decreased in November at the beginning of the long dry period. Predicted and observed values were in the same range during periods without soil water constraint and with low or moderate evaporative demand (ET0 < 2 mm.d−1, September–October). In contrast, model-predicted values were significantly overestimated in periods of high evaporative demand (ET0 > 2 mm.d−1: start of May, June and July, and November). Moreover, the dramatic reduction of transpiration in June and July due to soil drought was not simulated. Finally, R 2 and RMSE rel values equalled 0.104 and 94 %, respectively.
(a) Observed and predicted tree transpiration; (b) predicted vs. observed. Diagonal line indicates the 1–1 line.

Tree growth
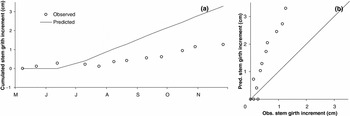
Observed tree girth increased at the beginning of the rainy season (May–June) and then stopped and decreased in July in accordance with decline in transpiration (Figure 5). Girth increased again from August to October. The total increment reached 1.3 cm over the seven-month period. The model significantly overestimated girth increment. Final R 2 and RMSE rel values were 0.916 and 208%, respectively.
(a) Observed and predicted cumulated stem girth increment; (b) predicted vs. observed. Diagonal line indicates the 1–1 line.

Latex prediction
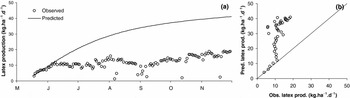
Observed values ranged from 1.3 and 19 kg.ha−1.d−1 and the pattern was not correlated to variations in transpiration (Figure 6). As for growth, the model did not predict any reduction due to water stress, and the latex production was largely overestimated. Total predicted production (2888 kg.ha−1) was twice the measured production (1416 kg.ha−1) over the simulated period. Finally, R 2 and RMSE rel values were 0.423 and 169%, respectively.
(a) Observed and predicted latex production; (b) predicted vs. observed. Diagonal line indicates the 1–1 line.

DISCUSSION
WaNuLCAS model as an exploratory tool
The test of the possibility of using the WaNuLCAS model as an exploratory tool for a pure rubber tree stand appeared to be successful. It simulated daily changes in transpiration, girth increment and latex production within plausible ranges (Pakianathan et al., Reference Pakianathan, Haridas, d'Auzac, d'Auzac, Jacob and Chrestin1989; Silpi et al., Reference Silpi, Thaler, Kasemsap, Lacointe, Chantima, Adam, Gohet, Thanisawanyangkura and Ameglio2006; Watson, Reference Watson, Webster and Baulkwill1989). In addition, the model runs were easily implemented and several shortcuts were available to test the schematic inputs of rainfall, ET0 and so forth.
Relative accuracy of simulations
With the current model version and parameters, results showed large inaccuracies for certain model predictions: soil water content (R 2 = 0.461, RMSE rel = 34.9%), tree transpiration (R 2 = 0.104, RMSE rel = 94 %), tree girth increment (R 2 = 0.916, RMSE rel = 208.4%) and latex production (R 2 = 0.423, RMSE rel = 169.5%). However, as the model did not predict water shortage in June and July, the significant overestimations in girth increment and latex production appear logical and cannot be discussed in further depth. Hence, the focus of this investigation is foremost on the soil water balance and tree water use. Model estimations of tree transpiration were correct in conditions without soil and atmospheric droughts. Major inaccuracies resulted from (i) the non-prediction of soil water shortage, and (ii) the overestimation of tree transpiration under high evaporative demand and non-limiting conditions of soil water.
The soil water shortage was not predicted because the soil water content was overestimated in all layers except in the lowest one. In the WaNuLCAS model, as in all reservoir models, infiltration water fills each layer of soil until their field capacity is reached and the excess moisture wets the subsequent soil layer. The speed of the process depends on the infiltration rate. When the deepest layer reaches its field capacity, excess water is lost by deep drainage. A small error in predicting soil water content in upper layers may thus be amplified in deeper layers. Bias in predicting soil water content can come from errors in predicting (i) the layers field capacity, and (ii) the infiltration rate of each layer, particularly in the upper-most layer, which determines the infiltration/runoff ratio. Aware of these points, measured Ksat and SSI were used. The default values of Ksat and SSI provided by the pedotransfer functions of the WaNuLCAS model were even higher than our estimated values and induced even greater overestimates of soil water content. Other authors reported inadequacies of the pedotransfer functions and predicted infiltration by the WaNuLCAS model for tropical soils (Hodnett and Tomasella, Reference Hodnett and Tomasella2002; Pansak et al., Reference Pansak, Hilger, Lusiana, Kongkaew, Marohn and Cadish2010; Walker et al., Reference Walker, Mutuo, Van Noordwijk, Albrecht and Cadish2007). In order to explain the overestimate of soil water content, despite the use of measured Ksat and calibrated SSI values, several hypotheses are proposed. Firstly, measured Ksat is still overestimated, particularly in the upper layer. This is possible because the variability between field measurements of Ksat was very large (Table 2(b)). Moreover, significant surface flooding and run-off were observed for each important rainfall event. Secondly, the infiltration of water is not homogeneous between the tree row and the inter-row space. Surface flooding and run-off were of great importance in the inter-row spaces, which are at a lower level than the tree rows. In addition, preferential vertical flow may occur in the inter-row spaces, which may induce deep, localised drainage.
In addition, the model overestimated maximum transpiration because it simulated tree transpiration that follows the evaporative demand without any stomatal regulation due to atmospheric conditions. The only water regulation included in the model originates from soil water shortage, similar in the majority of models. However, observed data showed that effective regulation of transpiration occurred above ET0 = 2.0 mm (Figure 4). This is, however, a very recent result for rubber trees (Isarangkool Na Ayyuthaya et al., Reference Isarangkool Na Ayutthaya, Do, Pannengpetch, Junjittakarn, Maeght, Rocheteau and Cochard2011), which may differ according to the clone (here RRIM 600). The regulation of transpiration at high evaporative demand, whatever the soil water availability, has been quoted for several species and environments (Bovard et al., Reference Bovard, Curtis, Vogel, Su and Schmid2005; Bush et al., Reference Bush, Pataki, Hultine, West, Sperry and Ehleringer2008; David et al., Reference David, Ferreira, Cohen, Pereira and David2004; Oguntunde et al., Reference Oguntunde, Van de Giesen and Savenije2007). Moreover, the overestimate of transpiration in the simulation should further decrease the soil water reserve, which emphasises the current overestimation of soil water content by the model. The current version of the WaNuLCAS model has, however, already predicted correct values of rubber tree growth and production over long periods in other regions (Pinto et al., Reference Pinto, Bernardes, Van Noordwijk, Pereira, Luisiana and Mulia2005; Yahya, Reference Yahya2007). We assume that these results likely correspond to environmental conditions without high evaporative demand.
Key points of parameterisation and improvement
Under the conditions of degraded soil and investigated high evaporative demand, the key points of parameterisation and improvement are the soil water balance and the regulation of tree transpiration under high evaporative demand. It is likely that the ability to separate soil properties between horizontal zones in the model will facilitate the improvement of the simulated soil water balance. This is particularly the case in rubber tree plantations, where several years of different soil-, weed- and litter-management practices between tree row and inter-row spaces may influence the topography and soil properties related to soil water infiltration and balance. Secondly, the regulation of transpiration as a function of evaporative demand requires the introduction of a new equation or reduction factor. The transpiration model by Granier et al. (Reference Granier, Loustau and Breda2000) provides an example of a multiple regulation of canopy conductance where atmospheric drought is taken into account whatever be the soil water conditions.
CONCLUSIONS
In conclusion, the WaNuLCAS model appears to be a useful exploratory tool for the simulation of water use, growth and latex production in a pure stand of rubber tree on a daily basis. Results do, however, show that under the conditions of degraded soil and investigated high evaporative demand, the modules of soil water balance and tree transpiration require particular parameterisations and improvement in order to more accurately represent these processes.
Acknowledgements
The authors thank all French and Thai counterparts from the Institute of Research for Development (IRD), the Khon Kaen University and the Land Development Department. They particularly thank the Land Development Department of Bangkok and Dr. Darunee Chairod for assistance in neutron probe measurements. They are grateful to Dr. Henri Robain for his support as Coordinator of the agreement program between IRD and the Rubber French Institute. They are also extremely grateful to Mr. Chaipat Sirichaiboonwat who welcomed them so kindly in his rubber tree plantation. Finally, they sincerely thank Ms. Ni'matul Khasanah (ICRAF, Indonesia), Dr. Fiona Tummon (CNRS, France) and Dr. Erwan Motte (STARLAB, Spain) for their kind assistance in achieving this work. This Thai–French research was funded by the French Institute of Research for Development (IRD), the Rubber French Institute (IFC) and Michelin/Socfinco/SIPH Plantation companies.