1. Introduction
The largest area of wetlands in Vietnam is found in the Mekong River Delta (MRD). This 4.9 million hectare area can be broadly divided into two categories: inland and coastal wetlands (Vietnam Environmental Protection Agency, IUCN and MWBP, 2005). Inland wetlands are dominated by floodplain paddy fields, seasonally flooded grasses and Melaleuca forests, while coastal wetlands are generally dominated by mangrove forests (Torell and Salamanca, Reference Torell, Salamanca, Torell, Salamanca and Ratner2003).
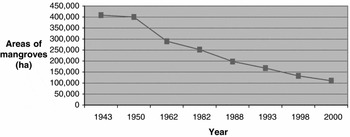
The wetlands of the MRD have experienced serious losses in scale and ecological integrity. The area of mangrove forest has decreased by 80 per cent over the last six decades, from 408,500 hectares in 1943 to 110,700 hectares in 2000 (Vietnam Ministry of Natural Resources and Environment, 2002) (see figure 1). Wetland biodiversity has also decreased. For example, in Tram Chim Wetland National Park, the number of the endangered species, the Sarus Cranes, has fallen from 1,057 in 1987 to 93 in 2005. Native plant species have been destroyed by the invasive species of mimosa pigra. Fish stocks have declined and some native fish species have disappeared (Nguyen and Wyatt, Reference Nguyen and Wyatt2006).
Decrease in mangrove areas in Vietnam, 1943–2000
Source: Vietnam Ministry of Natural Resources and Environment, 2002, ‘Cac khia canh ve dieu kien tu nhien dat ngap nuoc o Vietnam' (in Vietnamese) (Issues of Natural Conditions of Wetlands in Vietnam)’, Vietnam Ministry of Natural Resources and Environment, Ha Noi, Vietnam.

Information on wetland values is useful to wetland management. Effective wetland management, with the objective of improving human welfare, requires data on the rate of harvest of the natural resources, the overall status of natural resources (Torell et al., Reference Torell, Salamanca and Ahmed2001) and the marginal net benefits of alternative uses of the wetland resources (Whitten and Bennett, Reference Whitten and Bennett2005). Specifically, information on the economic values of wetland goods and services is integral to the estimation of the costs and benefits of alternative management strategies (Barbier et al., Reference Barbier, Acreman and Knowler1997; Turner et al., Reference Turner, Van Den Bergh, Soderqvist, Barendregt, Van Der Straaten, Maltby and van Ierland2000; de Groot et al., Reference De Groot, Stuip, Finlayson and Davidson2006). Information on wetland values provides inputs for policymakers so that the policies they develop reflect the relative values of resources in their alternative uses.
At present, there is a lack of information on the values of wetlands in the MRD. Only a few of the numerous wetland benefits in the MRD have been quantified in studies by Hang and An (Reference Hang, An, Francisco and Glover1999), UNEP/GEF (2003), and Do and Bennett (Reference Do and Bennett2005). These studies focused only on the market values of the wetlands. Wetland non-market valuation studies have been performed in other parts of the world (Langford et al., Reference Langford, Bateman and Langford1996; Morrison et al., Reference Morrison, Bennett and Blamey1999, Carlson et al., Reference Carlsson, Frykblom and Liljenstolpe2003; Othman et al., Reference Othman, Bennett and Blamey2004; Whitten and Bennett, Reference Whitten and Bennett2005; Birol et al., Reference Birol, Karousakis and Koundouri2006; Hein et al., Reference Hein, van Koppen, de Groot and van Ierland2006; Birol and Cox, Reference Birol and Cox2007). In contrast, as Do and Bennett (Reference Do and Bennett2005) note, estimates of the non-market values of wetlands in the MRD remain limited. Only one contingent valuation (CV) study by Hoang et al. (Reference Hoang, Dang, Ngo, Trinh, Oh, Ratner, Bush, Kolandai and Too2005) estimating non-use values of coastal wetlands has been documented. That study, however, focused only on local respondents in the MRD and hence failed to provide value estimates that can be extrapolated across different geographic populations. In addition, because CV was used as a valuation technique, the derived estimates were the WTP for a single management plan and hence provide limited potential for benefit transfer.
The research reported in this paper helps to fill this information gap by providing estimates of non-market values for wetlands in the Vietnam's MRD. Specifically, estimates of willingness to pay (WTP) for improvements in the wetland biodiversity of the Tram Chim National Park, a typical inland wetland in the MRD, are reported. Environmental Choice Modelling (CM), also known as Choice Experiments, was employed with personal interviews being conducted in three sub-samples of household residents in Cao Lanh, Ho Chi Minh City, and Ha Noi. These locations represent three geographic areas: in the MRD, on the edge of the MRD, and outside the MRD. Hence, the values estimated can be extrapolated across different geographic areas. In addition, through the use of CM, both the WTP for increments in each wetland attribute and the WTP for changes from the status quo to a range of alternative management scenarios can be derived. These provide policymakers with a rich information base to assist in wetland management decision making.
In addition, this research contributes to the knowledge of CM by examining its applications in a developing country context. So far, studies on the CM applications in the developing country context have been limited. To the authors' knowledge, two recently published studies using CM in developing countries are those by Cook et al. (Reference Cook, Whittington, Do, Johnson and Nyamete2007), and Tuan and Navrud (Reference Tuan and Navrud2007). Cook et al. (Reference Cook, Whittington, Do, Johnson and Nyamete2007) focused on the impact of the survey mode on respondents' WTP for cholera and typhoid vaccines, while Tuan and Navrud (Reference Tuan and Navrud2007) focused on comparing value estimates for cultural heritage derived from CV and CM. Other aspects of CM application in the developing country context have yet to be examined. In particular, no CM study has been performed for wetlands in developing countries.
This paper comprises five sections. Following this introduction, section 2 summarizes the methodology used and includes a description of the studied site of Tram Chim with a brief review of CM. Section 3 details the research design, including the development of the questionnaire used and the implementation of the survey. Section 4 reports and discusses the results, including details of the socioeconomic characteristics of respondents, model selection and compensating surplus estimates. The paper ends with a discussion of the policy implications arising and a conclusion that CM can be applied in estimating environmental values in Mekong River region.
2. Methodology
2.1. Case study: Tram Chim Wetland National Park
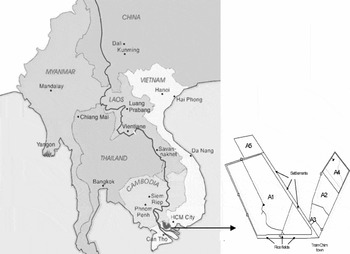
The case study reported here involves Tram Chim National Park. Established as a National Park in 1998, Tram Chim is a 9,000 ha wetland located in Tam Nong District, Dong Thap Province (figure 2). Tram Chim provides habitats for 127 plant species and supports a large number of herons, egrets, storks, and ibises, and some rare species such as Black-necked Storks, Lesser Adjutants, and Greater Adjutants. Most notably, Tram Chim provides a habitat for the Sarus Crane, an endangered bird species listed in the IUCN red book (UNDP/IUCN/MRC/GEF, 2005). Due to its biodiversity values, Tram Chim was Vietnam's first wetland national park and has been nominated by the Vietnamese Government to be a Ramsar site (Buckton et al., Reference Buckton, Cu, Quynh and Tu1999).
Location and map of Tram Chim
Source: Adapted from Mekong Sources 2004, ‘Map of Mekong’, http://www.mekongsources.com/MkRegion.asp (15/9/04) and UNDP/IUCN/MRC/GEF 2005, ‘Integrated Water and Fire Management Strategy Tram Chim National Park’, Cao Lanh 2005.

Tram Chim National Park was enclosed by 53 km of dykes and canals in 1985 to retain water during the dry season. This helped restore the wetland ecological systems damaged during the Vietnam War (Pacovsky, Reference Pacovsky2005). Evidence of ecological restoration came with the return of Sarus Cranes. However, in 1996, to prevent fire, the local management authority raised the height of the dyke so that the water level is now constantly higher than the ecological optimal level of 0.5 m (UNDP/IUCN/MRC/GEF, 2005).
The current ‘high dyke’ system has affected Tram Chim's ecological systems (Thanh, Reference Thanh, Torell, Salamanca and Ratner2003). While the long inundation period created by the dykes encourages some deepwater species, overall it has a negative impact on the ecological system. Native plants have been replaced by the invasive mimosa pigra (Triet et al., Reference Triet, Man, Nga, Julien, Flanagan, Heard, Hennecke, Paynter and Wilson2004). Eleocharis or ‘nang’ grass, the favourite food of the Sarus Cranes, has been lost. That has led to reduced numbers of this endangered bird species visiting the Park (Vietnam Environmental Protection Agency, IUCN, and MWBP, 2005). The high dyke system has also hindered fish migration and hence reduced the number of fish species living in the wetlands. To address this problem, the Park Management Board has proposed to change the current dyke system and wetland management practices (Tram Chim National Park Management Board, 2005). This proposed program would improve the biodiversity of the wetlands. On the other hand, it would impose costs on local farmers in the form of reduced income from rice production because of an increase in the duration of flooding.
2.2. Environmental choice modelling
CM involves asking survey respondents to choose their most preferred resource use option from a number of alternatives. While there are numerous stated preference techniques for non-market valuation, including CV, contingent rating, contingent ranking, and paired comparison, CM has the advantages of providing a richer data set, strategic bias reduction, benefit transfer potential, framing effect control, and context flexibility (for detailed discussions about CM advantages, see Hanley et al., Reference Hanley, Wright and Adamowicz1998; Bennett and Blamey, Reference Bennett, Blamey, Bennett and Blamey2001; Hanley et al., Reference Hanley, Mourato and Wright2001).
CM is consistent with random utility theory (RUT) (see Hensher et al., Reference Hensher, Rose and Greene2005 for detailed discussions). Under RUT, the utility of a good is decomposed into an observable component and an unobservable stochastic component. To estimate the choice probabilities using conditional logit (CL), it is assumed that the random components are independently and identically distributed (IID), with the implication that alternatives have independence from irrelevant attributes. To introduce respondent heterogeneity, socioeconomic variables are used as independent variables in explaining the probability of choice. When the IID assumption is violated, CL estimates may be biased. This triggers the use of nested logit, mixed logit, or random parameter logit (RPL), and latent class models detailed in Louviere et al. (Reference Louviere, Hensher and Swait2000), Hensher et al. (Reference Hensher, Rose and Greene2005), and Boxall and Adamowicz (Reference Boxall and Adamowicz2002), respectively. These models have been applied in estimating wetland values (Carlsson et al., Reference Carlsson, Frykblom and Liljenstolpe2003; Othman et al., Reference Othman, Bennett and Blamey2004; Whitten and Bennett, Reference Whitten and Bennett2005; Birol et al., Reference Birol, Karousakis and Koundouri2006; Milon and Scrogin, Reference Milon and Scrogin2006).
3. Research design
3.1. Questionnaire development
The development of the CM questionnaire was based on focus group studies. Five focus groups were conducted for both potential respondents (4) and wetland managers (1) to ensure that inputs from all stakeholders related to wetland management were received. The purposes of the focus group studies were to determine attributes relevant to respondents and wetland managers, delineate appropriate cost levels and a payment vehicle, and test a draft questionnaire.
The following attributes were found to be of the most interest to both potential respondents and wetland managers: area of healthy vegetation,Footnote 1 number of Sarus Cranes, number of fish species, the number of local households affected, the cost options.
The levels of the attributes were determined in consultation with wetland experts. To select a payment vehicle, three criteria were used: good coverage, acceptability, and feasibility. Good coverage means that the payment vehicle should have applicability and relevance across the studied population. Acceptability means that the payment vehicle should be widely acceptable to the respondents. Feasibility means that it is not too costly and complicated to implement in practice. Each criterion was given a score on the scale of 1–10. Respondents were asked to score proposed payment vehicles, including the electricity bill, water bill, income taxes, solid waste collection fees, and a newly set up fund for wetland protection. The electricity bill was selected as superior because of its broad coverage and high degree of compulsion. This is consistent with the findings reported by Jianjun et al. (Reference Jianjun, Harder, Nabangchang, Indab, Thuy and Subade2006) that the electricity bill appears to be feasible and acceptable for Southeast Asian respondents, despite the seemingly weak linkages between electricity bills and environmental goods.
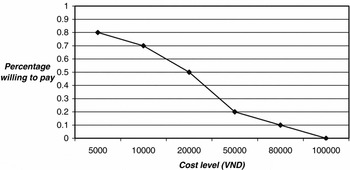
The focus group studies also showed that the range of WTP for a hypothetical wetland improvement was from zero to VND 100,000 (USD 6.2).Footnote 2 The percentage of focus group respondents who agreed to pay for the proposed costs decreased as the cost levels increased (figure 3), suggesting a suitable range of cost levels.
Cost levels and willingness to pay

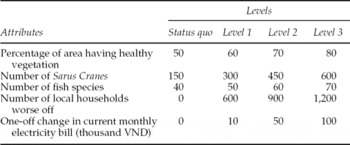
An orthogonal, main effect experimental designFootnote 3 involving five attributes each with four levels (including the status quo) was constructed after the attributes and levels were determined (table 1). Twenty-five choice sets were created with five questionnaire versions containing five choice sets.
Attributes and levels in the experimental design

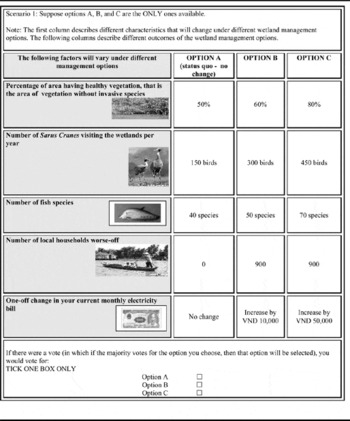
The questionnaire briefed respondents about Tram Chim National Park and its biodiversity loss due to poor wetland management. It then described the proposed plan for wetland improvement and the outcomes of different management options. It continued by explaining that to implement the plan, the government would need to raise funds to cover the costs of dyke reconstruction, invasive species removal and control, hydrological and biological monitoring, and to pay compensation to local farmers who would suffer from subsequent changes in flood levels. An example of a choice set that followed is provided in table 2.
An example of a choice set

To test the effect of ‘cheap talk’Footnote 4 in a developing country context, a version following that of Aadland and Caplan (Reference Aadland and Caplan2006) was added. The long version of cheap talk developed by Cummings and Taylor (Reference Cummings and Taylor1999) was not used for two reasons. First, the focus group studies revealed that it was too long and complex for Vietnamese respondents with limited formal education. Second, the long version is not easily generalized because it requires either baseline information on the degree of hypothetical bias or a presumption of the degree of hypothetical bias that exists in the population for calibrating the specific wording of a cheap talk script (Aadland and Caplan, Reference Aadland and Caplan2006). The cheap talk used in this application translates as follows:
As you prepare to answer the next few questions, please keep in mind the following three things. First, remember your household budget. How much would your household be able to afford for a one-off increase in your electricity bill? Second, recall that there are other wetland areas in the Mekong Delta such as U Minh Thuong and Lang Sen. And, third, keep in mind that in previous surveys we have found that the wetland management options that people say they prefer are sometimes different from the options that they would actually select when the wetland program is implemented and requires a real payment. For this reason, when choosing options, please imagine your household is actually paying for the options you choose.
3.2. Survey implementation
The study focused on three sub-samples of respondents. The first was drawn from the population of the MRD that is not directly affected by changes in the management of Tram Chim. This allows the estimation of environmental benefits enjoyed by local residents resulting from future management scenarios without the confounding effects of changes in farming income. Cao Lanh in Dong Thap Province was selected as this population. The target sub-sample size was 300.
The second sub-sample was drawn from the population of urban residents in Ho Chi Minh City located adjacent to the MRD. The third sample involved those who live far from the MRD. In this case, Vietnam's capital, Ha Noi was selected. The sub-samples in Ha Noi and Ho Chi Minh City were further split into two for testing two kinds of questionnaires. For the first sub-sample, questionnaires without cheap talk were used while in the second sub-sample, questionnaires embedded with a cheap talk script were used. The targeted sample size for each sub-sample was 150. The total expected sample size for the CM exercise was 900.
The sampling frames used were maps of Cao Lanh, Ho Chi Minh City, and Ha Noi. Stratified sampling was used with communes as strata. In each commune, systematic sampling was used to select respondents. To meet the sample size target, it was estimated that in each commune, 30 respondents would be selected from about 1,500 households. Therefore, the enumerators approached every 50th households in each commune. Households were the sample units with a member of the household who was over 18 yeas old being the unit of inquiry. The survey was conducted in June and July 2007 using personal interviews.
4. Results
4.1. Respondents' socioeconomic characteristics
The numbers of useable questionnaires collected in the Ha Noi, Ho Chi Minh, and Cao Lanh sub-samples were 370, 289, and 258 respectively. In Ha Noi, the sizes of the split sub-sample for ‘cheap talk’ and ‘non-cheap talk’ were 186 and 184, while those in Ho Chi Minh City were 145 and 144 respectively. Cao Lanh had the highest response rate (78.6 per cent), followed by Ho Chi Minh City (59.4 per cent) and Ha Noi (52.5 per cent). This also represents the order of distance to Tram Chim National Park: Cao Lanh (40 km), Ho Chi Minh City (250 km), and Ha Noi (2000 km).
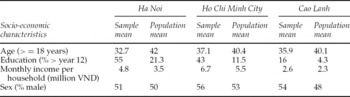
To examine the representativeness of the sub-samples, a comparison between the sociodemographic characteristics of the samples and the populations (Vietnam General Statistics Office, 2004) was conducted. It was found that the samples were biased toward younger, better-educated males in all three locations (table 3). This might be due to the fact that the surveys targeted urban residents that have younger and more educated populations. In addition, it may be because people with higher educational status are more likely to be willing to participate in the interview, a prospect noted by the survey enumerators. Another reason is that in the Vietnamese culture, men often represent their households in answering questionnaires.
Socio-demographics of the respondents

4.2. Model selection
Conditional logit
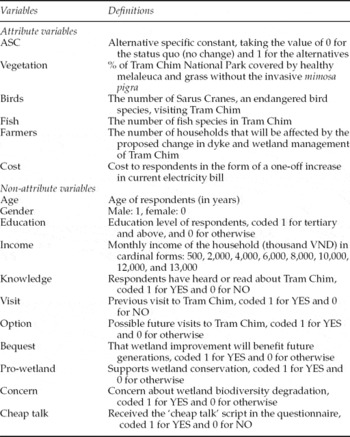
LIMDEP was used to run CL models of the choice data. Two models were estimated for each location. The first model is a basic model showing the importance of the attributes in explaining respondents' choices across the three different options in a choice set: a status quo (no change) and two alternatives of changes. This model involves the attributes and an alternative specific constant (ASC) as explanatory variables. The second model includes socioeconomic and attitudinal characteristics interacting with the ASC and selected attributes. In this case, the attribute ‘cost’ was interacted with ‘age’, ‘gender’, ‘income’, and ‘education’, as these interactions were found to be significant in previous studies by Gordon et al. (Reference Gordon, Chapman, Blamey, Bennett and Blamey2001) and Birol and Cox (Reference Birol and Cox2007). Definitions of the variables used in the models are presented in table 4.
Definitions of variables

Models 1 and 2 were estimated twice: the first time including all respondents and the second time excluding those who objected to the choice scenarios. Scenario rejecting or protest respondents:
• did not believe the feasibility of or support the one-off increase in electricity bills;
• did not believe the scenarios presented;
• did not believe that the funds raised would be used for environmental purposes;
• believed that the government should pay for wetland improvement, not citizens; or
• selected the options randomly without considering the attributes and levels.Footnote 5
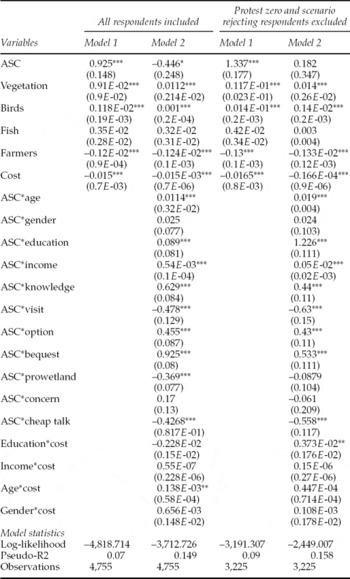
Protest respondents accounted for 32 per cent of the total respondents.Footnote 6 The models without protest respondents were found to have higher pseudo-R2 than the inclusive models, insignificant ASCs and a priori expected signs of the significant variables (table 5). Therefore, the models excluding protest respondents were used for further analyses. Insignificant socioeconomic variables were not included in subsequent model estimations.
Results of conditional logit models for pooled data of three locations

Notes: Standard deviations are in parentheses. *** statistical significance at 1% level, ** statistical significance at 5% level, *significance at 10% level.
Random parameter logit
The Hausman test for compliance with the IID assumption was performed. It was found that the data did not support this test, as the difference matrix was not positive definite. Further analysis was thus conducted to relax the IID assumption and investigate heterogeneity in respondents' preferences. To this end, either latent class or random parameter logit (RPL) models could be used. Provencher and Moore (Reference Provencher and Moore2006) argue that neither approach dominates the other statistically, and that the decision of which modelling to use depends on the analyst's judgement about the correlation of preference parameters. Following Provencher and Moore's (Reference Provencher and Moore2006) suggestions, RPL models were employed, with the assumption that preference parameters were uncorrelated to each other.
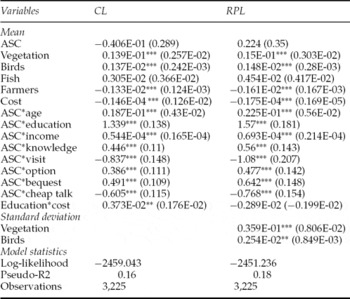
In RPL models, taste parameters are assumed to have statistical distributions arising from potentially different parameters for each individual (Hensher et al., Reference Hensher, Rose and Greene2005). Log-normal and normal distributions are the two alternative assumptions used for the random parameters (Carlsson et al., Reference Carlsson, Frykblom and Liljenstolpe2003). Following Carlsson et al. (Reference Carlsson, Frykblom and Liljenstolpe2003), in this study, the normal distribution was applied because it allowed respondents to have positive and negative preferences for wetland attributes. Steps suggested by Hensher et al. (Reference Hensher, Rose and Greene2005) were followed to estimate the RPL. First, all attributes except for the cost attribute were estimated as random parameters. Second, the random parameters having distributions with insignificant standard deviations were re-estimated as non-random parameters. The RPL model with 500 random draws and normal distribution for the random parameters shows that respondents have heterogeneous preferences over vegetation and birds, significant at the 1 per cent level (table 6).
Results of conditional logit and random parameter logit models

Notes: Standard deviations are in parentheses. ***denotes statistical significance at 1% level, **at 5% level and *at 10% level.
The assumption of uncorrelated preference parameters was then relaxed by estimating the RPL model allowing free correlations among the random parameters, following Colombo et al. (Reference Colombo, Calatrava-Requena and Hanley2007). In addition, the error components, which are individual specific random effects distributed across alternatives, were also estimated in this model following Greene (Reference Greene2007). No statistically significant correlations between the random parameters were found. In addition, the standard deviations of the latent random effects were insignificant at the 5 per cent level. This suggests that the impact of the variance of the latent random effects on the model estimates was insignificant.
The CL and RPL models show that respondents preferred more healthy vegetation, more birds, fewer farmers affected, and less cost. The number of fish species was insignificant to respondents, although it was of interest to the focus groups. There are two possible reasons for this. First, the levels of this attribute might not have varied enough to cause a significant impact on respondents' choices. Second, the fish attribute may have reflected the passive use value only and hence might not have had an obvious impact on respondents' choices. However, ex post, the cause of the insignificance is conjectural.
Older respondents with higher incomes and more education chose wetland improvement options more frequently than young respondents with lower incomes and less education. Respondents who had some knowledge about Tram Chim, and thought that they may visit Tram Chim in the future and that future generations would benefit from Tram Chim wetland improvement chose improvement options more frequently. On the other hand, respondents chose the status quo option more often if they had visited Tram Chim before. The CL and RPL models show that respondents receiving cheap talk chose the status quo more frequently than those who did not receive cheap talk. This indicates that cheap talk reduced respondents' WTP for the wetland improvement. The CL reveals that the respondents with better education were more concerned about the increase in their electricity bill. However, this effect was not observed in the RPL models.
The CL and RPL without correlated parameters and modelled error components were compared to determine whether the RPL model is superior to the CL model. To this end, two tests were conducted. First, following Birol and Cox (Reference Birol and Cox2007), the Swait and Louviere log-likelihood ratio test was conducted. The log-likelihood decreases from −2459.043 in the CL model to −2451.236 in the RPL model. The calculated statistic (−2*[(−2459.043) − (−2451.236)] = 15.61) was greater than 5.99, the critical value of χ2 distribution at two degrees of freedom at 0.5 per cent significant level, where the degree of freedom is the difference in the numbers of parameters estimated between the two models. This indicates that the RPL model provides a significant improvement in model fit over the CL model.Footnote 7
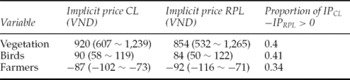
Second, the Poe et al. (Reference Poe, Giraud and Loomis2005) test was conducted to examine differences in implicit prices derived from the two models. The test results show that there was an insignificant difference between implicit price estimates produced by the CL and RPL models (table 7). However, the RPL shows heterogeneity in respondents' preference. It also has a better model fit, with a higher pseudo-R square and significantly lower log-likelihood estimates, compared to the CL model. Therefore, the RPL without correlated parameters and modelled error components was used for further analysis.
Testing for difference in implicit price in CL and RPL

Notes: Confidence intervals at 95%, calculated using Krinsky and Robb (Reference Krinsky and Robb1986) bootstrapping procedure, are given in parentheses.
This RPL model (table 7) shows that across the whole sample, respondents were on average willing to pay 854 VND (0.06 USD) for a 1 per cent increase in healthy vegetation and 840 VND (0.06USD) for an additional ten Sarus Cranes. However, respondents needed to be compensated 920 VND (0.06 USD) for every ten local households made worse-off.
4.3. Compensating surplus estimates
The compensating surplus for a specific management change scenario was calculated for each sub-sample. The status quo and the change scenarios in three years time are:
• Status quo scenario: 50 per cent healthy vegetation, 150 Sarus Cranes, 40 fish species, and no farmers affected.
• Change scenario: 60 per cent healthy vegetation, 300 Sarus Cranes, 40 fish species, and 800 households to be affected.
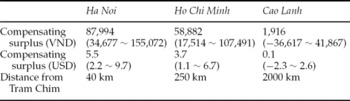
Indirect utilities of respondents for the two scenarios were calculated using the coefficients of the significant variables and the sample means of the socioeconomic variables. Table 8 reveals a reverse distance decay function. Respondents in Ha Noi were willing to pay VND 87,994 (USD 5.5). The average WTP of respondents in Ho Chi Minh City was VND 58,882 (USD 3.7). On the other hand, the WTP of Cao Lanh respondents was not significantly different from zero. This suggests that people in the Mekong River Delta were not willing to support the change in wetland management. This is because the marginal benefits derived from the wetland attributes were not large enough to compensate for the marginal costs caused, because local farmers were negatively affected.
Compensating surplus in three locations

Notes: Confidence intervals at 95%, calculated using Krinsky and Robb (Reference Krinsky and Robb1986) bootstrapping procedure, are given in parentheses.
Exchange rate: 16,000 VND = 1 USD
5. Discussion and concluding remarks
5.1. Wetland management
Respondents living on the periphery and outside the MRD were willing to pay for improved wetland biodiversity conservation resulting from changed dyke management in Tram Chim National Park. However, respondents were concerned about the impacts of dyke management on the local farmers. Their estimated values for wetland conservation initiatives, therefore, depended not only on wetland biodiversity improvement but also on the number of farmer households affected. This is consistent with the findings of Whitten and Bennett (Reference Whitten and Bennett2005) and Bennett et al. (Reference Bennett, Van Bueren and Whitten2004) in the Australian context.
Other factors influencing WTP include age, income, education, knowledge about Tram Chim, and distance to the wetlands. Among these factors, only the variable ‘age’ was found to have a different sign than that in other CM studies. In this study, older respondents had a higher WTP for wetland improvement. In contrast, Carlsson et al. (Reference Carlsson, Frykblom and Liljenstolpe2003) and Othman et al. (Reference Othman, Bennett and Blamey2004) reported that older respondents had lower WTP for wetland improvement in Swedish and Malaysian contexts, respectively. This might be because of cultural differences, but more research is needed to understand this better. Similar to findings reported by Morrison et al. (Reference Morrison, Bennett and Blamey1999), Carlsson et al. (Reference Carlsson, Frykblom and Liljenstolpe2003), Othman et al. (Reference Othman, Bennett and Blamey2004), Birol et al. (Reference Birol, Karousakis and Koundouri2006), and Birol and Cox (Reference Birol and Cox2007), incomes, education, and knowledge about wetlands were found to have positive signs, indicating that the WTP for wetland improvement increases when these factors increase. In particular, similar to the results reported by Birol et al. (Reference Birol, Karousakis and Koundouri2006), the WTP for wetlands was found to increase when the distance to the wetlands increases, indicating the inverse distance decay effect in WTP for wetlands.
Two assumptions were used to aggregate overall WTP from the survey results. First, the sub-samples were taken to represent three zones (Zone 1: inside the MRD, Zone 2: on the edge of the MRD, and Zone 3: far from the MRD). Second, the wetland benefits would be enjoyed by 1.5 million households in these zones, with half a million households in each zone. The aggregation was conducted using two approaches. In the first approach, it was assumed that 30 per cent of non-respondents had the same WTP as the respondents, following the method proposed by Morrison (Reference Morrison2000). In the second approach, non-respondents were assumed to have zero WTP, following Boyle and Bishop (Reference Boyle and Bishop1987). The aggregate WTP was calculated using the following equation
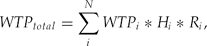
where WTPtotal is the aggregate WTP, WTPi is the mean WTP of zone i, Hi is the number of households in zone i, Ri is the response rate in zone i, and N is the number of zones.
The two approaches provided higher and lower bounds of aggregate WTP values. The higher and lower bound WTP estimates for the three populations were about USD 3.15 million and USD 2.54 million respectively (table 9). Because respondents were asked to select the alternative wetland outcomes that would happen in three years, they have already internally discounted their benefits. Therefore, these WTP estimates are the present values of benefits of the wetland conservation. On the other hand, the total cost of the proposed five-year conservation plan is USD 2.2 million (Tram Chim National Park Management Board, 2005). Using the discount rates of 3 and 20 per cent, the higher bound and lower bound present values of costs were estimated at USD 2.02 and USD 1.32 million respectively. The lower bound net social benefit was estimated by subtracting the higher bound cost from the lower bound WTP. Similarly, the higher bound benefit was calculated using the higher bound WTP and lower bound cost. The net social benefit of the program, therefore, ranged from USD 0.52 million to USD 1.84 million. This suggests that the proposed wetland conservation program would improve social welfare. It should be noted that this social net benefit could be higher if the global WTP for the wetland conservation is taken into account, given that the Tram Chim wetlands have been considered as a Ramsar site.Footnote 8
Aggregated WTP for Tram Chim wetland protection

5.2. Application of choice modelling in the developing country context
As choice modelling applications in the developing countries are relatively new, lessons from this study are helpful for future CM applications in the developing country context. Three main issues drawn from this study are the roles of focus group studies and questionnaire pre-tests, the design of questionnaires and the selection of survey modes.
The first issue is the importance of focus group studies and questionnaire pre-tests in the success of CM studies in developing countries. As Whittington (Reference Whittington2002) notes, the main challenge to stated preference practitioners is establishing plausible and understandable scenarios to respondents in developing countries. This is particularly true for choice modelling applications in which respondents face choice tasks that they may have never experienced before. Many of these challenges can be overcome by thorough focus group studies and pre-tests of the questionnaires. For example, focus groups in this study suggested that using an example of making choices when building a house would help respondents better comprehend the relevance of attributes in the choice tasks they faced. In addition, the pre-testing of the questionnaire helped identify the obstacles to respondents in understanding the questionnaire. For example, it was found that instead of using the term ‘referendum’, the questionnaire should explain how the voting scheme would work. This is because the term ‘referendum’ is not familiar to Vietnamese respondents who have not witnessed any referendum for the past 60 years.
Another important point identified from the focus groups was that some respondents selected options from the choice sets randomly due to their inability to cope with the task complexity and/or their intention to finish the interview as quickly as possible. Unlike some CV studies in which the majority of protest zeros was due to government distrust (Hadker et al., Reference Hadker, Shamra, David and Muraleedharan1997; Thuy, Reference Thuy2006), the largest proportion (41 per cent) of the protest zeros in this CM study resulted from respondents choosing at random. This has two implications for CM practitioners. First, this type of protest zero needs to be detected. One instrument for detection is the inclusion of a follow-up question directly asking how respondents chose their preferred options. Second, the sample size needs to take into account the potentially high protest rate, so that the number of final useable questionnaires is sufficient for statistical purposes. It should be noted that focus groups and questionnaire pre-tests might not be able to guarantee solutions to all problems. However, they are often helpful in identifying, in advance, critical issues that may hamper a study.
The second issue centres on the design of the questionnaire, including cheap talk script and the payment vehicle. With respect to cheap talk, it was found that the short version cheap talk could be used in the developing country context. While this short version has been found to be ineffective in reducing hypothetical bias in CV studies conducted for North American respondents (Aadland and Caplan, Reference Aadland and Caplan2006), it was found to reduce respondents' WTP in this study. In addition, the focus group studies showed that respondents found it easier to comprehend this type of cheap talk script rather than the long version developed by Cummings and Taylor (Reference Cummings and Taylor1999). This suggests a short cheap talk version be used to control for potential hypothetical bias in CM studies in the developing context.
With respect to the payment vehicle, it remains unclear whether an increase in the electricity bill is an appropriate payment vehicle. While the focus groups indicated that the electricity bill could be used, about 6 per cent of respondents in the survey did not support this payment vehicle. The reason is that they were not convinced about the reasons for selecting the electricity bill. This challenge was also reported by Thuy (Reference Thuy2006) when he used the electricity bill as a payment vehicle for a CV for the rhino conservation in Vietnam. Further research on payment vehicles is needed for CM application in developing countries where income tax, a common payment vehicle in developed countries, does not seem suitable due to its low population coverage (Do, Reference Do2007).
The last issue is the mode of surveys. Cook et al. (Reference Cook, Whittington, Do, Johnson and Nyamete2007) argue that by giving respondents more time to think, the drop off–pick up method provides more stable value estimates than personal interviews. This method was not employed in this study because the focus group participants did not support it. They believed that asking respondents to read a complex questionnaire by themselves might be too demanding and hence respondents would be unlikely to answer the questionnaire properly, if at all. However, in the survey, some respondents asked for more time to think about the choice sets. Therefore, a study of the influence of drop off–pick up and personal interview techniques on respondents' choices would provide more insight into this issue.
5.3. Concluding remarks
Wetlands in the MRD provide use and non-use values. Non-use values are represented by respondents' WTP for wetland biodiversity protection. In the specific case of a proposed change in dyke and wetland management program of Tram Chim National Park, the benefits enjoyed by the respondents resulting from biodiversity improvements were estimated at between 2.54 million and USD 3.15 million. These benefits outweigh the costs of implementing the change. This suggests that if more resources were allocated to wetland conservation in Tram Chim, social welfare would improve.
The wetland biodiversity values estimated in this study can be expected to increase as development progresses. With development, people will have higher incomes and better education. Consequently, their WTP for wetland biodiversity will increase, based on the findings in section 5.1 that WTP increases together with incomes and education. Therefore, caution is needed in the decision-making processes involving the trade-off between wetland conservation and economic development.
Despite its complexity in design and data analysis, CM has demonstrated its advantage in providing a rich data set in a developing country context. By using CM, not only the WTP for one overall change program but also the WTP for each wetland attribute and multiple other overall change strategies can be estimated. This helps wetland managers to prioritize the use of available resources for wetland management. In addition, CM enables the inclusion of not only wetland biophysical attributes but also conservation program's socioeconomic impacts on local households. Therefore, the value estimates derived from CM applications are more helpful to decision makers than those from the CV method because the values are derived in the context of the trade-off between environmental protection and development.
In conclusion, this study has shed light on biodiversity values of inland wetlands in the MRD. For the first time, these values have been quantified and can be used to justify wetland conservation in Vietnam. The study also provides some insights into the application of CM in a developing country context. Although further research on issues such as questionnaire design and survey method is needed, it can be concluded that CM can be applied in a developing country context to estimate non-market values of wetlands. This contributes not only to wetland management but also to other decision-making processes involving sustainable development in the whole region.