Introduction
Zirconia ceramic has a wide variety of clinical applications, such as fixed dental prostheses (FDPs), root posts, and implant abutments in reconstructive dentistry [Reference Zhu, Zhu, Ma, Weng, Wang, Shi, Li, Yan, Dong, Xu, Tang and Jin1, Reference Tartaglia, Sidoti and Sforza2, Reference Sonza, Della Bona and Borba3, Reference Kwon, Oh and Cho4, Reference Alao and Yin5]. It is highly suitable for dental use because of its high mechanical properties, natural tooth appearance, no cytotoxicity, reduction in bacterial adhesion, and low corrosion potential [Reference Ferrari, Vichi and Zarone6, Reference Ozcan and Bernasconi7, Reference Silva, Sailer, Zhang, Coelho, Guess, Zembic and Kohal8]. It provides an alternative for both dentists and laboratory workers [Reference Wittneben, Wright, Weber and Gallucci9]. These digital procedures replaced sensitive manual work as a result. It was much easier and more accurate to digitize implant positions, plan and design restorations virtually on a computer, and manufacture the restoration directly by milling [Reference Patzelt, Spies and Kohal10]. Briefly, the process starts from a die or wax pattern by optical or contact scanners. Afterward, an enlarged restoration is designed by computer software (CAD) and then a presintered ceramic blank is milled by computer-aided machining. The presintered milled dental framework is then fully sintered thereafter [Reference Denry and Kelly11, Reference Manicone, Rossi Iommetti and Raffaelli12]. However, the main drawback of this technology is the high cost of computer scanning and manufacturing system. Besides, with the hardness and brittleness of ceramic materials, extensive machining damage is induced in the milled surfaces, which cannot be healed in the sintering process [Reference Alao and Yin5]. There is a high risk of fracture when zirconia is used for crowns or fixed partial dentures in posterior teeth, resulting in a shortened life of zirconia restorations [Reference Nakamura, Nishida, Sekino, Nawa, Wakabayashi, Kinuta, Mutobe and Yatani13]. Thus, there is an urgent need to develop a new fabrication method for zirconia dental restorations.
Recently, electrophoretic deposition (EPD) method has been pursued both in academia and industry due to the possibility of reducing the manufacturing cost with simple apparatus, shorter processing times, and improved deposition yields [Reference Raju and Yoon14, Reference Yoon, Muksin and Raju15, Reference Chávez-Valdez and Boccaccini16]. EPD enables coatings to be obtained on both planar and complex shaped substrates [Reference Besra and Liu17]. Generally, organic solvents are preferred over water, due to the formation of gas bubbles in aqueous suspensions under high DC electric fields [Reference Raju and Yoon14, Reference Raju, Yu and Yoon18]. Even so, the use of water instead of toxic organic solvents not only allows the deposition of sensitive materials (such as biomolecules and biological entities) but also has cost advantages in addition to health and environmental concerns [Reference Besra and Liu17, Reference Chavez-Valdez, Herrmann and Boccaccini19]. Also, the dissociation power of water is high (dielectric constant ∼80.1), resulting in a buildup of charged particles; hence, low electric field strengths can be used [Reference Ammam20].
In clinical applications, the zirconia denture is subjected to different forces. This is especially important for oral rehabilitation where there are extremely strong masticator forces [Reference Majic Renjo, Curkovic, Stefancic and Coric21, Reference Mahoney, Rohanizadeh, Ismail, Kilpatrick and Swain22]. A closer understanding of the deformation behavior under different forces is required to enable these restorations to perform productively [Reference Mahoney, Holt, Swain and Kilpatrick23]. Nanoindentation testing is widely used to determine the mechanical properties of materials, such as hardness (H), elastic modulus (E), and creep behavior [Reference Angker and Swain24]. In this study, the effect of different applied loads on hardness and elastic modulus in a simulated oral environment was investigated by the method of progressive multicycle measurement nanoindentation.
The objective of this work is to provide an EPD method for fabrication of dense zirconia dental ceramic from aqueous suspensions instead of toxic organic solvents. In this work, tetragonal zirconia polycrystalline stabilized with 3 mol% Y2O3 (3Y-TZP) as an ideal dental restoration was directly fabricated on dental gypsum model by aqueous EPD. It is expected that aqueous EPD zirconia dental ceramic would exhibit excellent mechanical properties.
Results and discussion
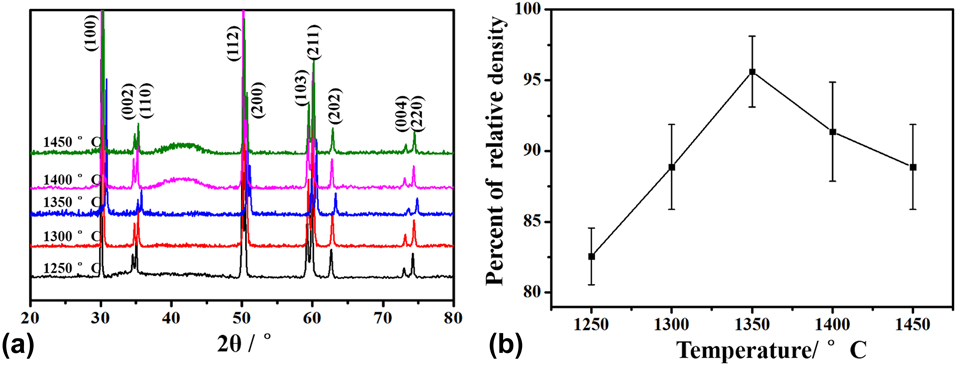
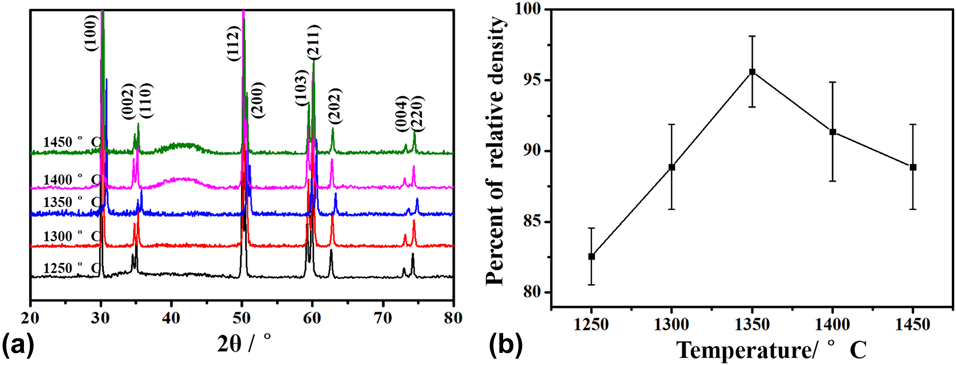
Figure 1(a) shows the XRD patterns of ZrO2 coating with sintering temperatures ranging from 1250 to 1450 °C. The crystallographic planes are indexed in Fig. 1(a). The (100) preferential orientation was prevalent, which is characteristic of ZrO2 coatings. However, the diffraction peak of Y2O3 was not observed. The XRD spectra indicated that aqueous EPD ZrO2 coating possessed a tetragonal phase structure (t-ZrO2), which is only stable at temperatures of 1170–2370 °C. Thus, alloying pure zirconia with 3 mol% Y2O3 allows the retention of the metastable tetragonal structure at room temperature [Reference Apratim, Eachempati, Krishnappa Salian, Singh, Chhabra and Shah25]. The diffraction peaks of the t-ZrO2 coating shifted to high angles as the sintering temperature increases from 1250 to 1350 °C, owing to the decreased lattice parameter. No shift in diffraction peaks was observed for the samples sintered at 1400 and 1450 °C. It should be noted that a broad scattering peak was superimposed on the sharp peaks of reinforced crystal phases for the samples sintered at 1400 and 1450 °C. This indicates that a small amount of amorphous phase was formed in t-ZrO2 coating. Stemmer et al. reported that the formation of an amorphous grain boundary phase is dependent on the impurity content of ZrO2 starting powders [Reference Stemmer, Vleugels and Van Der Biest26]. At high sintering temperatures, SiO2, Al2O3, HfO2, and other trace impurity oxides combined to form a liquid phase which is retained as a glass upon cooling [Reference Mecartney27]. Figure 1(b) shows the relative density of EPD zirconia as a function of sintering temperature. The bulk density of zirconia coatings rose initially and then declined. A maximum relative density of 94.2% was obtained at a sintering temperature of 1350 °C. It suggests that the internal porosity in ZrO2 disappeared during sintering. With further increase in temperature, the relative density of zirconia coatings decreased. This might result from the formation of an amorphous phase as well as some pores and defects due to overburning.
(a) XRD patterns and (b) relative density of EPD ZrO2 coating with sintering temperature range from 1250 to 1450 °C.
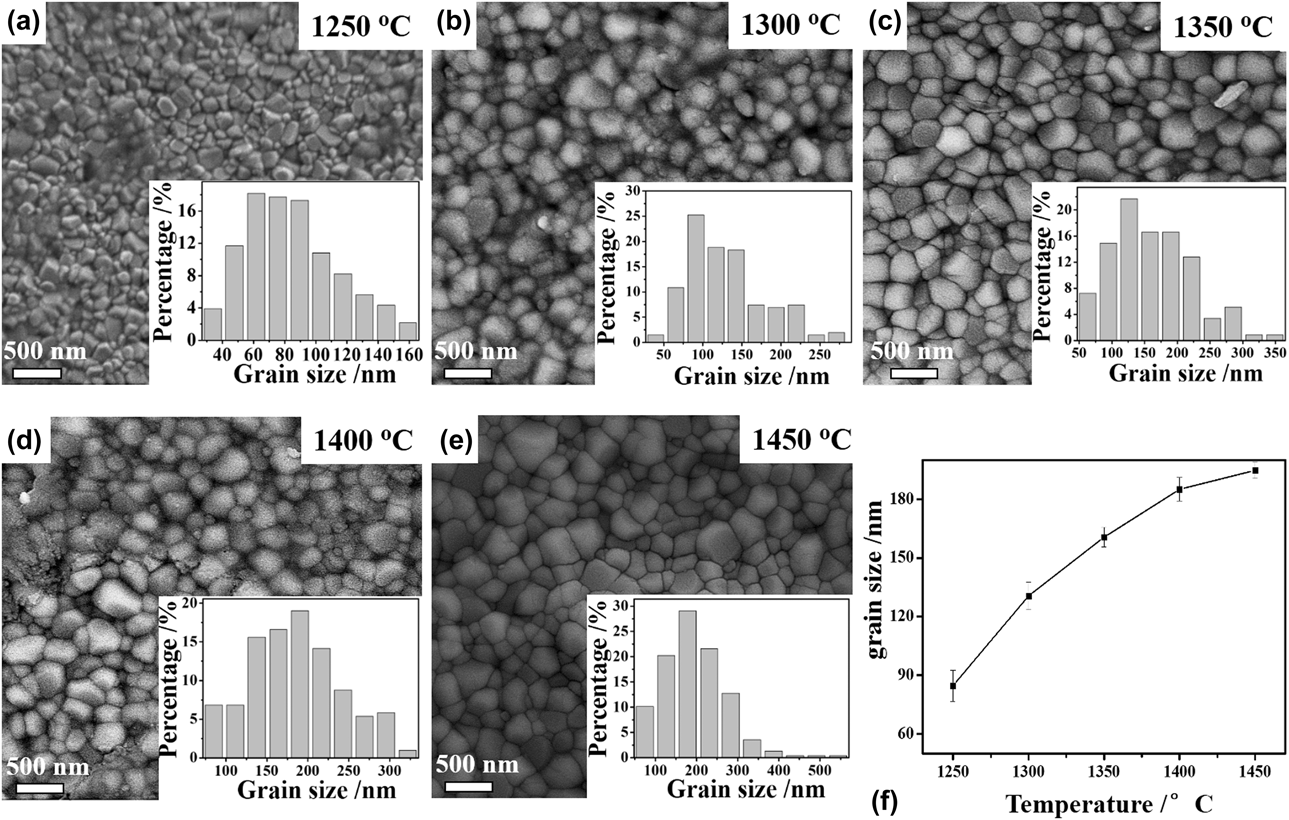
Figures 2(a)–2(e) present the surface SEM micrographs of EPD ZrO2 coating sintered at different temperatures (1250–1450 °C). The histograms of the grain size distribution are shown in the inset of Figs. 2(a)–2(e). The evolution of mean grain size (MGS) with sintering temperatures is presented in Fig. 2(f). It can be observed that all the samples prepared by aqueous EPD method had a dense and cohesive surface morphology as seen in Figs. 2(a)–2(e). In general, hydrogen and oxygen gases are evolved at the cathode and anode, respectively. During the aqueous EPD process, preventing the formation of bubbles is a challenge, since the presence of these bubbles leads to porous morphologies, which disturbs the electrophoresis of the particle and hinders the deposition process [Reference Besra, Uchikoshi, Suzuki and Sakka28]. The possible reason for the dense zirconia coating was the aqueous suspensions with a high solid content of 50 wt% under a high voltage of 30 V. With a high solid content, there will be less water for the formation of the bubbles and a high applied field will result in higher electrophoretic mobility of ZrO2. In Fig. 2(f), the average grain size of ZrO2 increased continuously with increased sintering temperatures. The MGS increased gradually from ∼84.6 to ∼160.5 nm.
(a–e) SEM micrographs of the surface microstructure of the EPD ZrO2 coating after sintering. (f) Evolution of average grain size with sintering temperatures.

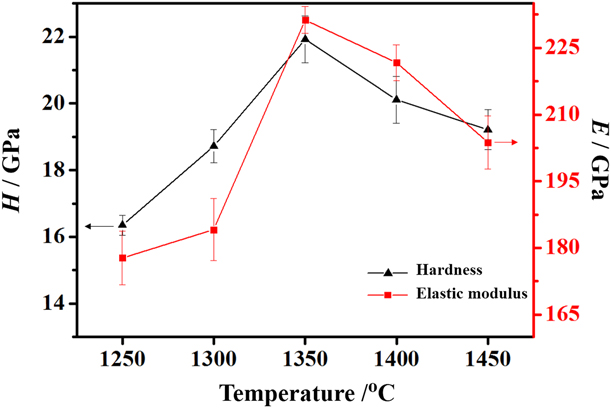
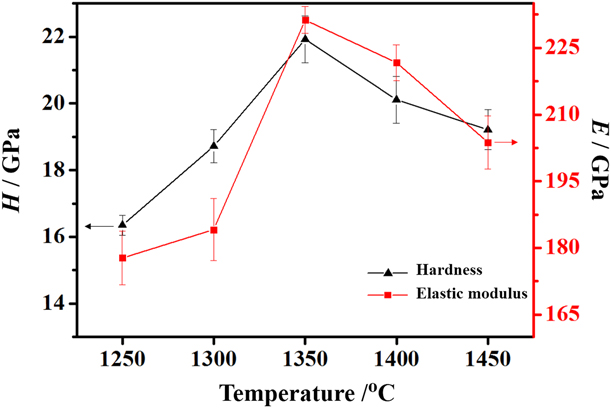
Figure 3 shows the variations in hardness and the elastic modulus with different sintering temperatures. The hardness increased rapidly with an increase in temperature between 1250 and 1350 °C and then decreased slowly after a maximum value was reached. The elastic modulus shows almost a similar trend. The maximum hardness and elastic modulus are 21.93 GPa and 231.28 GPa, respectively. The increasing hardness and elastic modulus of the coatings result not only from increased lattice parameter and MGS but also from decreased porosity during sintering. When the sintering temperature was higher than 1350 °C, both the hardness and elastic modulus gradually decreased due to the presence of pores and defects caused by overburning. Also, the formation of amorphous phase may lead to a decrease in hardness and elastic modulus according to the XRD results. Hardness is an important property in determining a material’s service performance. The optimum sintering temperature was 1350 °C, due to the highest hardness and relative density. It should be noted that the measured mean loading-rate-independent intrinsic hardness and the elastic modulus for ZrO2 are 13.15 GPa and 168.19 GPa, respectively [Reference Alao and Yin29]. The measured hardness and elastic modulus in the present study were higher than the intrinsic value of ZrO2, due to the smaller contact depth during nanoindentation. The hardness value of 1350 °C-sintered sample was close to the hardness of four commercially synthesized zirconia dental ceramic as reported by Shao et al., which were also measured by nanoindentation [Reference Shao, Jiang and Gong30]. Guazzato et al. assessed the hardness and elastic modulus of dry-pressed and fully sintered commercial zirconia block by the method of Vickers indentation [Reference Guazzato, Albakry, Ringer and Swain31]. The hardness and elastic modulus were 11–13 GPa and 220–265 GPa, respectively. Thus, it clearly proves that the aqueous EPD ZrO2 coating also has excellent mechanical properties.
Variations in hardness and elastic modulus with different sintering temperatures.
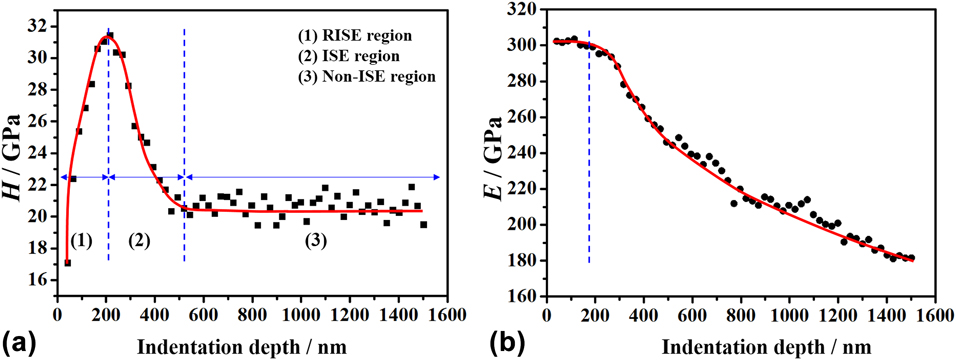
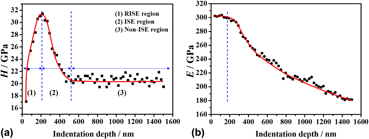
The evolution of H and E with different indentation depths of the sample sintered at 1350 °C is shown in Fig. 4. The hardness values fluctuated with different indentation depths resulting from the ISE [Reference Cao, Lu, Meng and Ngan32, Reference Xiao, Yuan, Jia, Yang, Li and Shu33]. It can clearly be seen that H exhibited a reverse indentation size effect (RISE) as h c < 214.97 nm, as shown in Fig. 4(a). The hardness increased from 17.09 to 31.44 GPa with an increase in the indentation depth. When the indentation depth was within the range of 214.97–568.2 nm, the evolution of H showed a normal ISE behavior. The H value gradually decreased with an increase in the indentation depth. The hardness was independent of indentation depth when h c was higher than ∼568.2 nm and the measured H value approached a stable value of ∼21 GPa. Ebisu and Luo et al. observed a similar hardness change phenomenon for 8 mol% yttria-stabilized zirconia coating [Reference Ebisu and Horibe34, Reference Luo, Dai, Shen and Mao35]. Figure 4(b) shows that E value was kept constant (299.1–302 GPa) as the indentation depth increased from ∼41.1 to ∼189.7 nm; also, the value of E value was found to decrease with an increase in h c. The results proved that zirconia coatings also exhibited better mechanical properties at low loads compared with the sample at a constant load of 10 mN as seen in Fig. 3.
Evolutions of (a) hardness with three regions, (I) RISE, (II) ISE, and (III) no ISE, and (b) elastic modulus with different indentation depths.
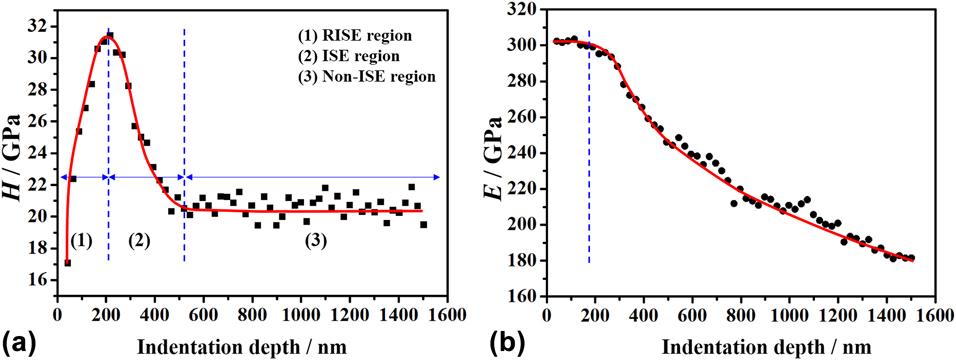
Effects of the indentation depth on the hardness were mainly investigated for nanocrystalline ceramics [Reference Ebisu and Horibe34, Reference Zhu, Bushby and Dunstan36, Reference Ren, Hooper, Griffiths and Henshall37, Reference Page, Oliver and McHargue38]. Li and Bradt considered that indentation cracking contributes to the reverse ISE. For brittle materials, it is common that specimen cracking occurs during the indentation loading half-cycle [Reference Li and Bradt39]. Sangwal et al. proposed that the reverse ISE is associated with the relaxation of surface stresses as a result of the development of indentation cracks at small loads [Reference Sangwal40, Reference Sangwal and Surowska41, Reference Sangwal and Kłos42]. With an increase in penetration depths (>214.97 nm), the hardness exhibited a normal ISE. The indenter penetrates beyond the surface, and the bulk density of the inner zone may be different from the surface density [Reference Sebastian and Khadar43]. One important reason for normal ISE is that dislocations formed around small indents are much more difficult to propagate [Reference Bull44]. In addition, the dislocation motion will be hindered due to cross-slip from one slip to another [Reference Sangwal40, Reference Sangwal45]. The density of these dislocations becomes increasingly dominant, resulting from the gradient increase in inverse proportion to the size of the indent [Reference Fleck, Muller, Ashby and Hutchinson46, Reference Elmustafa, Eastman, Rittner, Weertman and Stone47]. With further increase in loads, the hardness reaches a constant value, which can be regarded as the intrinsic hardness value. Nevertheless, the elastic modulus value showed no ISE phenomenon. As the contact depth was higher than ∼189.7 nm, the gradual decrease in elastic modulus is thought to be associated with the tetragonal–monoclinic (t–m) phase transformation which provides a local dilatational strain on the surrounding microstructure [Reference Liu, Wang, Xiao, Yuan and Shu48]. The t–m stress-induced phase transformation during nanoindentation was the primary cause of dental zirconia failures, resulting in local volume increase that generates compressive stresses and arrests the crack from propagating [Reference Majic Renjo, Curkovic, Stefancic and Coric21]. The results indicate that the hardness of EPD zirconia coatings presents an excellent performance at both low and high loads. The failure of zirconia coating mainly occurred at high loads, resulting from the t–m phase transformation.
Conclusions
In the current research, the mechanical properties of aqueous EPD zirconia dental ceramic were investigated. This study revealed that aqueous EPD zirconia dental ceramic also had excellent mechanical properties. The simulative experiment testified that hardness of aqueous EPD ZrO2 exhibited reverse ISE behavior and then displayed a normal ISE response. The relaxation of surface stresses resulting from indentation cracks at small loads is responsible for the RISE hardness behavior, and geometrically necessary dislocations led to the normal ISE behavior. The elastic modulus gradually decreased when the indentation depth exceeded a critical value of ∼189.7 nm. This was attributed to stress-induced t–m transformation caused by stress concentration on the ceramic under the triangular pyramid indenter.
Experimental procedures
ZrO2 nanoparticles containing 3 mol% Y2O3 (Tosoh, Japan) powder with mean particle size (d 50) of ∼40 nm were used as the parent material. The chemical analysis provided by the manufacturer gave SiO2 content of <0.02 wt%, HfO2 content of <5.0 wt%, and Al2O3 content of 0.1–0.4 wt%. The suspension with a high solid content of 50 wt% was prepared by adding 50 g ZrO2 into 50 mL of deionized water, and the pH value of 6.0 was adjusted via the addition of citric acid to the suspension. To disperse the particles homogeneously in the aqueous media, the prepared solution was magnetically stirred for 60 min and subsequently placed in an ultrasonic bath with a frequency of 50 kHz for 60 min. The suspension was deposited on a dental gypsum plate with a dimension of 15 × 5 × 5 mm3 for the EPD process.
Prior to the deposition, gypsum plate substrates were polished with SiC paper with a grit of 1200 followed by ultrasonication in deionized water. The dental gypsum plate was fixed with two platinum sheets with a dimension of 20 × 30 mm2 separated by a distance of 15 mm, one of the sheets acting as a working electrode and the other as a counter electrode. The platinum sheets were then immersed in the suspension while a nonconducting tape masked one side of the working electrode. The EPD process of the ZrO2 coatings lasted for 15 min under a constant voltage of 30 V. The thickness of the ZrO2 coatings was about 2 mm. After the deposition, the green coatings were dried in air for 24 h at room temperature, and then the ZrO2 coatings were carefully peeled off from dental gypsum plate. Sintering of the coatings was carried out at temperatures between 1250 and 1450 °C with a heating rate and cooling rate of 10 °C/min and a holding time of 2 h. More details about the deposition and thermal treatment system used in this work are available in previous research [Reference Jin49].
The phase composition of the coatings was measured by X-ray diffraction (XRD; D8 Venture, Bruker) in the 2θ = 20–80° range at a step size of 0.04°. The density of zirconia coatings was measured using Archimedes’ principle (MH-300A). Relative density was based on a 6.02 g/cm3 theoretical density which was calculated from lattice parameter measurements. The surface morphology and grain size of the EPD coating were characterized by a scanning electron microscope (SEM; Zeiss Merlin Compact). The hardness and elastic modulus of coatings were determined by a nanoindentation test on a commercial nanoindenter (NHT2, Anton Paar) with a Berkovich diamond indenter. Prior to the nanoindentation tests, the samples were ground and polished with a final step using 0.5-μm diamond paste. The hardness and the elastic modulus of the coatings were calculated by Hertz contact theory and the Oliver and Pharr equation [Reference Johnson50, Reference Oliver and Pharr51, Reference Sneddon52]. According to the Oliver and Pharr equation,
 $${h_{\rm{c}}} = {h_{{\rm{max}}}} - \varepsilon {{{P_{\max }}} \over S}\quad ,$$
where h c is the contact depth, h max is the maximum displacement, ε is a constant that depends on the geometry of the indenter (ε = 0.75 for a Berkovich indenter), P max is the maximum load, and S is contact stiffness [Reference Liu, Wang, Xiao, Yuan and Shu48].
The contact stiffness can be calculated through the relation below:
 $$S = 2\beta \sqrt {{A \over \pi }} {E_{\rm{r}}}\quad ,$$
where β is a constant that depends on the geometry of the indenter (β = 1.034 for a Berkovich indenter) [Reference Pharr, Oliver and Brotzen53] and E r is the reduced elastic modulus, which accounts for the fact that elastic deformation occurs in both the sample and the indenter [Reference Li and Bhushan54]. E r is given by,
 $${1 \over {{E_{\rm{r}}}}} = {{1 - {\nu ^2}} \over E} + {{1 - \nu _{\rm{i}}^{\rm{2}}} \over {{E_{\rm{i}}}}}\quad ,$$
where E and ν are the Young’s modulus and Poisson’s ratio for specimen (the Poisson’s ratio of zirconia was 0.3), respectively. E i and νi are elastic constant and Poisson’s ratio for the indenter [Reference Alao and Yin5]. The relevant contact area function and effective indenter tip radius were carefully calibrated using a standard fused quartz and then fitted by the area function:
 $${A_{\rm{c}}} = \sum\limits_{n = 0}^8 {{C_n}{{\left( {{h_{\rm{c}}}} \right)}^{{2^{1 - n}}}}\quad ,}$$
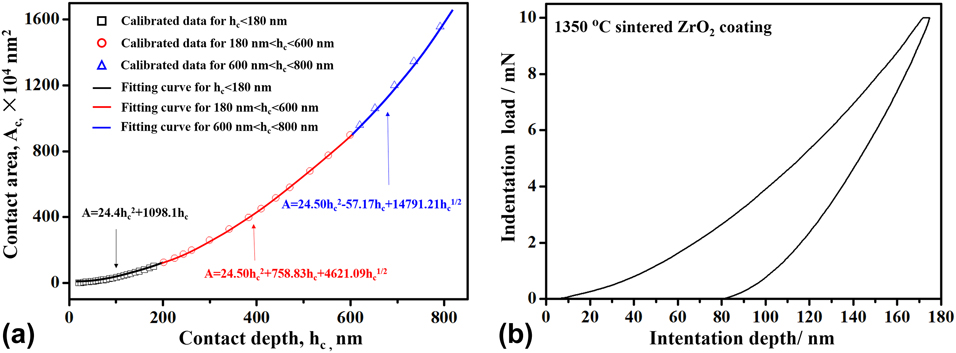
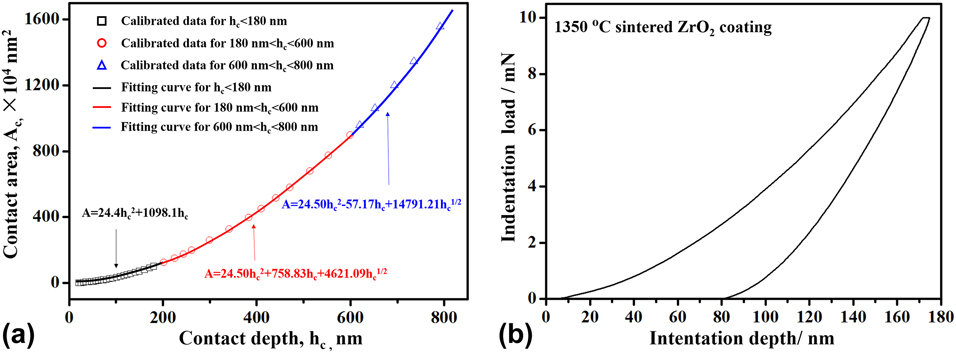
where C n is a constant. The experimental data are fitted by Eq. (4), as shown in Fig. 5(a). Area function of the real Berkovich indenter tip was evaluated as A = 24.4h c2 + 1098.1h c for h c < 180 nm. The tip radius is described by C 1 = 2πR [Reference Oliver and Pharr51]. In this study, the tip radius was estimated as 120.9 nm for h c < 180 nm. For a large indentation, the area function was evaluated as A = 24.50h c2 + 758.83h c + 4621.09h c1/2 for 180 < h c < 600 nm and A = 24.50h c2 − 57.17h c + 14791.21h c1/2 for h c > 600 nm. The indentation data at different indentation depth were analyzed based on proper area function.
(a) Piecewise fitted functions of indenter contact area A c and contact depth h c with a standard fused quartz sample. (b) A typical load–depth curve of 1350 °C-sintered ZrO2 coating.
Thus, the hardness is estimated from the load–indentation depth (P–h) curves:
 $$H = {{{P_{\max }}} \over {{A_{\rm{c}}}}}\quad .$$
To understand the effect of sintering temperature on the mechanical properties of ZrO2 coating, nanoindentation tests were carried out at room temperature with a maximum load of 10 mN and a loading rate of 20 mN/min. Indentation tests at each sample were repeated at least 10 times, and the results were consistent. The typical load–depth curve of 1350 °C-sintered ZrO2 coating is presented in Fig. 5(b).
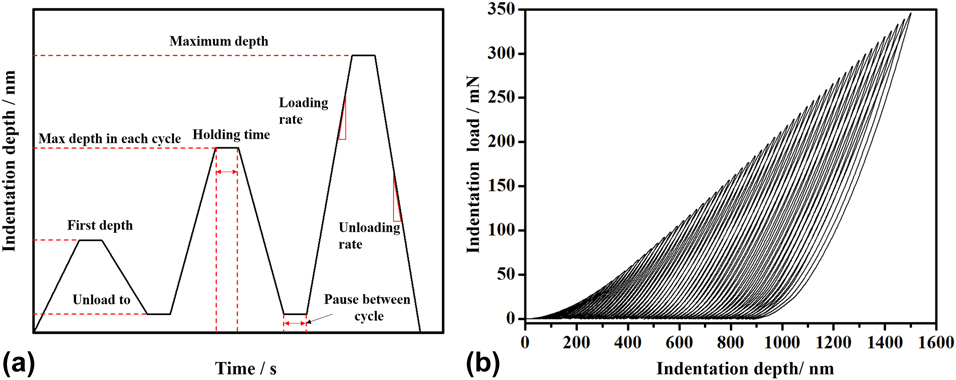
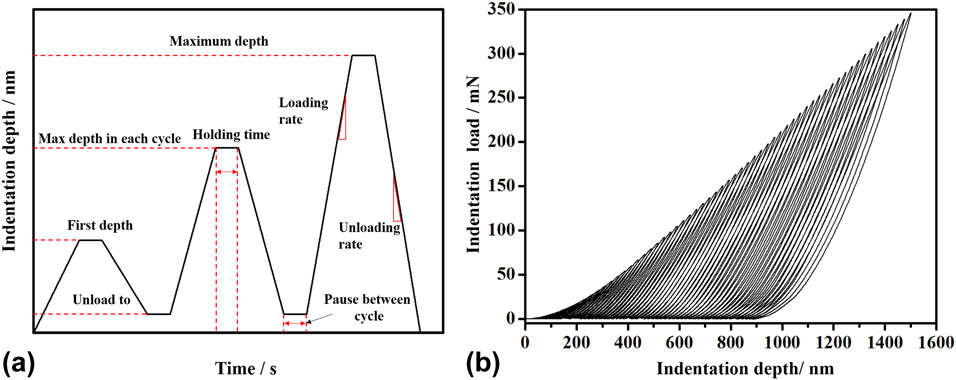
A progressive multicycle indentation with 60 cycles was introduced to highlight the commonly observed indentation size effect (ISE) of the 1350 °C-sintered sample at room temperature. The schematic indentation depth–time curve for the progressive multicycle indentation test (three cycles) is shown in Fig. 6(a). The first depth was 60 nm, and the maximum indentation depth was 1500 nm. For each cycle, the indentation depth was unloaded to 8 nm. The holding time of each cycle at the maximum load and pause time between cycles were both 10 s. In each cycle, the maximum load was computed with the number of cycles and the difference between first depth and the maximum depth. The loading and unloading rates were both 30 mN/min. The load–depth curve of the progressive multicycle indentation of 1350 °C-sintered ZrO2 coating is shown in Fig. 6(b). The hardness and elastic modulus of the samples were obtained as a function of indentation depth for pristine ZrO2 coating. To achieve consistent results, multicycle indentation tests were repeated 10 times.
(a) Schematic indentation depth–time curve for the progressive multicycle indentation test. (b) Load–depth curve of progressive multicycle indentation of 1350 °C-sintered ZrO2 coating.
Acknowledgment
This work was supported by the National Natural Science Foundation of China (51501074), China Postdoctoral Science Foundation (2016M602983), and Postdoctoral Science Foundation of Jiangsu (1601047A). The authors also thank Dr. I. Asempah for his valuable help in improving the language of the manuscript.