


1. Introduction
The classic generative view of phonology includes the important claim that phonological representations are discrete, which is typically implemented with binary features (Halle Reference Halle1959; Chomsky & Halle Reference Chomsky and Halle1968; Kenstowicz & Kisseberth Reference Kenstowicz and Kisseberth1977, Reference Kenstowicz and Kisseberth1979; Kenstowicz Reference Kenstowicz1994; Hale et al. Reference Hale, Kissock and Reiss2007). The representational claims of generative research, particularly evident in The Sound Pattern of English (Chomsky & Halle Reference Chomsky and Halle1968), led to rich discussion of the nature of phonological representations throughout the next two decades. More recently though, researchers have argued that phonological representations need to include gradience to capture observed patterns. One central area of debate has centered around the phenomenon of incomplete neutralisation, wherein a phonological process putatively neutralising the distinction between two categories results in surface representations in which the categories are still distinct phonetically. For example, prosodic word-final devoicing in German has been observed to result in a derived voiceless category that is subtly phonetically distinct from the realisation of the underlying voiceless category (Port & O’Dell Reference Port and O’Dell1985; Roettger et al. Reference Roettger, Winter, Grawunder, Kirby and Grice2014). While some have argued that such results suggest a need for gradience in representations (Port & Leary Reference Port and Leary2005; Goldrick & Cole Reference Goldrick and Cole2023), others have argued that the small differences reported stem from performance factors (Fourakis & Iverson Reference Fourakis and Iverson1984; Manaster Ramer Reference Manaster Ramer1996; Warner et al. Reference Warner, Jongman, Sereno and Kemps2004; Du & Durvasula Reference Du and Durvasula2022, Reference Du and Durvasula2025). As we point out below, the import of observed incomplete neutralisation on phonological representations is often quite indirect, given that it depends on many other tacit assumptions made by researchers, including the assumption that the relevant process is indeed phonological.
In fact, probing the phonological status of the patterns under investigation has been the explicit goal of some recent work. This research has sought to establish the phonological relevance of incomplete neutralisation by demonstrating phonological interactions involving the incomplete neutralisation process (Braver & Kawahara Reference Braver, Kawahara, Albright and Fullwood2014; Braver Reference Braver2019; McCollum Reference McCollum2019a,Reference McCollum, Hout, Mai, McCollum, Rose and Zaslanskyb; Du & Durvasula Reference Du and Durvasula2022). A particularly interesting and nuanced case within this line of argumentation comes from Reference McCollumMcCollum’s (Reference McCollum2019a,Reference McCollum, Hout, Mai, McCollum, Rose and Zaslanskyb) work on Uyghur vowel harmony. In (1), non-initial vowels alternate according to the backness of the initial-syllable vowel.Footnote 1 In a theory with binary [±back], the output of harmony in (1) is categorically either [ɑ] or [æ] depending on the backness of the initial vowel. However, McCollum reports that results from a production study support the proposition that non-initial back vowels are incrementally fronted, while front vowels exhibit no comparable positional differences. To account for this, he contends that [back] is continuously valued between 0 and 1. Initial-syllable back vowels are produced as [1 back] and non-initial back vowels are produced with backness values between 0 and 1, such as [0.8 back]. In essence, the pattern is iterative incomplete neutralisation – each incompletely assimilated vowel triggers further incomplete assimilation in the following syllable, generating the reported sub-phonemic fronting pattern.

McCollum uses harmony’s interaction with a structure-preserving consonantal alternation to support his argument that harmony is both phonological and gradient. However, Du & Durvasula (Reference Du and Durvasula2022) argue that demonstrating that a pattern is phonetically gradient and interacts with some phonological process is not a sufficient reason to introduce gradience into the phonology. They find that phonetically incompletely neutralised tonal contrasts in Huai’an Mandarin interact with tone sandhi patterns in a manner that suggests the incompleteness of the tonal alternation is irrelevant for the phonology. They claim that gradient tone height in Huai’an Mandarin derives from performance factors, rendering the gradience non-phonological. While Du & Durvasula’s (Reference Du and Durvasula2022) findings centre on a postlexical pattern, and many previously discussed patterns of incomplete neutralisation are arguably post-cyclic or postlexical, Reference McCollumMcCollum’s (Reference McCollum2019a,Reference McCollum, Hout, Mai, McCollum, Rose and Zaslanskyb) findings are distinct in that they emerge from the lexical phonology of the language. In the words of Cohn (Reference Cohn, Fanselow, Féry, Schlesewsky and Vogel2006: 36), this claim, if true, ‘would strike at the core of our understanding of the phonology’.
In this article, we further probe the Uyghur backness harmony pattern with two production studies to attempt to derive the incomplete neutralisation of [back] from other factors, specifically phrasal interpolation, centralisation and local consonant–vowel coarticulation. To preview our results, our findings support the case that the observed gradience is derivable from the interaction of coarticulation and centralisation, but not from interpolation. In turn, our results suggest there is no need for gradient representations in the phonology of the language.
2. Background
2.1. Incomplete neutralisation
In this section, we look more closely at a specific case of incomplete neutralisation, namely final devoicing, in order to examine the issues relevant to any discussion of the general phenomenon of incomplete neutralisation. Final devoicing has been observed in a variety of languages, including Catalan (Dinnsen & Charles-Luce Reference Dinnsen and Charles-Luce1984), Dutch (Warner et al. Reference Warner, Jongman, Sereno and Kemps2004; Ernestus & Baayen Reference Ernestus, Baayen, Goldstein and Best2006), German (Port & O’Dell Reference Port and O’Dell1985; Roettger et al. Reference Roettger, Winter, Grawunder, Kirby and Grice2014), Malay (Abu Bakar et al. Reference Abu Bakar, Durvasula, Pincus and McKinnon2007), Pennsylvania Dutchified English (Anderson & Davis Reference Anderson and Davis2013) and Russian (Dmitrieva Reference Dmitrieva2005; Kharlamov Reference Kharlamov2012; Matsui Reference Matsui2015), among others. Though the general pattern is similar, the exact phonological domain of application differs across languages. Here, we look specifically at the pattern in German, both to be concrete and because there is a substantial amount of work on it. The final devoicing pattern in German is best described as prosodic word-final devoicing (Wagner Reference Wagner2002), and can be descriptively stated in a rule-based framework as in (2). Note that though devoicing is usually presented as a structure-changing process that introduces [−voice], we follow Iverson & Salmons (Reference Iverson and Salmons1995, Reference Iverson and Salmons2003) and Beckman et al. (Reference Beckman, Jessen and Ringen2013) in analysing it as a rule inserting [+spread glottis] on prosodic word-final obstruents.

While the process is described as a case of phonological neutralisation, it has been known since the 1980s that in German, devoiced prosodic word-final voiceless obstruents are not phonetically identical to underlyingly voiceless prosodic word-final obstruents (Port & O’Dell Reference Port and O’Dell1985; Roettger et al. Reference Roettger, Winter, Grawunder, Kirby and Grice2014, among others). In fact, a variety of small differences have been noticed along dimensions that typically distinguish voiced and voiceless obstruents – for example, differences in preceding vowel duration and consonant closure duration.
Despite continued observation of incomplete voicing neutralisation in German across many experiments, the source of the incomplete neutralisation has not been resolved. Some have argued that the observation falsifies models of generative phonology with categorical representations (Port & Leary Reference Port and Leary2005; Goldrick & Cole Reference Goldrick and Cole2023). However, others have rejected this interpretation, contending that the observed incomplete neutralisation effect is actually a task effect (Fourakis & Iverson Reference Fourakis and Iverson1984; see Winter & Roettger Reference Winter and Roettger2011 and Roettger et al. Reference Roettger, Winter, Grawunder, Kirby and Grice2014 for discussion). Others have argued that the observed incomplete neutralisation is actually an orthographic effect (Manaster Ramer Reference Manaster Ramer1996; Warner et al. Reference Warner, Jongman, Sereno and Kemps2004), though in some other cases orthography is not responsible for the observed phonetic differences (Braver Reference Braver2013). Alternatively, some have pointed out that one could reject the claim that the devoicing process is truly phonological, in which case the argument is moot (Dunbar Reference Dunbar2013; Braver & Kawahara Reference Braver, Kawahara, Albright and Fullwood2014; Braver Reference Braver2019). Taking a markedly different approach, van Oostendorp (Reference van Oostendorp2008) contends that generative phonological theories can account for such patterns without recourse to gradient information if given access to representations beyond just inputs and outputs, specifically turbid representations (Goldrick Reference Goldrick2000).
Finally, and somewhat related to the previous issue, some have argued against the basic premise behind incomplete neutralisation claims. These authors dispute the relevance of incomplete phonetic neutralisation for phonological theories with categorical representations (Chomsky & Halle Reference Chomsky and Halle1968; Lyons Reference Lyons and Preece1974; Hammarberg Reference Hammarberg1976, Reference Hammarberg1982; Kahn Reference Kahn1976; Mohanan Reference Mohanan1986; Du & Durvasula Reference Du and Durvasula2022, Reference Du and Durvasula2025). As discussed extensively in Du & Durvasula (Reference Du and Durvasula2025), claims from classical generative phonology are ultimately ceteris paribus claims: the expectation of phonetic neutralisation is only true if all other factors are held constant. We follow up on this issue below, showing that the evidence of incomplete (asymmetrical) neutralisation that McCollum (Reference McCollum2019a,Reference McCollum, Hout, Mai, McCollum, Rose and Zaslanskyb) observed, while replicable, ultimately stems from inadequate control – that is, from a violation of the ceteris paribus clause.
To be clear, while our findings suggest that previous reports of iterative incomplete neutralisation in Uyghur are spurious, they do not invalidate all reported or other potential cases of incomplete neutralisation. Furthermore, incomplete neutralisation is only a challenge to the sort of classical generative grammatical architecture assumed herein, which involves distinct phonological and phonetic modules, with limited access to phonetic information in the phonology. Incomplete neutralisation does not challenge grammatical architectures that merge the phonology and phonetics, since these allow access to gradient information throughout (e.g., Browman & Goldstein Reference Browman and Goldstein1989; Flemming Reference Flemming2001).
2.2. Uyghur
Uyghur (iso: uig) is a Southeastern Turkic language spoken by approximately 12 million people, primarily in the Xinjiang Uyghur Autonomous Region in northwestern China. Notable populations of Uyghur speakers live in Kazakhstan, Kyrgyzstan and Uzbekistan; a large diaspora population of Uyghurs is also present in Europe and North America (Nazarova & Niyaz Reference Nazarova and Niyaz2013). There are three main dialect groups – Central, Southern and Eastern (Tenishev Reference Tenishev and Borovkov1963). Roughly, 90% of Uyghur speakers speak the Central dialect (Yakup Reference Yakup2005), of which the variety spoken along the Ile River in southeastern Kazakhstan is a subdialect.
2.2.1. Vowel inventory
Eight vowels are contrastive in Uyghur: /i y e ø æ ɑ o u/. The vowel /e/ is marginal, occurring in initial syllables as a product of a raising process often called umlaut, as well as in non-nativised loans (Hahn Reference Hahn1991; Mayer et al. Reference Mayer, McCollum and Eziz2022; Sharma Reference Sharmain press). Featural descriptions for each vowel in the Uyghur inventory are presented in Table 1.
Uyghur vowel inventory.

Table 1 Long description
The table is organized into two main columns for backness: minus back and plus back. Each is subdivided into minus round and plus round columns.
* The first row, labeled plus high, contains the vowel i under minus back minus round, y under minus back plus round, and u under plus back plus round.
* The second row, labeled minus high minus low, contains e under minus back minus round, ø under minus back plus round, and o under plus back plus round.
* The third row, labeled plus low, contains æ under minus back minus round and ɑ under plus back minus round.
Cells for plus back minus round in the high and mid rows, and all plus round cells in the low row, are empty.
2.2.2. Vowel harmony
Uyghur exhibits two types of vowel harmony, backness and rounding harmony.Footnote 2 Both harmonies are described in a number of publications (Nadzhip Reference Nadzhip1971; Hahn Reference Hahn1991; Vaux Reference Vaux2000; Engesæth et al. Reference Engesæth, Yakup and Dwyer2009; McCollum Reference McCollum2019a,Reference McCollum, Hout, Mai, McCollum, Rose and Zaslanskyb; Mayer Reference Mayer2021; Mayer et al. Reference Mayer, McCollum and Eziz2022). Of the two, backness harmony is more robust. Rounding harmony is highly restricted, applying to certain high vowels in certain environments in the standard dialect (Hahn Reference Hahn1991; McCollum Reference McCollum2019a; cf. Abdurehim Reference Abdurehim2014 on the Lopnor dialect). For this reason, rounding harmony will not be further discussed.
Backness harmony produces contrast-neutralising alternations among the low vowels and high rounded vowels, as seen in (3) and (4). In these examples [æ y] occur after [−back] roots, while [ɑ u] occur after [+back] roots. Observe also in (3) and (4) that the dorsal consonant of the dative and gerundial suffixes varies according to vowel backness: velar [k g] co-occur with front vowels, while uvular [q ʁ] co-occur with back vowels. Local voicing assimilation determines the voicing of these suffix-initial consonants.


The vowels /e i/ do not trigger backness harmony; the backness of following vowels is lexically determined (Lindblad Reference Lindblad1990; Mayer et al. Reference Mayer, Major, Yakup, Jurgec, Duncan, Elfner, Kang, Kochetov, O’Neill, Ozburn, Rice, Sanders, Schertz, Shaftoe and Sullivan2021). Furthermore, non-initial /e/ occurs only in unassimilated loans and does not alternate for backness. Hahn (Reference Hahn1991) lists a number of allophones of /i/ and /e/ that depend on flanking consonantal context. However, McCollum (Reference McCollum2019a,Reference McCollum, Hout, Mai, McCollum, Rose and Zaslanskyb) finds that non-initial /i/, in addition to varying by consonantal context, varies allophonically based on preceding vowel backness.
Although the mid rounded vowels /ø o/ regularly trigger backness alternations, they do not occur in non-initial syllables in the native and nativised vocabulary (cf. Abdurehim Reference Abdurehim2014 for the Lopnor dialect). This phonotactic ban on non-initial /ø o/, in conjunction with the neutrality of /e i/, limits harmony to only two consistent alternations, [æ]˜[ɑ] and [y]˜[u]. The more productive alternation is [æ]˜[ɑ], which occurs in a wide range of suffixes. The alternation between [y] and [u] is far more limited, occurring in the gerundial suffix /-GU/ and in suffixes that undergo rounding harmony, such as the deadjectival nominalizing suffix /-lIK/.
2.2.3. McCollum (Reference McCollum2019a,Reference McCollum, Hout, Mai, McCollum, Rose and Zaslanskyb)
McCollum (Reference McCollum2019a,Reference McCollum, Hout, Mai, McCollum, Rose and Zaslanskyb) reports production data from a picture-naming task conducted with nine native Uyghur speakers residing in Chunja, Kazakhstan. In this task, McCollum elicited bare nouns as well as possessive, plural and overtly case-marked nouns, yielding words from one to five syllables in length. Some example forms are shown in (5). A few things are worth briefly noting from these examples. First, low vowels raise to [i] in medial open syllables, as in (5e)–(5g) and (5n) (Nadzhip Reference Nadzhip1971; Hahn Reference Hahn1991; Engesæth et al. Reference Engesæth, Yakup and Dwyer2009; Mayer et al. Reference Mayer, McCollum and Eziz2022). Second, note in (5k) that /æ/ raises to [e] before the epenthetic [i] of the first-person singular possessive suffix. This pattern, often called umlaut, affects the low back vowel as well, as in /bɑl-m/ [belim] ‘honey-poss.1sg’ and occurs in a variety of other contexts. These two processes are common in the language, though they are not the focus of McCollum’s analysis or ours. More importantly, the data in (5) illustrate the general type of data elicited in McCollum (Reference McCollum2019a,Reference McCollum, Hout, Mai, McCollum, Rose and Zaslanskyb).

Recall that McCollum (Reference McCollum2019a,Reference McCollum, Hout, Mai, McCollum, Rose and Zaslanskyb) reports that front vowels retain their frontness, while back vowels are incrementally fronted in non-initial syllables. Specifically, he analyses z-score normalised F2 (Lobanov Reference Lobanov1971) of target vowels with a mixed-effects linear regression, predicting F2 based on initial-syllable backness, target vowel height, syllable number, root type (mono- or disyllabic), preceding consonant place of articulation (bilabial, coronal or dorsal) and following consonant place of articulation. McCollum’s model also includes two-way interactions between preceding consonant place and vowel height, following consonant place and vowel height, initial backness and vowel height, initial backness and syllable number, initial backness and root type, and syllable number and root type. His model also incorporates a three-way interaction for initial vowel backness, syllable number and root type. In terms of random effect structure, his model includes random intercepts for speaker and target vowel, as well as by-syllable random slopes for speaker and target vowel.
Though McCollum’s word list does not strictly control for flanking consonant place, he attempts to account for potential coarticulatory effects of preceding and following consonants in his statistical model. He further attempts to account for any possible differences in coarticulation based on vowel height by incorporating two-way interactions between preceding and following consonants and vowel height. McCollum’s goal was to rule out many potential confounds from the elicited data to increase the relative certainty that any positional effects discovered are not due to some other factor, but are the direct result of the harmony system.
McCollum (Reference McCollum2019a,Reference McCollum, Hout, Mai, McCollum, Rose and Zaslanskyb) discusses four possible accounts of the elicited data. The first possible account involves categorical harmony with no phonetic reduction. In essence, categorical harmony should output derived [±back] vowels that are indistinguishable from their underlying, non-derived counterparts (see, e.g., Zsiga Reference Zsiga1997: 235). This prediction is easily falsified, as non-initial back vowels exhibit significantly higher F2 than their initial-syllable counterparts.
The second analysis McCollum entertains involves categorical phonological harmony with phonetic centralisation. In this account, as in the first, phonological harmony operates categorically. However, phonetic reduction of non-initial syllables results in symmetric centralisation (Nord Reference Nord1986; Vayra & Fowler Reference Vayra and Fowler1992; Krakow et al. Reference Krakow, Bell-Berti, Emily Wang, Bell-Berti and Raphael1995; Herman et al. Reference Herman, Beckman, Honda, Bunnell and Idsardi1996; Johnson & Martin Reference Johnson and Martin2001). Crucially, the sort of incremental reduction in non-initial syllables reported in previous work (e.g., Vayra & Fowler Reference Vayra and Fowler1992) is inconsistent with the asymmetric Uyghur pattern, where front vowels do not exhibit systematic positional shifts in F2 comparable to their back vowel counterparts.
Third, McCollum considers the possibility that harmony is just phonetic interpolation and not phonological at all. This could produce the asymmetric shift observed, given his assumption that [−back] is default and [+back] is active (see Mayer Reference Mayer2021 for an analysis with [+back] as default). He marshals two types of evidence to support the activity of [+back]. First, suffixal high vowels that participate in harmony in non-final position default to  , a [−back] vowel, when the same suffixes occur in absolute word-final position, where harmony is blocked. For instance, in non-final position, the high vowels allophonically alternate for harmony, as seen in the third-person possessive suffix: for example,
 in
 ‘steppe-poss.3-loc’ but
 in
 ‘under-poss.3-loc’. Yet, when this same suffix occurs word-finally, the high vowel surfaces as
 irrespective of the backness of the preceding vowel:
 ‘steppe-poss.3’ and
 ‘under-poss.3’. Second, McCollum (Reference McCollum2019a: 146–148) describes historical patterns of loanword adaptation in Uyghur whereby borrowings with back vowels in the source language may be fronted in Uyghur (e.g., Arabic
 ‘life’, Uyghur
 ). However, front vowels in the source language are always borrowed with front vowels.
Since McCollum elicited his data in isolation, it is possible that there is a [−back] default articulatory setting at the right edge of each word. This would be relatively consistent with articulatory studies finding default articulatory settings that resemble the lingual position of the unmarked feature value (Hudu Reference Hudu2010; Allen et al. Reference Allen, Pulleyblank and Ajíbóyè2013). Thus, the phonetic interpolation account would derive the incremental fronting of back vowels through gradual shifting of all vowels not phonologically specified for backness (i.e., non-initial vowels) towards the default articulatory setting, which is fully attained at the right edge of the word.
This account is, however, inconsistent with the relevant facts of Uyghur phonology. Harmony must be phonological because it is exceptionful and also interacts with a structure-preserving consonantal alternation. Back vowels regularly co-occur with uvular consonants, while front vowels co-occur with velar consonants, as evidenced by the dative and gerundial suffixes in (3) and (4). Critically, there is no voiced uvular stop in the Uyghur inventory, so /g/ alternates with /ʁ/. This difference in both place and manner of articulation supports the necessity of backness harmony in the lexical phonology in the language, as opposed to being a postlexical process.
Given the failure of these accounts, McCollum contends that harmony must be both phonological and gradient. If harmony is phonological and [+back] is active, then the gradience reported is derivable from iterative incomplete neutralisation – each syllable incompletely assimilates to the backness of the previous syllable. To model this, McCollum (Reference McCollum2019a: ch. 6) develops a Harmonic Grammar (Legendre et al. Reference Legendre, Miyata and Smolensky1990) analysis utilizing a gradient Agree-like constraint that penalizes subphonemic differences in vowel backness (see Braver Reference Braver2013 for a similar constraint), showing that this analysis fits the data better than a traditional analysis without access to continuous phonological representations.
In the following two sections, we pursue two alternatives to McCollum’s gradient phonological account. We conduct two experiments to revisit two of the phonetic alternative accounts considered and rejected by McCollum (Reference McCollum2019a,Reference McCollum, Hout, Mai, McCollum, Rose and Zaslanskyb). Experiment 1 tests the possibility that phrasal interpolation explains gradient fronting. Experiment 2 tests the possibility that non-initial phonetic reduction, along with local consonant–vowel coarticulation, can explain the pattern found in McCollum’s work. We lay out the mechanics and predictions of each account. We then test those against production data elicited with Uyghur speakers in the same location where McCollum elicited his data, Chunja, Kazakhstan.
3. Experiment 1: interpolation
In this section, we focus on McCollum’s (Reference McCollum2019a, Reference McCollum, Hout, Mai, McCollum, Rose and Zaslansky2019b) choice to elicit words in isolation and its potential influence on the interpretation of his results. McCollum rules out the possibility that gradient fronting in non-initial syllables could be derived from phonetics alone by noting that backness harmony interacts with a structure-preserving consonantal backness alternation. However, it is possible that harmony is phonological while gradient fronting emerges from the phonetic module of the grammar. Specifically, if the phonology–phonetics interface does not convert phonological features into explicit targets but rather to windows within which phonetics may interpolate (Keating Reference Keating1988, Reference Keating, Kingston and Beckman1990), then it is possible to derive the fronting pattern in McCollum’s data.
If phonetics operates over these windows, then gradient interpolation may occur between left and right word edges. At the left edge of the word, the initial syllable is specified for [±back]. The backness of initial-syllable vowels is not phonologically predictable, in contrast to the backness of all other positions (for much of the native and nativised vocabulary, anyway). McCollum (Reference McCollum2020) shows that in the related language Kyrgyz this difference in predictability results in hyperarticulation of the initial syllable, or alternatively hypoarticulation of non-initial syllables. If the initial syllable is the only position with unpredictable backness, and this results in increased articulatory precision, then it is reasonable to suppose that initial-syllable vowels are produced with clear phonetic targets.
In addition, if the right edge of the word in McCollum’s data is marked by a very anterior lingual position, then gradient fronting may be derivable from interpolation between the two. Hudu (Reference Hudu2010) and Allen et al. (Reference Allen, Pulleyblank and Ajíbóyè2013) find evidence that the default articulatory settings for languages with tongue root harmony may correspond to the lingual posture of the unmarked feature value. In McCollum’s analysis, [−back] is unmarked, predicting a fronted tongue body when at rest. Since words were collected in isolation, every word could have involved a transition towards this [−back] default articulatory setting. This is schematised in Figure 1. In back vowel words like  ‘instrument-pl-loc’, this would result in a shift from lower to higher F2, exactly what McCollum reports. In contrast, the existence of two [−back] targets at each word edge would likely mitigate centralisation in front vowel words, like
 ‘crack-pl-loc’, resulting in relatively constant F2 values throughout the word.
F2 patterns for words uttered in isolation according to an interpolation-based account of gradient backness harmony in Uyghur.

Figure 1 Long description
The diagram consists of two side-by-side panels under the row label Before a pause. Both panels share a vertical axis on the left with a double-headed arrow indicating Front at the top and Back at the bottom, representing F 2 frequency levels.
* The left panel is titled plus-back target word. It shows the phonetic transcription [ saz - lar - da ] followed by a closing bracket and a subscript iota. Below the text, four horizontal tiers represent syllable positions. A dashed line starts at a solid black dot in the lowest tier for the first syllable, remains low for the second and third syllables, and then curves upward to a solid black dot in the highest tier for the final syllable.
* The right panel is titled minus-back target word. It shows the phonetic transcription [ dæz - lær - dæ ] followed by a closing bracket and a subscript iota. Below the text, four horizontal tiers are shown. A dashed line connects a solid black dot in the highest tier of the first syllable horizontally across to a solid black dot in the highest tier of the final syllable, indicating a consistent front vowel position throughout.
Note that although the interpolation is visually represented with a curve in Figures 1 and 2, Keating (Reference Keating, Kingston and Beckman1990: 457) does not spell out any particular type of function that would best describe this interpolation. She writes, ‘I will offer no explicit procedure for constructive paths through windows, e.g., what functions are possible, whether construction proceeds directionally, how large a span is dealt with at a time. I also leave aside the question of how timing fits into the scheme.’ We use curves in our diagrams to heighten the visual distinction between shifting and non-shifting F2 trajectories. However, in our statistical modelling we use linear functions, because they are simpler and because Keating does not explicitly spell out what sort of functions are actually necessary for her model.
Predicted F2 patterns according to phrasal context if gradience is derivable via phonetic interpolation.

Figure 2 Long description
The diagram is organized into a two-by-two grid. The columns are labeled plus back target word and minus back target word. The rows are labeled Before minus back and Before plus back. Each quadrant contains a phonetic transcription, a vertical axis indicating Front at the top and Back at the bottom, and a dashed line representing the F 2 trajectory.
* Top-Left Quadrant: Under plus back target word and Before minus back, the transcription is [ saz - lar - da ] omega sub minus back. The dashed line starts at a low point in the back position and curves upward toward the front position at the end of the word.
* Top-Right Quadrant: Under minus back target word and Before minus back, the transcription is [ dæz - lær - dæ ] omega sub minus back. The dashed line is a flat horizontal line staying in the front position.
* Bottom-Left Quadrant: Under plus back target word and Before plus back, the transcription is [ saz - lar - da ] omega sub plus back. The dashed line is a flat horizontal line staying in the back position.
* Bottom-Right Quadrant: Under minus back target word and Before plus back, the transcription is [ dæz - lær - dæ ] omega sub plus back. The dashed line starts at a high point in the front position and curves downward toward the back position at the end of the word.
The account schematised in Figure 1 is distinct from McCollum’s because it invokes the phonological grammar to insert the windows present in all non-initial syllables. McCollum’s discussion of interpolation assumes no non-initial windows, only an initial vowel target and a potential phrase-final default articulatory setting. While the interpolation-only account is, as McCollum (Reference McCollum2019a,Reference McCollum, Hout, Mai, McCollum, Rose and Zaslanskyb) argues, ruled out by the presence of exceptions and structure-preserving alternations that depend on harmony, the account sketched above provides a plausible reinterpretation of his findings.
This alternative account predicts that the F2 trajectories within a given word, be it back or front, should depend on phrasal context, as shown in Figure 2. Specifically, back-vowel words that are followed by another back-vowel word should not, under this analysis, exhibit systematic fronting, precisely because there is no following [−back] lingual specification. Relatedly, the F2 of vowels in front-vowel words should decrease in non-initial syllables if the following word is [+back], because of the introduction of a [+back] specification following the target word. We can assess these predictions by evaluating the interaction of position and phrasal context for each alternating vowel. If phrasal context predicts positional changes in F2 in a manner consistent with Figure 2, this would support the proposed phrasal interpolation account of the pattern. If, however, formant trajectories are parallel across phrasal contexts, this would critically undermine the phrasal interpolation account.
3.1. Methods
3.1.1. Participants
We recruited 16 (eight male and eight female) native speakers of Uyghur in Chunja, Kazakhstan. Participants were between 19 and 63 years of age (mean 47.1 years). All participants were born and reside in or near Chunja. Further, all speakers reported native fluency in Uyghur. Uyghurs in Kazakhstan, by necessity, are generally trilingual, speaking Uyghur, Kazakh and Russian. We chose to elicit data from speakers in Chunja because it is the seat of the Uyghur Autonomous County and Uyghur is widely spoken there, reducing the risk of recruiting speakers with limited proficiency in the language. No studies have examined the potential dialect differences between Uyghurs in Kazakhstan and those in Xinjiang or the potential effect of Kazakh and/or Russian on their phonological grammar. This, to some degree, limits comparisons with Uyghur data collected in Xinjiang. That being said, much recent work has collected data from speakers in Kazakhstan, allowing for some straightforward comparisons (McCollum Reference McCollum2019a,Reference McCollum, Hout, Mai, McCollum, Rose and Zaslanskyb; Mayer Reference Mayer2021; Mayer et al. Reference Mayer, Major, Yakup, Jurgec, Duncan, Elfner, Kang, Kochetov, O’Neill, Ozburn, Rice, Sanders, Schertz, Shaftoe and Sullivan2021).
3.1.2. Stimuli
We generated 60 short Uyghur sentences. Forty sentences contained target items, which were di- and trisyllabic words composed entirely of harmonic low vowels, either  or
 . Target items included 16 disyllabic and 24 trisyllabic words. Disyllabic words consisted of a root and either the plural suffix
 or the locative suffix
 . Trisyllabic forms were formed by concatenating these two suffixes. Roots were all CVC; all consonants were coronal or bilabial. No dorsal consonants were used, because of their participation in the harmony pattern.
All target items were the second word of the sentence and were preceded by the proximal demonstrative  . Target words were followed by a bilabial or coronal consonant-initial word. Two sample sentences are shown in 6.

3.1.3. Procedure
Each participant was recorded in a quiet room by the first author. Participants wore a Shure SM-10A head-mounted microphone. All sound files were recorded to a laptop using Praat and a Sound Devices USBPre2 audio interface. After informed consent, participants were presented with sentences and instructed to read each sentence at a natural rate of speech. Each sentence was presented in three different scripts, Perso-Arabic, Cyrillic and Latin. Since Uyghur has been represented with all three scripts, we wanted to ensure all participants could easily read the prompts. Sentence lists were randomised with the stipulation that the first five sentences for each participant were fillers. The study took approximately 15 to 20 minutes to complete; participants were given three brief breaks during the study.
3.1.4. Measurements
The recordings were annotated in two stages using Praat (Boersma & Weenink Reference Boersma and Weenink2021). In the first stage, the first two authors transcribed the test sentences using ARPAbet. These transcriptions, along with recorded audio, were fed to the Montreal Forced Aligner (McAuliffe et al. Reference McAuliffe, Socolof, Mihuc, Wagner and Sonderegger2017), which created an initial segmentation of target sentences. The first two authors then manually adjusted the segmentations generated by the forced aligner. Specifically, each of the first two authors manually corrected half of each speaker’s data, discussing and comparing these adjustments to minimise by-annotator variation. The annotation consisted of a top tier for the test item, a middle tier for the expected surface representation and a bottom tier to mark the quality of the word pronunciation (bad, excrescent/epenthetic segment, unclear), with the absence of an annotation indicating good word tokens that were analysed further. A sample annotation is provided in Figure 3.
A sample annotation in Praat. The top tier marks the test item, the middle tier marks the expected surface representation using ARPAbet, and the bottom tier marks the quality of the pronunciation.

Figure 3 Long description
The display is divided into three main vertical sections.
At the top is a waveform showing amplitude over time, featuring three distinct clusters of high-frequency oscillations.
In the middle is a spectrogram with a Y axis labeled Frequency in Hertz from 0 to 5000. It shows dark horizontal bands representing formants, with a significant gap in energy between the second and third clusters.
At the bottom is a three-tiered annotation grid with an X axis labeled Time in seconds, ranging from 1.021 to 1.936.
* The top tier contains a single label: bellerde.
* The middle tier contains A R P A bet phonetic segments: B, E H 1, L, E H 1, R, D, and E H 1.
* The bottom tier is a blank quality marking tier.
The segments in the middle tier align vertically with the acoustic features in the spectrogram and waveform above them.
Since we were interested in observing the potential effect of phrasal context on the fronting and backing of vowels through the span of a harmonic word, we extracted F2 measurements for each vowel ( ) in target words using Praat scripts. We planned to code context as front/back, depending on the backness of the first syllable of the following word. However, during data collection many tokens were produced with pauses between the target items and the following context. Rather than throwing these tokens out, we decided to introduce a third context, pause, into our statistical modelling.
Separating pre-pausal items from fluent productions not only allowed us to preserve more of the elicited data, but also allows for a more direct comparison with McCollum’s (Reference McCollum2019a; Reference McCollum, Hout, Mai, McCollum, Rose and Zaslansky2019b) data, which was elicited in isolation. McCollum suggests that pre-pausal tokens may behave like items before front-vowel words; this allows us to examine that claim.
Finally, we collected F2 measurements both at the midpoint of each test vowel and at 5% intervals of each vowel. Midpoint measurements allowed us to investigate how F2 values varied generally from vowel to vowel. The more granular measurements allowed us to inspect the degree of target interpolation within each syllable.
3.2. Results
3.2.1. Midpoint analysis of F2 measurements
All our statistical analysis and plotting were done in the programming language R (R Core Team 2022), using the IDE Rstudio (RStudio Team 2020). The data were analysed and visualised using the tidyverse suite of packages (Wickham et al. Reference Wickham, Averick, Bryan, Chang, McGowan, François, Grolemund, Hayes, Henry, Hester, Kuhn, Pedersen, Miller, Bache, Müller, Ooms, Robinson, Seidel, Spinu, Takahashi, Vaughan, Wilke, Woo and Yutani2019), and statistical modelling was done with the packages lme4 (Bates et al. Reference Bates, Mächler, Bolker and Walker2015) and lmerTest (Kuznetsova et al. Reference Kuznetsova, Brockhoff and Christensen2017). Throughout, we assume linear relationships between the factors manipulated in the experiments.Footnote 3
Overall, there were 4,361 good vowel tokens for the test vowels, constituting 96.3% of the data. Out of this, 1,507 vowels (34.6%) were in words followed by back vowels in the next word; 1,820 vowels (41.7%) were in words followed by front vowels in the next word; and 1,034 (23.7%) of the words were followed by pauses. Figure 4 shows the means and standard errors for each surface vowel in each position of di- and trisyllabic words conditioned by the backness context of the first vowel in the next word.
Mean F2 values at vowel midpoint for  by syllable number and phrasal context. Error bars represent standard errors.

Figure 4 Long description
The x-axis is labeled Syllable with values 1, 2, and 3. The y-axis is labeled F 2 (H z) with values ranging from 1400 to 1800. A legend on the right identifies two vowel types: ash (black lines) and script a (gray lines). A second legend identifies phrasal contexts: Back (dotted line with circles), Front (solid line with triangles), and Silence (dashed line with squares).
For the ash vowel (black lines), F 2 values are high, starting between 1750 and 1900 H z at syllable 1, dipping at syllable 2, and slightly recovering at syllable 3. The Silence context shows the highest initial value, while the Back context remains the lowest throughout.
For the script a vowel (gray lines), F 2 values are lower, clustered between 1380 and 1450 H z for syllables 1 and 2. At syllable 3, there is a sharp increase for all contexts, with Front and Silence reaching approximately 1550 H z and Back reaching approximately 1480 H z. Error bars are present at every data point.
As can be seen in Figure 4, the fronting of  observed in McCollum (Reference McCollum2019a,Reference McCollum, Hout, Mai, McCollum, Rose and Zaslanskyb) is replicated, as reflected in the increasing F2 values. However, F2 of
 decreases in second syllables. This variation appears to exceed the smaller-scale variation reported in McCollum’s data.
There appears to be an effect of phrasal position on vowel F2. Crucially, however, the potential effect of the following context applies throughout the test word, and to both vowels. Note also that prepausal target words, both front and back, exhibited the same qualitative F2 trajectories as target words before [−back] words.
We followed up on visual inspection of plots with mixed-effects modelling in R using the packages lme4 and lmerTest. The dependent variable was F2 of each vowel at midpoint. We included three independent variables and their interaction in the full model under consideration; these were Vowel ( or
 ), Context (back, front, pause), and the continuous variable Position, which was centred. Other predictor variables were treatment/dummy coded. The vowel
 and front-vowel phrasal context served as reference levels for Vowel and Context, respectively. The random effects structure included by-subject and by-item random slopes for Vowel and Position, and by-subject and by-item random intercepts. The results are summarised in Table 2.
Summary of full model output.

Table 2 Long description
The table contains five columns: Fixed effect, Estimate, d f, t-value, and p (absolute t).
* Intercept: Estimate 1,744, d f 25.5, t-value 43.8, p less than 0.0001.
* Position: Estimate minus 37.7, d f 46.1, t-value minus 1.5, p 0.14.
* Context (Pause): Estimate 36.7, d f 3,231.2, t-value 3.0, p 0.003.
* Context (Back): Estimate minus 22.2, d f 1,110.8, t-value minus 1.5, p 0.14.
* Vowel (ɑ): Estimate minus 280.9, d f 36.5, t-value minus 8.5, p less than 0.0001.
* Position:Context (Pause): Estimate 35.5, d f 1,507.7, t-value 2.4, p 0.02.
* Position:Context (Back): Estimate 7.0, d f 409.0, t-value 0.4, p 0.71.
* Position:Vowel (ɑ): Estimate 123.5, d f 43.6, t-value 3.7, p 0.0006.
* Context (Pause):Vowel (ɑ): Estimate minus 54.4, d f 3,921.3, t-value minus 3.3, p 0.001.
* Context (Back):Vowel (ɑ): Estimate minus 17.4, d f 1,638.7, t-value minus 0.9, p 0.39.
* Position:Context (Pause):Vowel (ɑ): Estimate minus 40.8, d f 2,803.9, t-value minus 2.1, p 0.04.
* Position:Context (Back):Vowel (ɑ): Estimate minus 21.5, d f 948.9, t-value minus 0.8, p 0.41.
In this model, there are two significant two-way interactions, Vowel × Position and Vowel × Context, as well as a significant three-way interaction, Vowel × Position × Context, indicating that the effects of position and context depend on the vowel. We found the interpretation of the regression coefficients in this relatively large model challenging, as is always the case in complex models. In addition, the methodological practice of including the largest justified random effects structure (Barr et al. Reference Barr, Levy, Scheepers and Tily2013), combined with the complexity of this model, results in a model that is potentially under-powered (Bates et al. Reference Bates, Kliegl, Vasishth and Baayen2018). When power is a potential issue, it is difficult to interpret the sign or magnitude of a significant effect. Further, in such cases it is also difficult to interpret any non-significant results (Gelman & Carlin Reference Gelman and Carlin2014). Additionally, we cannot know whether a study is truly under-powered without having a clear expectation of the effect size, which is not currently possible for our research program. Therefore, we think it is useful and important to check the crucial comparisons with models assessing subsets of the data to avoid the potential over-specification, and consequent under-powering, of the model.
In this case, we ran separate models for each vowel, which reduced the complexity of both the fixed and random effects structure by removing an effect (Vowel) as well as its inclusion in multiple interaction terms. Therefore, the random effects structure included by-subject and by-item random slopes for Position, and by-subject and by-item random intercepts. These subset models also allow us to check if the manifestation of harmony for each vowel has a slope that is different from zero – a crucial question for our research program.
The model for  is presented in Table 3. Observe that the only significant effect in this model is Context (pause). Crucially, there is no significant effect of Position (
$p=0.10$
 ) when Context is front, and no significant interactions involving Position and Context (
$p=0.10$
 for pause vs. front;
$p=0.92$
 for back vs. front). In other words, F2 of the front vowel
 does not change significantly by position, regardless of the following phrasal context.
Summary of model output for the [æ] model (baseline: front context).

Table 3 Long description
The table consists of five columns: Fixed effect, Estimate, d f, t-value, and p (absolute t).
* Intercept: Estimate 1,752.0, d f 22.7, t-value 47.8, p less than 0.0001.
* Position: Estimate minus 26.2, d f 17.8, t-value minus 1.7, p 0.10.
* Context (Pause): Estimate 31.5, d f 1,414.6, t-value 2.14, p 0.03.
* Context (Back): Estimate minus 29.4, d f 321.8, t-value minus 1.7, p 0.09.
* Position:Context (Pause): Estimate 27.4, d f 347.2, t-value 1.6, p 0.10.
* Position:Context (Back): Estimate minus 1.9, d f 65.8, t-value minus 0.1, p 0.92.
The model for  is presented in Table 4. Consistent with visual inspection, there is a clear effect of Position: F2 values increase over the course of the word. The vowel
 in all positions of the word is influenced by following context. The effect of phrasal context deserves further scrutiny in subsequent work. The key finding from Table 4 is that the realisation of F2 of
 does not depend on any interaction of Position and Context (
$p=0.91$
 for pause vs. front;
$p=0.17$
 for back vs. front). In other words, the positional variation for the back vowel does not significantly depend on phrasal context.
Summary of model output for the [ɑ] model (baseline: front context).

Table 4 Long description
The table consists of five columns: Fixed effect, Estimate, d f, t-value, and p (absolute t).
* Intercept: Estimate 1,465.9, d f 22.8, t-value 41.3, p less than 0.0001.
* Position: Estimate 90.3, d f 22.0, t-value 3.2, p 0.004.
* Context (Pause): Estimate minus 17.0, d f 2,319.6, t-value minus 2.2, p 0.03.
* Context (Back): Estimate minus 41.5, d f 1,653.9, t-value minus 4.3, p less than 0.0001.
* Position:Context (Pause): Estimate minus 1.1, d f 1,955.8, t-value minus 0.1, p 0.91.
* Position:Context (Back): Estimate minus 17.6, d f 1,953.4, t-value minus 1.4, p 0.17.
In sum, there is a clear increase in F2 for  in non-initial positions, but no comparable effect for
 . This replicates the findings of McCollum (Reference McCollum2019a,Reference McCollum, Hout, Mai, McCollum, Rose and Zaslanskyb). In addition, our results show no evidence supporting the case that the asymmetric fronting reported by McCollum is a by-product of phrasal phonetic interpolation, since the interactions between Position and Context were not significant. Therefore, our results fail to reject the null hypothesis in favour of the phonetic interpolation hypothesis.
Before moving on to examine F2 contours within each vowel, let us briefly revisit the choice to introduce pause as a third phrasal context. First, pause durations were typically substantial. Consider the data in Table 5. Both median and mean pause durations were relatively long. In fact, of the 1,039 words followed by pauses, only around ten exhibited pauses of less than 30 ms. Thus, the vast majority of pauses coded reflect substantial breaks in the flow of speech. Second, our choice to code pause as a third phrasal context more effectively described the data than using the intended phrasal context. A reviewer asks if the intended phrasal context could pass through the pause to exert an effect on the F2 values of target words. If pauses do not affect phrasal context, we would expect our tripartite coding scheme to adversely affect model fit. In short, the regression model would more poorly fit the data because of the introduction of a spurious level within the fixed effect of Context, obscuring the true phrasal context. To evaluate this possibility, we compared the fit of a model incorporating pause against a model with only two levels of context, back and front, based on the constructed stimuli. The best model was identified by the Akaike information criterion (AIC; Akaike Reference Akaike1974). AIC is a dimensionless unit that measures model fit while adjusting for model complexity, where a lower AIC value represents a better model. An AIC differential of 8 or more is considered a very large difference in model fit (Burnham & Anderson Reference Burnham and Anderson2004; Burnham et al. Reference Burnham, Anderson and Huyvaert2011). The model with pause fitted the data significantly better than the model with only the intended following context (front/back), with a difference in AIC of 14.8.
Median and mean pause duration (ms).

Table 5 Long description
The table consists of four columns and two data rows. The columns are labeled Vowel, Median pause duration, Mean pause duration, and Pause duration S D.
* The first row corresponds to the vowel ash. It has a median pause duration of 210, a mean pause duration of 294, and a pause duration S D of 410.
* The second row corresponds to the vowel script a. It has a median pause duration of 199, a mean pause duration of 248, and a pause duration S D of 220.
3.2.2. F2 contours
In this subsection, we show visualisations of the contours for the vowels. While we did not perform any statistical testing of the patterns, since we didn’t have any explicit hypotheses about contours to test, we considered it helpful to the reader to include the visualisations to assess the viability of the phonetic interpolation hypothesis.
The plot in Figure 5 suggests that any interpolation is limited to the final vowel. Though the contours exhibit no obvious differences by context in syllables one and two, the formant trajectories bifurcate during the last half of the final vowel. Before [+back] words, both front and back vowels exhibit decreasing F2 during the final half of the word-final vowel. Likewise, before pauses and [−back] words, F2 of both  and
 increases throughout the final vowel. In sum, the only evidence for phrasal interpolation in Experiment 1 is seen during the final half of the word-final vowel. Third-syllable vowels were always word-final, since they were always elicited in the locative suffix
 , making them even more susceptible to local coarticulation with the following word or phrase boundary. All in all, we interpret these results as evidence against an interpolation-based account of gradient harmony in Uyghur.
Mean F2 contours for  and
 based on syllable number and phrasal context. Error bars represent standard errors.

Figure 5 Long description
A multi-panel line graph with three horizontal panels labeled Syllable 1, Syllable 2, and Syllable 3. The Y-axis represents F 2 in Hertz (H z) ranging from 1400 to 1800. The X-axis represents steps within each vowel and syllable from 0 to 100.
Data is divided into two distinct vertical clusters based on Vowel type. The top cluster (black lines) represents the vowel ash. The bottom cluster (light gray lines) represents the vowel script a. Within each cluster, three line styles represent Phrasal context: dotted for Back, solid with triangles for Front, and dashed with squares for Silence.
* Syllable 1: The ash cluster remains stable between 1700 and 1800 H z with a slight mid-vowel peak. The script a cluster is stable between 1400 and 1500 H z.
* Syllable 2: The ash cluster shows a slight downward trend toward the end of the syllable. The script a cluster shows a gradual linear increase from 1350 to 1450 H z.
* Syllable 3: The ash cluster shows the greatest divergence. The Front and Silence contexts remain high near 1800 H z, while the Back context drops sharply toward 1600 H z. The script a cluster shows a similar divergence where the Back context drops below 1400 H z while Front and Silence contexts rise toward 1600 H z.
Vertical error bars are present at each data point across all panels.
4. Experiment 2: centralisation, coarticulation and morphotactics
Since results from Experiment 1 indicate that the gradience in Uyghur is not a by-product of phrasal interpolation, we conducted a second experiment to investigate another potential explanation, centralisation. Specifically, this second alternative derives the asymmetric fronting pattern from the interaction of symmetrical centralisation and low-level phonetic coarticulatory effects mediated by the morphotactics of the language. Previous work has found patterns of articulatory declension in a range of languages (Vayra & Fowler Reference Vayra and Fowler1992; Krakow et al. Reference Krakow, Bell-Berti, Emily Wang, Bell-Berti and Raphael1995; Tabain Reference Tabain2003). In these cases, vowels produced later in an utterance are increasingly hypoarticulated, yielding increased centralisation. If non-initial vowel quality is predictable based on incremental phonetic centralisation, we might expect incremental reduction of the acoustic distinctions of [±back] vowels, as schematised in Figure 6.
Predicted F2 of non-initial  and
 under a centralisation account.

Figure 6 Long description
The y-axis is labeled F 2 (H z) and the x-axis is labeled Syllable with tick marks for 2, 3, and 4. A legend to the right identifies black circles as the ash vowel and gray circles as the script a vowel.
* At Syllable 2, the ash vowel has a high F 2 value while the script a vowel has a significantly lower F 2 value.
* At Syllable 3, the ash vowel F 2 decreases slightly, while the script a vowel F 2 increases slightly, narrowing the gap between them.
* At Syllable 4, the ash vowel F 2 continues to decrease and the script a vowel F 2 continues to increase, showing the closest proximity between the two data points.
Each data point includes vertical error bars indicating the range of prediction. The overall trend shows the two vowels converging toward a central F 2 frequency as the syllable number increases.
It is clear from McCollum (Reference McCollum2019a,Reference McCollum, Hout, Mai, McCollum, Rose and Zaslanskyb) that the positional differences in F2 are not symmetrical, which is why he rules out a centralisation account. However, McCollum assumes that the local coarticulatory effects from flanking consonants are sufficiently adjusted for in his model. He incorporated fixed effects of preceding and following consonant place of articulation to reduce the possibility of local consonant–vowel interactions clouding the interpretation of the data. He coded three levels of each contextual variable: bilabial, coronal and dorsal. He also coded the lateral as coronal in front-vowel contexts but dorsal in back-vowel contexts, since the lateral alternates for backness (McCollum Reference McCollum2021).
Choosing to use only three levels of this predictor assumes that contextual effects within a natural class defined by some place feature should be comparable. However, Hahn (Reference Hahn1986, Reference Hahn1991) reports extensive variation in vowel production conditioned by flanking consonants with the same phonological place of articulation. For instance, Hahn (Reference Hahn1991: 36–37) notes that  is produced as
 after labiodental fricatives, as in

 ‘film’ (from Russian). However, he reports that
 is produced as
 preceding the lateral in

 ‘wrist’, without any lowering due to the preceding bilabial stop. As another example,
 is produced as a front vowel before velar obstruents, as in

 ‘blue’, but is central before the velar nasal, as in

 ‘heart-poss.1sg’. Coarticulatory differences within a given featural natural class are reported in a variety of other languages (Recasens Reference Recasens1984a,Reference Recasensb, Reference Recasens1985, Reference Recasens1989; Recasens et al. Reference Recasens, Farnetani, Fontdevila and Pallarès1993; Fowler & Brancazio Reference Fowler and Brancazio2000). Thus, Hahn’s reports are not surprising, and a more controlled study to evaluate the potential confounding effect of flanking consonants is necessary.
Further, we can only assume centralisation will result in symmetrical reduction on the surface if local consonantal coarticulatory effects are negligible. However, if there exist significant differences in vowel quality conditioned by flanking consonants in the language, and if the distribution of consonants that occur in target syllables is skewed to obscure the positional effects, then these local differences could affect the positional trends observed in the aggregate. In addition to the symmetrical predictions in Figure 6, asymmetric shifts become plausible once these interactions are taken into account.
Consider the following scenario. Vowel F2 in syllables 2–4 is measured. Further, all elicited data come from two suffixes, Suffixx and Suffixy. Suffixx occurs in syllables 2 and 3, while Suffixy occurs in syllables 3 and 4, as in Figure 7a. In addition, F2 of both  and
 is markedly higher in Suffixy than in Suffixy. Observe that both suffixes exhibit symmetrical centralisation in Figure 7a. F2 of
 in Suffixx shifts towards more intermediate values in syllable 3, and F2 of
 in Suffixy shifts towards more intermediate values in syllable 4. Crucially, centralisation is masked in the aggregate data, as shown in Figure 7b. The higher F2 of Suffixy obscures the backing of [æ] while simultaneously exaggerating the fronting of [ɑ]. Centralisation is evident only once morphemic/segmental context is controlled.
Asymmetric fronting as a by-product of centralisation, coarticulation and morphotactics. Panel (a) shows by-syllable plots for each suffix. Panel (b) shows data in the aggregate.

Figure 7 Long description
The figure consists of two main panels. A legend on the far right identifies black dots as the vowel ash and grey dots as the vowel script a, both with vertical error bars.
Panel a contains two sub-plots.
- The first sub-plot, labeled Suffix sub X, shows Syllables 2 and 3 on the x-axis. For the vowel ash, F 2 decreases slightly from syllable 2 to 3. For the vowel script a, F 2 increases slightly from syllable 2 to 3.
- The second sub-plot, labeled Suffix sub Y, shows Syllables 3 and 4 on the x-axis. For the vowel ash, F 2 decreases from syllable 3 to 4. For the vowel script a, F 2 increases from syllable 3 to 4.
Panel b, labeled Aggregate, shows Syllables 2, 3, and 4 on the x-axis.
- The vowel ash maintains a relatively stable, high F 2 frequency across all three syllables.
- The vowel script a shows a linear increase in F 2 frequency as the syllable number increases from 2 to 4, narrowing the gap between the two vowel types in later syllables.
The scenario sketched above is one way that centralisation plus other forces in the language may yield an apparently asymmetric pattern by position. The reverse scenario, with incremental backing of  in later syllables, is just as easily derivable if the coarticulatory effects or morphemic distributions are reversed. In addition, it is eminently plausible for the particular coarticulatory effects across syllables to obliterate any positional generalisations. For this reason, centralisation is truly observable only once flanking segmental context is strictly controlled. To do this, we chose to analyse the realisation of the low vowels within a given morpheme across multiple positions. By keeping the morpheme constant in our analysis, we were able to isolate the phonetic effect of harmony from local coarticulatory effects. If harmony is truly gradient, then by-morpheme analysis should exhibit the same asymmetric fronting trend found in McCollum’s aggregated data.
4.1. Methods
4.1.1. Participants
We recruited 17 (seven male and ten female) native speakers of Uyghur in Chunja, Kazakhstan. One male participant’s data were excluded because of repeated disfluencies. Participants were between 19 and 63 years of age (mean 33.6 years). All participants were born and reside in or near Chunja.
4.1.2. Stimuli
Stimuli consisted of 76 words varying in length from two to five syllables. The word list contained 14 disyllabic, 23 trisyllabic, 20 quadrisyllabic and 19 pentasyllabic words. The only vowels present in target words were  and
 . In addition to the target items, the word list included a large number of filler items, which contained either a high vowel or a non-alternating suffix. Target stimuli included both nouns and verbs. Nominal roots were from one to three syllables in length. Verb roots were one or two syllables in length. Sample words from nominal and verbal stems are shown in (7) and (8).


4.1.3. Procedure
Each participant was recorded in a quiet room by the first author. Participants wore a Shure SM-10A head-mounted microphone. All sound files were recorded to a laptop using Praat and a Sound Devices USBPre2 audio interface. After informed consent, participants were presented with words in isolation and instructed to read each at a natural rate of speech. Each word was presented in the Cyrillic script only, because all participants in the first experiment indicated greater familiarity with Cyrillic. The word list was randomised; each speaker read through the list twice, each time with a different randomisation. Participants were given three brief breaks during the study. Most participants completed the study in less than 20 minutes.
4.1.4. Measurements
The measurements were largely the same as with the previous experiment – the recordings were annotated in Praat, and F2 measurements were extracted at the midpoint of each test vowel ( ) using Praat scripts. The annotation scheme was again roughly the same, but we used a slightly different set of categories for the words (bad, epenthetic/excrescent vowel, unclear, notes), where the absence of an annotation indicated a good word token; all others were excluded from analysis. We don’t include a sample annotation, given the similarity to the previous scheme.
Compared to the previous experiment, there were two differences in the data sets created from our recordings. First, each word was uttered in isolation without any knowledge of upcoming stimuli, removing any potential phrasal context. Given that Experiment 1 found no significant effect of phrasal context, we were instead interested in the effect of morphemic and segmental context in this experiment. Second, we did not measure F2 values at 5% intervals within each vowel, since F2 contours were not as relevant to the question at hand.
4.2. Results
4.2.1. Overall analysis of F2 measurements
In this section, we report results from all non-initial vowels regardless of morphemic and segmental context. By aggregating over all the data, we are able to compare our results to McCollum’s and to provide a baseline with which to compare the by-morpheme analysis in the next subsection. Overall, there were 2,371 good word tokens for the test vowels, constituting 99.2% of the data. These are shown in Figure 8.
Mean F2 values for the vowels  and
 in different positions of the word. Error bars represent standard errors.

Figure 8 Long description
The horizontal X axis is labeled Syllable with numerical markers from 1 to 5. The vertical Y axis is labeled F 2 (H z) with values ranging from 1400 to 1800. A legend to the right identifies two series.
* The ash vowel (æ) is represented by a black line with circular markers. It starts at approximately 1780 H z at syllable 1, rises slightly to 1810 H z at syllable 2, and remains relatively stable near 1820 H z through syllable 5.
* The script a vowel (ɑ) is represented by a grey line with circular markers. It starts significantly lower at approximately 1370 H z at syllable 1, increases steadily to 1470 H z at syllable 3, plateaus at syllable 4, and rises again to approximately 1510 H z at syllable 5.
Both series include vertical error bars at each data point indicating standard error.
We followed up on visual inspection with mixed-effects modelling as before. Again, the dependent variable was F2, with two fixed effects, Vowel ( or
 ) and the continuous predictor Position, which was centred. As in Experiment 1,
 was set as the reference level for Vowel. The random effects structure was the same as for the complex model in Experiment 1 – it included by-subject and by-item random slopes for Vowel and Position, and by-subject and by-item random intercepts. Finally, we removed the initial-syllable vowel from the statistical modelling to ensure that this general model is maximally comparable to the one in the next section that includes a predictor of morphemic and immediate segmental context.
Results shown in Table 6 are broadly similar to those of the previous experiment, replicating the major finding in McCollum (Reference McCollum2019a,Reference McCollum, Hout, Mai, McCollum, Rose and Zaslanskyb). Specifically, observe that there is a non-significant effect of Position with an unstandardised effect size very close to zero, indicating that F2 of  does not systematically vary by position. In contrast, there is a highly significant interaction between Position and Vowel, indicating that F2 of
 increases incrementally in non-initial syllables.
Summary of baseline model output.

Table 6 Long description
The table consists of five columns: Fixed effect, Estimate, d f, t-value, and p (absolute t).
* Intercept: Estimate 1,825.8, d f 18.8, t-value 39.6, p less than 0.0001.
* Position: Estimate 2.2, d f 43.1, t-value 0.3, p 0.80.
* Vowel (alpha): Estimate minus 423.2, d f 50.4, t-value minus 15.6, p less than 0.0001.
* Position by Vowel (alpha) interaction: Estimate 68.7, d f 44.5, t-value 5.8, p less than 0.0001.
Although we have replicated McCollum’s finding once again, our primary goal here is to investigate whether or not the immediate segmental and morphemic context is the source of the fronting pattern reported in previous work. In the next subsection, we augment our statistical model to account for consonantal and morphemic context.
4.2.2. Analysis of F2 measurements while adjusting for morphemes
For this analysis, we controlled for morpheme, allowing us to examine the realisation of each suffix in different positions while ruling out local coarticulatory effects. Therefore, as in the previous subsection, we excluded the root morpheme from analysis. The analysis included 2,312 word tokens of the morpheme /-DA/, 872 word tokens of /-lAr/, 288 word tokens of /-lA-ʃ/ and 940 tokens of /-KAn/.Footnote 4
Figure 9 shows the by-morpheme plots for the relation between F2 and Position. In contrast to the overall analysis, visual inspection suggests that there is no asymmetric fronting. Instead, there appears to be a relatively symmetric centring of both  and
 . The figure also includes a dashed line, which reflects the average F2 value for the central vowel
 ; we will return to this later in the section.
By-morpheme mean F2 values for [æ] and [ɑ] in different positions. The horizontal dashed line represents the mean F2 value for [ɨ] in our filler items. Error bars represent standard errors.

Figure 9 Long description
A multi-panel line graph with four vertical panels labeled l A f, K A n, l A r, and D A from left to right.
* Axes: The y-axis represents F 2 in H z, ranging from 1300 to 1900. The x-axis represents Syllable position, numbered 2, 3, 4, and 5.
* Reference Line: A horizontal dashed line at approximately 1500 H z represents the mean F 2 for the filler vowel [ɨ].
* Legend: Black lines with solid circles represent the vowel ash. Gray lines with solid circles represent the vowel script a.
* Data Trends:
- Panel l A f: Ash starts at 1850 H z at syllable 2 and drops to 1800 H z at syllable 3. Script a starts at 1350 H z and rises slightly at syllable 3.
- Panel K A n: Ash starts high at 1980 H z at syllable 2 and shows a linear decrease to 1900 H z by syllable 4. Script a remains relatively flat near 1400 H z.
- Panel l A r: Ash is stable between 1750 and 1730 H z across syllables 2 to 4. Script a is stable near 1400 H z.
- Panel D A: Ash starts at 1900 H z at syllable 2 and decreases to 1820 H z by syllable 5. Script a shows a slight upward trend from 1480 to 1510 H z, crossing the dashed reference line at syllable 4.
All data points include vertical error bars representing standard errors.
As before, after visual inspection we conducted mixed-effects modelling. The dependent variable was F2, with independent variables for Position and Vowel, as well as their interaction. In this model, the random effects structure was more elaborate, incorporating the fact that the vowels were produced in different morphemes; the random effects structure included by-subject, by-item and by-morpheme random slopes for Vowel and Position, along with by-subject, by-item and by-morpheme random intercepts. As before, Position was centred. Concerning the coding for morphemic context, we coded for each contrast-neutralising alternation. Thus,  and
 were coded separately, as were the voiced and voiceless allomorphs of the locative suffix
 (
 and
 were coded as ‘dA’, and
 and
 were coded as ‘tA’), while the allomorphs of the plural
 and verbaliser-reciprocal suffixes
 were coded the same.
The model output in Table 7 suggests a markedly different picture of positional vowel shifts. The significant effect of Position, −27.1 Hz, suggests incremental backing of  , a trend not apparent in Table 6. Additionally, the significant interaction of Position and Vowel, 35 Hz, suggests a slight fronting of 7.9 Hz per syllable for
 (−27.1 (Position) + 35.0 (Position:Vowel(ɑ)) = 7.9). Given the simpler model reported in Table 6 and the apparent asymmetric fronting in Figure 8, the question now is which model best describes the actual data. We compared model fit as before, using AIC. The more complex model, which controlled for morphemic and segmental context, exhibited significantly lower AIC than the simpler model, as seen in Table 8. In fact, the difference in AIC, 285, indicates that relative to the model incorporating morphemic and segmental context, the simpler model receives no support from the data.
Summary of by-morpheme model output.

Table 7 Long description
The table consists of five columns: Fixed effect, Estimate, d f, t-value, and p (absolute t).
* Row 1: Intercept has an Estimate of 1,848.0, d f of 14.6, t-value of 32.4, and p less than 0.0001.
* Row 2: Position has an Estimate of minus 27.1, d f of 11.7, t-value of minus 4.4, and p of 0.0008.
* Row 3: Vowel (alpha) has an Estimate of minus 405.9, d f of 4.5, t-value of minus 13.2, and p less than 0.0001.
* Row 4: Position and Vowel (alpha) interaction has an Estimate of 35.0, d f of 76.4, t-value of 6.0, and p less than 0.0001.
Comparison of the simpler and by-morpheme models.

Table 8 Long description
The table consists of three columns: S. No., Full model, and A I C.
* Row 1: S. No. 1. Full model: F sub 2 tilde Vowel plus Position plus Vowel or Position plus (Position dash Sub) plus (Position dash Item). A I C: 55,398.
* Row 2: S. No. 2. Full model: F sub 2 tilde Vowel plus Position plus Vowel or Position plus (Position dash Sub) plus (Position dash Item) plus (Position dash Morpheme). A I C: 55,113.
The second model, which includes the Morpheme variable, shows a lower A I C value compared to the first model.
As with Experiment 1, we looked at each vowel separately with the accordingly smaller random effects structure. Specifically, each smaller model included by-subject and by-item random slopes for Position, along with by-subject and by-item random intercepts. The model for [æ] is shown in Table 9. Consistent with visual inspection of Figure 9, there is a clear negative effect of Position on F2. Therefore, there is more evidence that the vowel  is progressively backed throughout the word.
Summary of by-morpheme model output for the  model.

Table 9 Long description
The table consists of five columns and two data rows.
Column headers from left to right are: Fixed effect, Estimate, d f, t-value, and p (absolute value of t).
Row 1:
- Fixed effect: Intercept
- Estimate: 1,910.3
- d f: 10.2
- t-value: 25.6
- p (absolute value of t): less than 0.0001
Row 2:
- Fixed effect: Position
- Estimate: minus 23.5
- d f: 10.6
- t-value: minus 3.2
- p (absolute value of t): 0.01
The model for  is shown in Table 10. In contrast to the
 model, there is a smaller but clearly positive effect of Position on F2 of
 . Therefore, there is evidence that the vowel is progressively fronted throughout the word, albeit to a smaller degree than the backing of
 seen in Table 9.
Summary of by-morpheme model output for the  model.

Table 10 Long description
The table consists of five columns and two data rows. The columns are labeled from left to right as Fixed effect, Estimate, d f, t-value, and p (greater than absolute t).
* The first data row, Intercept, has an Estimate of 1,400.5, d f of 14.1, t-value of 29.5, and a p-value less than 0.0001.
* The second data row, Position, has an Estimate of 11.8, d f of 14.1, t-value of 3.8, and a p-value of 0.002.
These visual and statistical modelling results suggest that there is no asymmetric fronting of  once we control for morphological and segmental context. To further probe this effect of morphology and segmental context, we compared each of the two vowel-specific models with the corresponding models that do not include the by-morpheme random intercept and random slope of Position. For
 , the AIC values of the simpler model and by-morpheme were 26,543 and 26,416, respectively. The difference between the two was rather large, 127, in favour of the model controlling for morphemic and segmental context. For
 , the AIC values of the simpler model and by-morpheme were 28,446 and 28,316, respectively. The AIC difference between the two models was once again rather large, approximately 130, again in favour of the model controlling for morphemic and segmental context. This again suggests that there is clear and strong evidence that morphological – and consequently segmental – contextual information is important for explaining the quality of the low vowels.
One last aspect of the results that we would like to mention is the difference in the estimated slopes of  and
 across positions. In both, the larger and the smaller models, the estimated slopes for the
 vowel, −27.6 and −23.5 Hz, are much steeper than the slopes for
 , 7.9 and 11.8 Hz. This is consistent with the first- and second-syllable vowels in Figure 4, which shows a steeper decline in F2 for second-syllable
 than for second-syllable
 . As can be seen in Figure 9, the F2 of the back vowel
 is much closer to the average F2 value of the central vowel
 (dashed line) than the front vowel
 . Similarly, McCollum’s (Reference McCollum2019a) data, which includes z-score transformed F2 values of all the vowels in his experiment, suggests that the front vowel
 is roughly twice the distance from the centre of the vowel space as the back vowel
 . Therefore, there is simply less distance (about half, in fact) for the back vowels to traverse to centralise than the front vowels. The smaller positional effects for
 may plausibly derive from this fact.
Overall, our results in this subsection suggest that once the effects of morphological and segmental information are adjusted for, there is no asymmetric fronting of  in non-initial syllables. Instead, what we see is more consistent with a symmetric centralisation account. Consequently, analysing the Uyghur pattern does not require the inclusion of gradient phonological representations. We discuss our interpretation of these results further in the next section.
5. Discussion
5.1. Backness harmony in Uyghur
Results from these two studies indicate that there is no gradience in Uyghur backness harmony. As a consequence, we conclude that the claims in McCollum (Reference McCollum2019a,Reference McCollum, Hout, Mai, McCollum, Rose and Zaslanskyb) are unsupported. Before discussing the larger implications of our findings, it is important to note some of the limitations of our study, particularly as they relate to McCollum (Reference McCollum2019a,Reference McCollum, Hout, Mai, McCollum, Rose and Zaslanskyb). First, we investigated the realisation of only one harmonic pairing,  –
 , while McCollum examined all harmonic pairings. Second, we investigated only a small number of suffixes, whereas McCollum elicited data from a larger set of suffixes. In both respects, the present study was more targeted than McCollum’s. While the more focussed nature of the present study to some degree limits the amount of extrapolation merited by our findings, on the other hand, the more controlled nature of our study also unveiled confounding forces not controlled for in McCollum’s study. Therefore, a fuller study of all harmonic pairings and a larger set of target morphemes would be extremely useful.
A key question that emerges from our study is why do aggregated results continually show what appears to be asymmetric fronting when in fact vowel quality is phonetically centralised in non-initial syllables? The answer is quite straightforward, and was foreshadowed earlier – aggregated results do not show the skewed distribution of morphemes elicited in each syllable. Consider the by-syllable counts of morphemes elicited in Experiment 2, shown in Table 11 and Figure 10.
Morpheme counts by syllable number in Experiment 2.

Table 11 Long description
The table consists of seven columns: Morpheme (split into two columns for label and form), Syllable 2, Syllable 3, Syllable 4, Syllable 5, and Total.
* Row 1: L O C, form forward slash minus D A forward slash. Syllable 2: 312. Syllable 3: 757. Syllable 4: 741. Syllable 5: 502. Total: 2,312.
* Row 2: P F V, form forward slash minus K A n forward slash. Syllable 2: 383. Syllable 3: 310. Syllable 4: 247. Syllable 5: empty. Total: 940.
* Row 3: P L, form forward slash minus l A r forward slash. Syllable 2: 307. Syllable 3: 305. Syllable 4: 260. Syllable 5: empty. Total: 872.
* Row 4: V B L Z minus R E C P, form forward slash minus l A minus ʃ forward slash. Syllable 2: 123. Syllable 3: 165. Syllable 4: empty. Syllable 5: empty. Total: 288.
Plot of morphemes elicited by position in Experiment 2.

Figure 10 Long description
The x-axis is labeled Vowel position in word with values 2, 3, 4, and 5. The y-axis is labeled Proportion with values from 0.00 to 1.00. A legend to the right identifies four morphemes by color: D A (lightest gray), K A n (medium-light gray), l A r (medium-dark gray), and l A-integral (black).
At position 2, the stack consists of l A-integral from 0.00 to 0.10, l A r from 0.10 to 0.38, K A n from 0.38 to 0.72, and D A from 0.72 to 1.00.
At position 3, the stack consists of l A-integral from 0.00 to 0.10, l A r from 0.10 to 0.30, K A n from 0.30 to 0.51, and D A from 0.51 to 1.00.
At position 4, the stack consists of l A r from 0.00 to 0.21, K A n from 0.21 to 0.41, and D A from 0.41 to 1.00. The black l A-integral morpheme is absent.
At position 5, the entire column from 0.00 to 1.00 is occupied by the D A morpheme.
Given the morphotactics of the language, as well as the sample forms in (5), which are based on McCollum’s (Reference McCollum2019a: 105–107; Reference McCollum, Hout, Mai, McCollum, Rose and Zaslansky2019b: 3), we conclude that McCollum’s data exhibit the same morphological skew as our own. Concerning the only two low vowel suffixes elicited by McCollum,  and
 , the locative
 obligatorily occurs further from the root than the plural
 . Thus, the counts of
 in syllables two and three of McCollum’s data should be higher than those of
 . In syllables four and five, though, McCollum’s data are drawn entirely from
 .
This morpheme count skew does not, in and of itself, explain why in three phonetic studies of Uyghur backness harmony, aggregated data display asymmetric fronting despite non-initial centralisation of backness. The skewed distribution of morphemes required by the language’s morphotactics introduces different segmental contexts that are responsible for the apparent fronting pattern.
When the morpheme-specific F2 patterns in Figure 7 are considered, it is obvious that F2 of  in
 is lowest, with F2 of
 in
 and
 slightly higher, and F2 of [ɑ] in
 ˜
 being the highest. In the first three cases, there is at least one flanking consonant that exerts a backing effect on the low vowel: the velarised lateral, the voiceless uvular stop or the trill (Klatt & Stevens Reference Klatt and Stevens1969; Recasens Reference Recasens2013). The fact that F2 of
 in
 was lower than in
 is surprising, since both the dark lateral and the trill may trigger backing of flanking vowels. Perhaps in this instance, the adjacent uvular stop that always immediately followed the sibilant, as in
 , contributes to the lowering of F2. Most significantly, the F2 of
 in the locative suffix
 ˜
 is around 100 Hz higher than in the other suffixes elicited. We attribute this to the preceding dental stop as well as a default [−back] articulatory affecting word-final vowel quality, consistent with McCollum’s description and our results from Experiment 1. The combination of these two forces, higher F2 at vowel onset and offset in
 ˜
 , results in increased values at vowel midpoint, as seen in Figure 9.
Turning now to  , F2 of this vowel differed considerably across the four morphemes elicited in Experiment 2. The second formant was highest in
 , lowest in
 and of intermediate values in
 and
 ˜
 . Recasens & Pallarès (Reference Recasens and Pallarès1999) and Recasens (Reference Recasens2013) find that the trill induces backing of adjacent vowels in Catalan. We thus tentatively assume the trill exerts a similar backing effect on the low front vowel in Uyghur. In contrast, we assume the velar in the perfective suffix
 triggers coarticulatory fronting (Delattre et al. Reference Delattre, Liberman and Cooper1955; Öhman Reference Öhman1966: Figure 5), resulting in the higher F2 of
 in
 . In earlier syllables, Table 11 and Figure 10 show a balance of these morphemes, resulting in an intermediate mean F2. In later syllables, the most commonly elicited morphemes happen to have intermediate values for F2. In other words, the stability of F2 of
 across positions in Figure 9 is just as much an accidental by-product of experimental methods as the fronting of
 .
These findings strongly suggest that backness harmony is not gradient in Uyghur, and that the apparent fronting reported in previous work is a by-product of local contextual effects. Our results undermine claims of gradience in Uyghur, but more generally, they do not rule out the potential for incomplete neutralisation or the inclusion of gradient representations in the phonological module of the grammar. In the next two subsections, we address these two more general topics. Our aim is to lay out the potential costs and benefits of these representations, and to delineate the components of phonologically gradient incomplete neutralisation.
5.2. Representational issues
In order to more fully understand the potential costs and benefits of introducing gradience into the phonology, it is useful to consider another representational shift in phonological theory, the advent of autosegmental representations. The autosegmental representations birthed by works such as Leben (Reference Leben1973) and Goldsmith (Reference Goldsmith1976), and explored in so much subsequent work (e.g., McCarthy Reference McCarthy1979; Pulleyblank Reference Pulleyblank1983; see Hyman Reference Hyman2014 for more recent discussion) introduced new ways to understand and theorise about sound patterns that have significantly shaped the field.
Alongside these benefits, the introduction of non-linear representations increased the expressive capacity of the phonological grammar. Relevant to the discussion of Uyghur, consider the possible trisyllabic words representable with string-based [±back]. Since [±back] is binary, there are
${2^3=8}$
 representations possible for such a string. Once multiple association of a single autosegment is introduced, the possibilities expand. For instance, a word like
 is represented with three distinct [+back] features in a string-based representation, and crucially there is no other arrangement of [+back] that generates this form. However, this same form is representable in autosegmental phonology as the multiple association of a single [+back] autosegment; the multiple association of two separate [+back] autosegments (two such representations that do not involve crossing lines exist); or the single association of three separate [+back] autosegments.
Now we can contrast the costs and benefits of autosegmental representations with the consequences of admitting gradient representations. As noted in McCollum (Reference McCollum2019a), gradient representations are largely incompatible with autosegments, specifically multiple linkage. If a word like  is derived by multiple linkage of a single autosegment, from what mechanism can subphonemic differences between these three
 vowels emerge? The autosegmental analysis is most straightforwardly interpreted as assigning an identical value for [±back] to each linked vowel. Introducing gradience with autosegments requires an additional means of assigning gradience to the links, or a distinct later round of phonological computation wherein gradience is introduced.
Concretely, it is necessary to ask what analytical advances have gradient representations offered? To date, the framework of Gradient Symbolic Representations has used such representations to account for a variety of exceptional patterns (Rosen Reference Rosen2016; Smolensky & Goldrick Reference Smolensky and Goldrick2016; Hsu Reference Hsu2019; Revithiadou & Markopoulos Reference Revithiadou and Markopoulos2021). Critically, in these cases, gradient symbols are introduced in the input and manipulated during computation, but are absent from the output (Smolensky et al. Reference Smolensky, Goldrick and Mathis2014; Goldrick et al. Reference Goldrick, Putnam and Schwarz2016). As Hsu (Reference Hsu2022) notes, output gradience is the largest unresolved question for work using gradient representations, with some work (e.g., Zimmermann Reference Zimmermann, Gallagher, Gouskova and Yin2018) allowing for output gradience that has no unique phonetic consequences, in contrast to work like McCollum (Reference McCollum2019a,Reference McCollum, Hout, Mai, McCollum, Rose and Zaslanskyb) that insists output gradience is manifest in the phonetics. While input gradience may be a useful tool for analysing exceptionality, there is, at present, no clear advantage derived from output gradience.
Conversely, a number of significant challenges emerge when grammars encode featural gradience. First, if inputs may be gradient but not outputs, or vice versa, a question of representational uniformity emerges. If one set of representations, inputs or outputs, is a strict superset of the other – or, even worse, disjoint – the featural hypothesis space of the grammar is necessarily increased. To contextualise the issue to Uyghur, let us for the sake of discussion treat the infinite possible values for [back], if conceived of as gradient, as a highly multivalent set of scalar values between [+back] and [−back]. For convenience, McCollum (Reference McCollum2019a) discretises backness to an eleven-step scale. Thus, if an OT grammar with McCollum’s (Reference McCollum2019a) eleven-step scale from [+back] to [−back] is adopted,
$11^3 = 1,331$
 possible [back] contrasts within a trisyllabic word can be generated, in contrast to the far smaller
$2^3 = 8$
 representations produced by typical string-based representations. Further, since OT demands a rich base, the set of input vowel representations must also be
$11^3$
 for the same trisyllabic word. The issue is only exacerbated in longer words: a six-syllable word has
$2^6=64$
 representational possibilities for [±back] in standard feature theory, but requires
$11^6=1,771,561$
 possible backness representations under McCollum’s analysis (see Du & Durvasula Reference Du and Durvasula2025 for similar argumentation). This considers only a single vowel feature; if a full set of features is similarly fine-grained, the representational space explodes even more. As an example of slightly increasing complexity, let us consider the four features necessary to uniquely identify all the vowel contrasts in Uyghur: [back], [round], [high] and [low]. Table 12 shows the exponential increase in the representational space when more fine-grained representations are employed. McCollum’s eleven-step feature system is compared with a standard set of four binary features, and with a simpler multivalent set of representations that only distinguishes four values along a given featural continuum.
Representing a four-feature system (e.g., Uyghur vowels) using three different granularities of representations.

Table 12 Long description
The table consists of five columns and four rows.
Column headers from left to right are: Feature Type (unlabeled), One syllable, Two syllables, Three syllables, and Four syllables.
Row 1: Standard binary features. Values are 16 for one syllable, 256 for two syllables, 4,096 for three syllables, and 65,536 for four syllables.
Row 2: Four-valued features. Values are 256 for one syllable, 65,536 for two syllables, 1.67 times 10 super 7 for three syllables, and 4.29 times 10 super 9 for four syllables.
Row 3: Eleven-valued features. Values are 14,641 for one syllable, 2.14 times 10 super 8 for two syllables, 3.14 times 10 super 12 for three syllables, and 4.59 times 10 super 16 for four syllables.
While the four-step scale in Table 12 results in a smaller increase in the feature space, there is nothing a priori that precludes adopting even more granular representations than McCollum does. To militate against some of the potential increase in the representational space derived from gradient representations, McCollum (Reference McCollum2019a) contends that phonological representations should at minimum reflect discriminable surface contrasts. Just noticeable differences along some phonetic dimension then become the yardstick for phonological contrasts (Flanagan Reference Flanagan1955; Huggins Reference Huggins1972). Problematically, language experience significantly affects an individual’s ability to discriminate a set of similar sounds (Tervaniemi et al. Reference Tervaniemi, Jacobsen, Röttger, Kujala, Widmann, Vainio, Näätänen and Schröger2006; Liu Reference Liu2013; Jongman et al. Reference Jongman, Qin, Zhang and Sereno2017), which seriously undermines any attempt to generate a universal set of gradient feature values (see Mielke Reference Mielke2008 for an alternative approach).
In the case of autosegments, the representational increase is modest compared to fully specified strings, but the theoretical advantages are numerous. However, no comparable theoretical advantages have been demonstrated by work advancing output gradience. Gradience may be a useful tool for analysing exceptions in a formalism like HG, but work in that vein that espouses output gradience has yet to offer compelling theoretical reasons to adopt these finer-grained surface representations. Instead, research on incomplete neutralisation has consistently proposed access to gradient representations to improve model fit. No radical revisions to our theory fall out from these representations. No keen insights into some unnoticed or unaccounted-for sound pattern have emerged. Perhaps they soon will, but until that time there is, in our estimation, insufficient reason to accept these fine-grained representations without clearer arguments demonstrating how they advance our understanding of the phonological grammar.
5.3. What constitutes a case of phonological incomplete neutralisation?
It is worthwhile at this point to briefly lay out a few basic criteria for any potential case of incomplete neutralisation. If one assumes the classic generative grammatical architecture, crucially and almost tautologically, phonological incomplete neutralisation must not be derivable from either task effects or phonetic effects. Our modelling in the previous section illustrates this point. Once morphemic and segmental context are controlled, the apparent fronting pattern in Uyghur turns out to be phonetic centralisation.
Second, phonological incomplete neutralisation must exhibit a difference large enough to be perceived by humans. If, for instance, the magnitude of a durational effect is only one to two milliseconds and extant evidence suggests humans do not reliably perceive comparable modulations in consonant duration (e.g., Huggins Reference Huggins1972), then those results do not unequivocally bear on the topic at hand.
Third, and perhaps most importantly, purported cases of incomplete neutralisation would be unequivocally phonological if they uniquely interact with other patterns in the grammar. For instance, Du & Durvasula (Reference Du and Durvasula2022) report phonetically incomplete neutralisation of tone sandhi in Huian Mandarin that is not derivable from phonetics and task effects, and is large enough to be perceived by humans. Yet, they find that incompletely neutralised tones behave exactly like fully neutralised tones, feeding another tonal pattern in the language. To hold up under scrutiny, any case of incomplete neutralisation requiring reference to gradient representations must interact with other sound patterns in a manner distinct from both neutralised and non-neutralised sounds. To quote Prince (Reference Prince1983: 31), ‘It is a rule of thumb of practical ontology that a thing exists to the extent that other things interact with it, make use of it.’ If gradient representations exist in the phonological grammar, then the best evidence for them will come from patterns wherein gradiently valued elements uniquely interact with other parts of the grammar.
6. Conclusion
The classic generative view of phonology includes a commitment to discrete representations. This view, however, has been challenged repeatedly over the last four decades, often centering around patterns of incomplete neutralisation of some phonological contrast. In this article, we addressed a unique pattern of purported iterative incomplete neutralisation, backness harmony in Uyghur. We have reported results from two experiments intended to evaluate whether gradient representations are necessary to model the pattern. Results indicate that the pattern is derivable from a categorical phonological pattern of harmony with post-phonological centralisation, critically undermining the claim made in previous work that the attested gradience is phonological and not due to phonetic forces. We have also discussed the larger ramifications of a theory of gradient representations for phonology and laid out a number of necessary criteria for establishing gradient phonology.
Competing interests
The authors declare no competing interests.
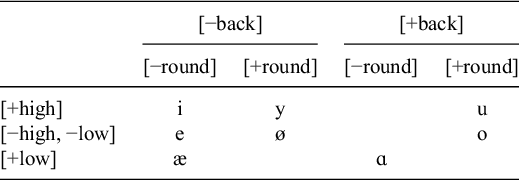

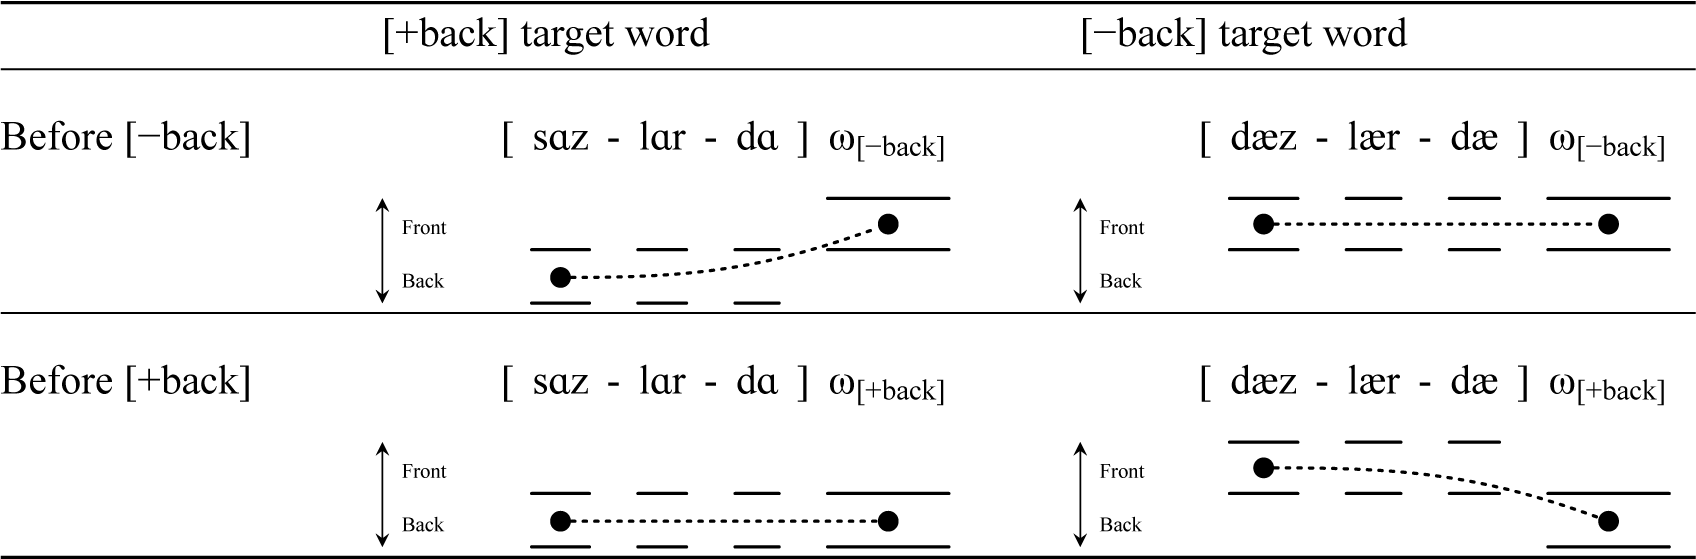

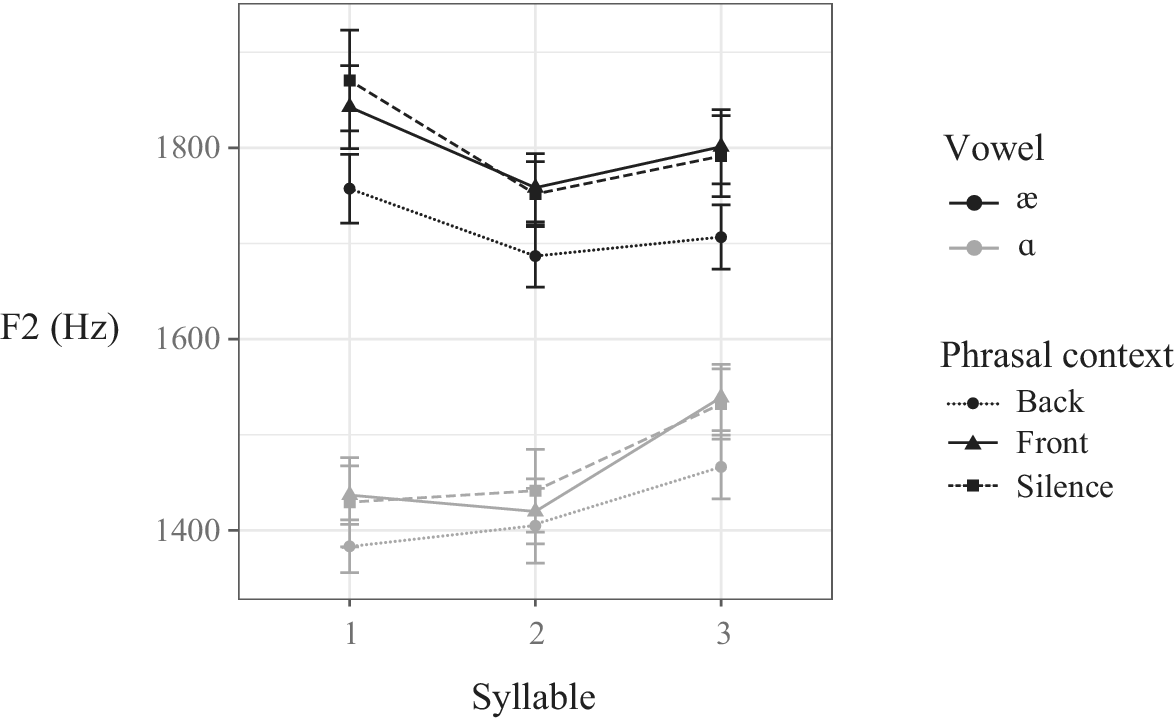
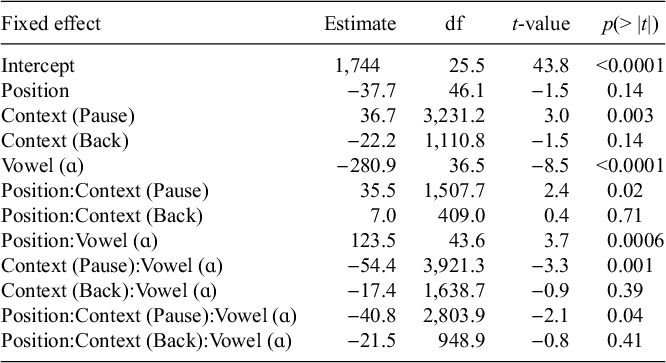
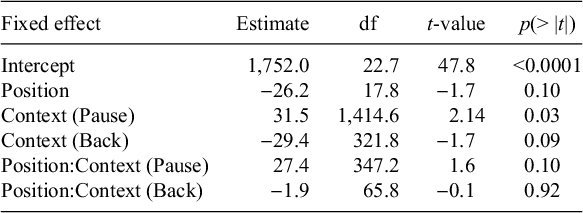
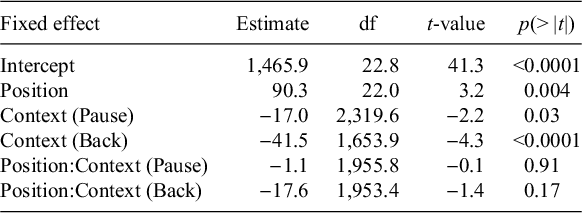

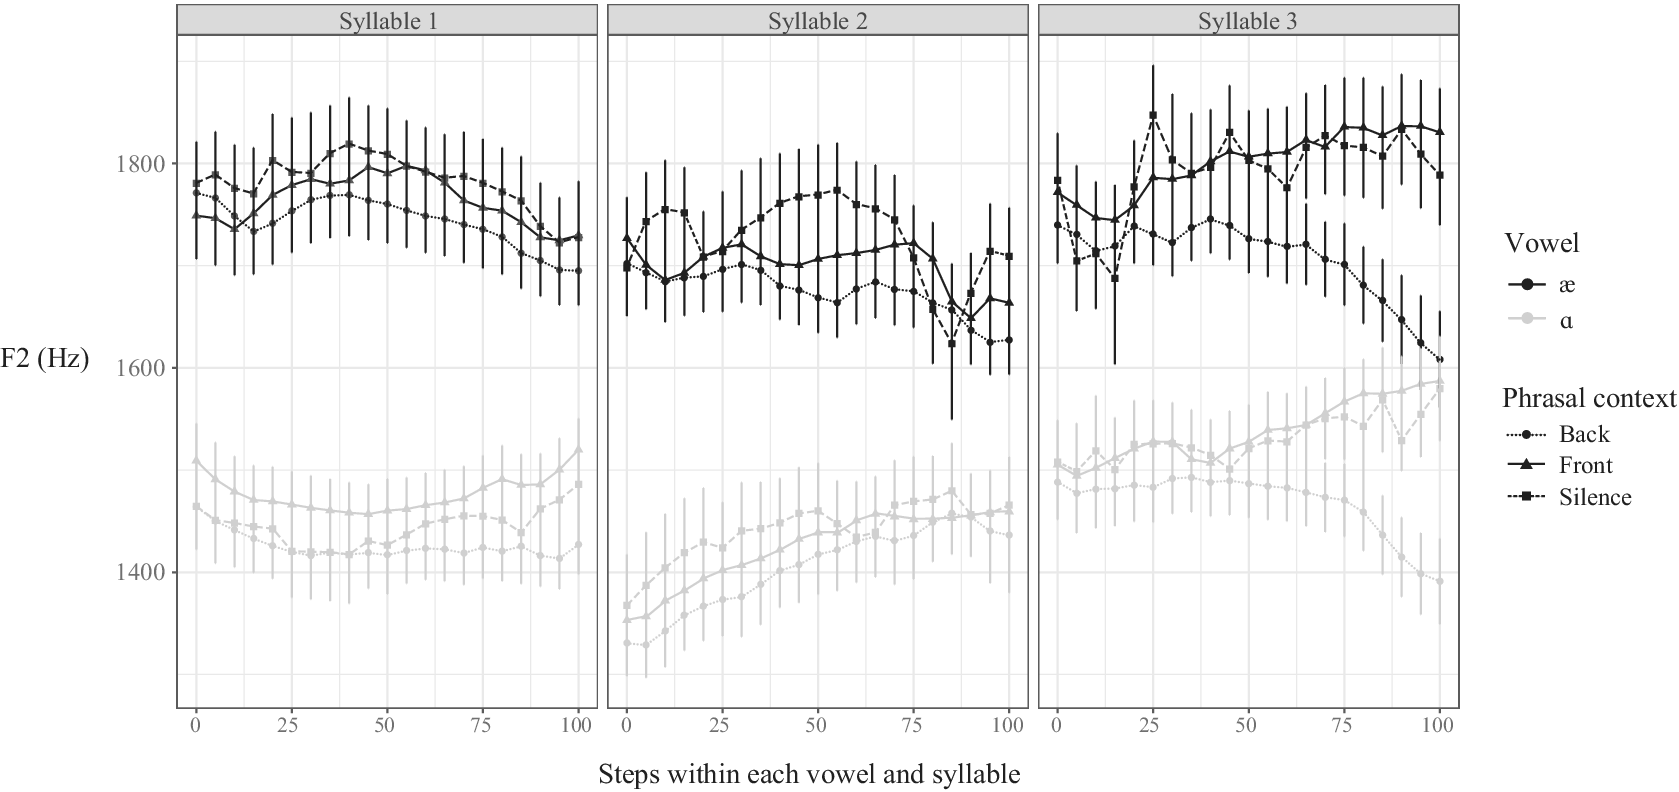
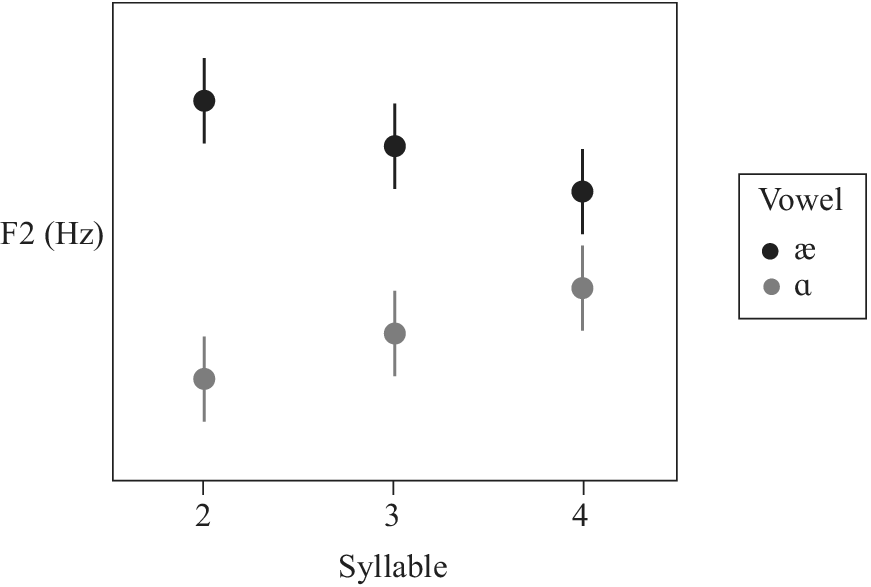
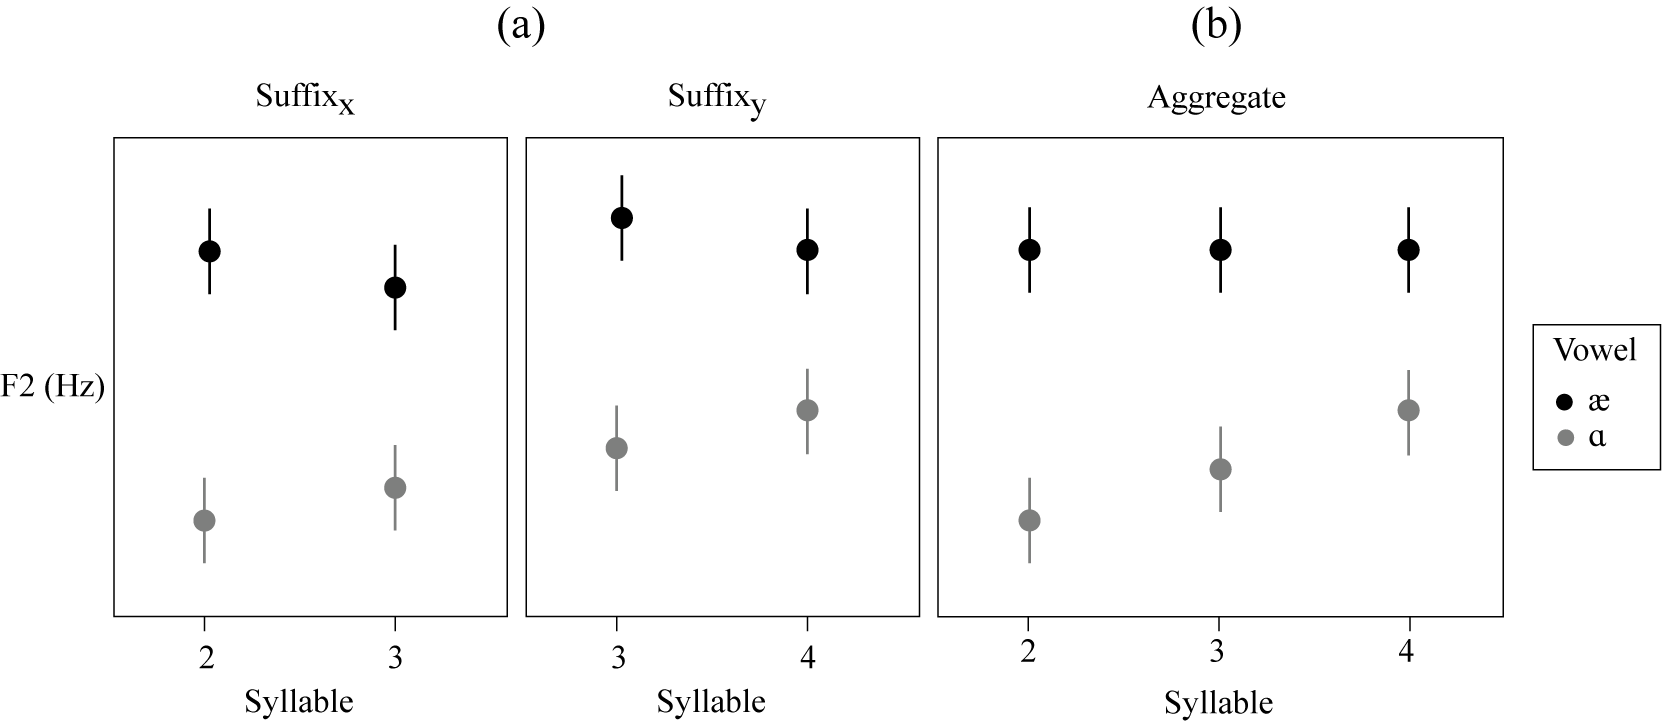
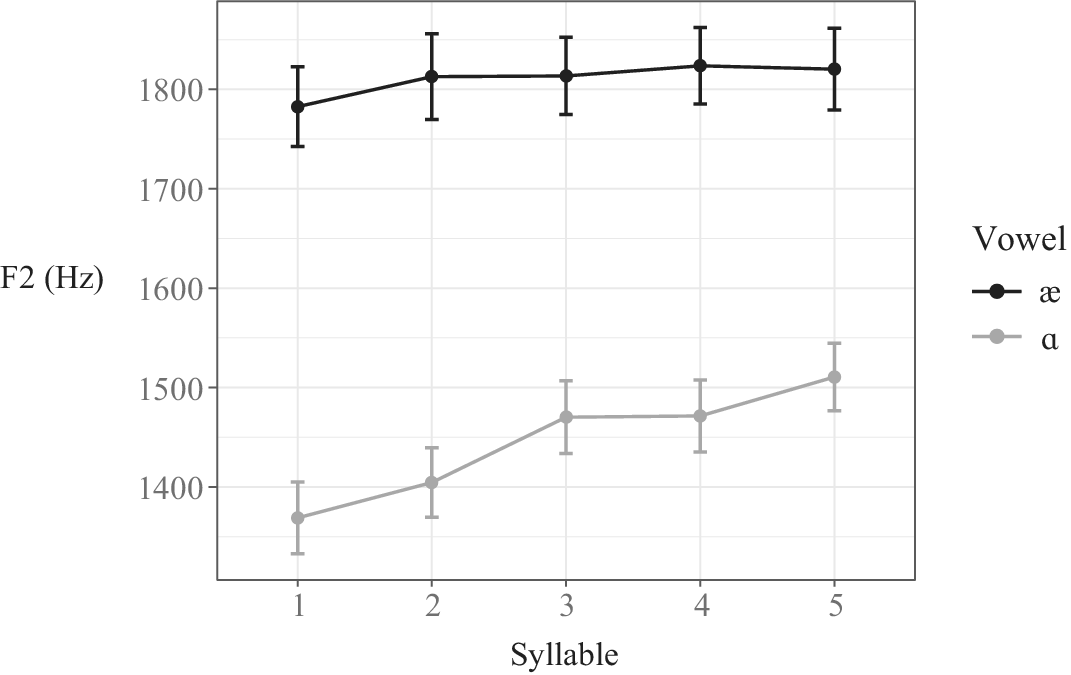
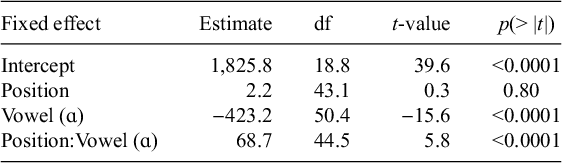
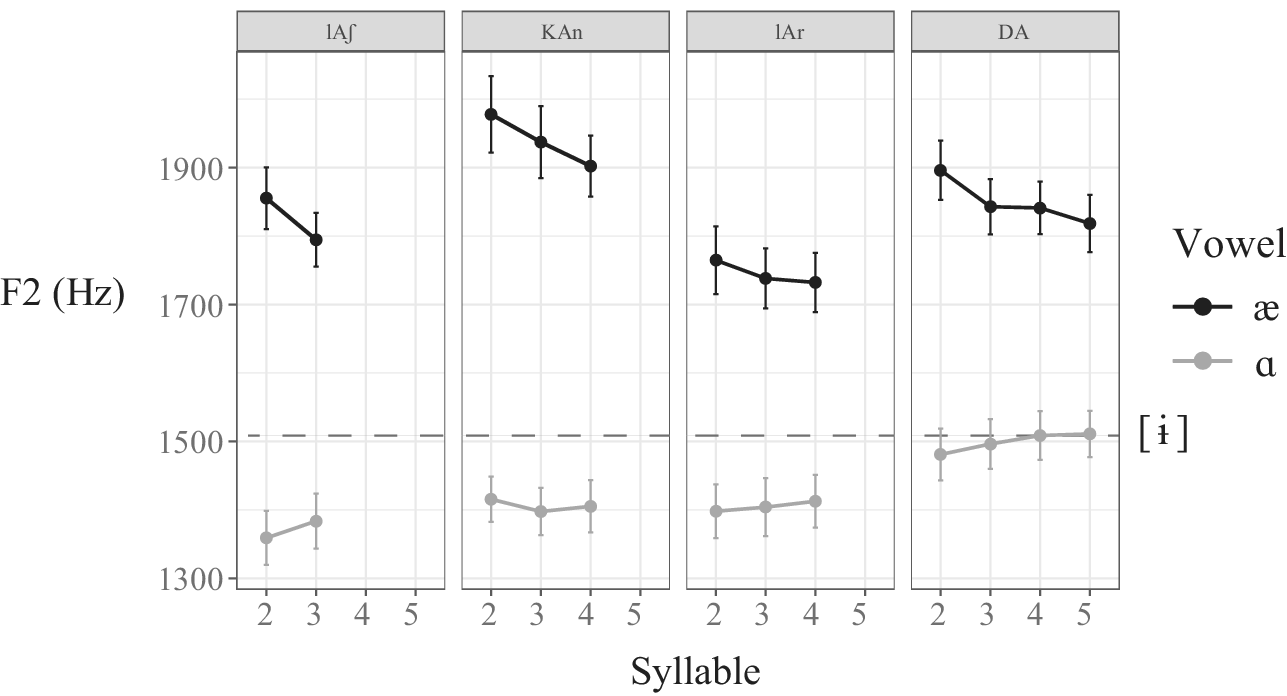
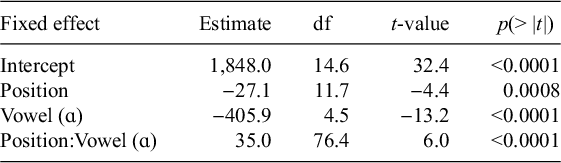

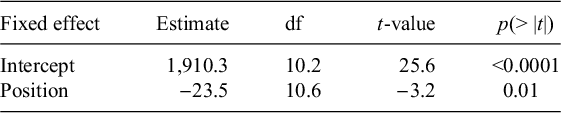
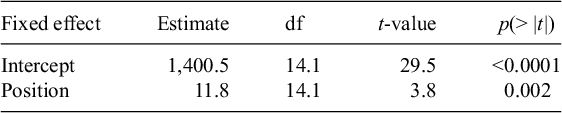
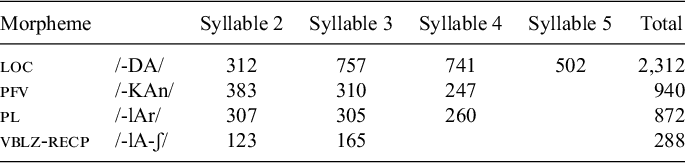
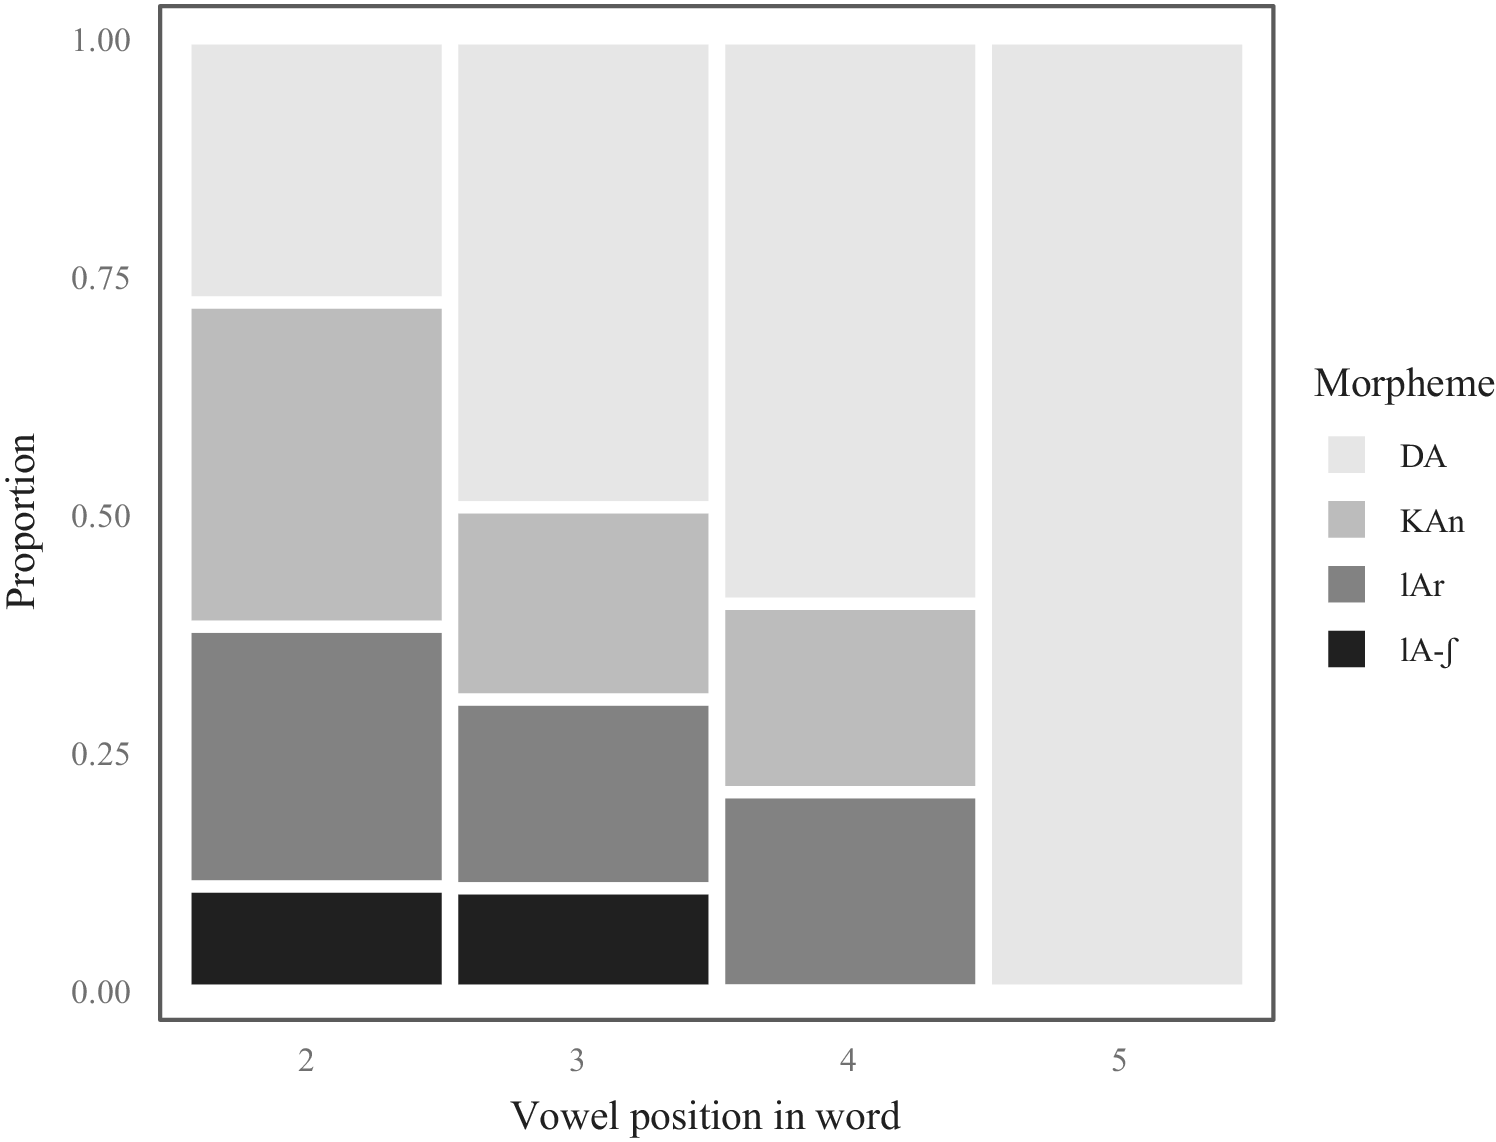


 Open access

