

INTRODUCTION
Understanding religious intolerance has become a central concern of policy makers and publics alike in this global “age of explosive, pervasive religiosity” (Berger Reference Berger2006) that shows no signs of abating (Shah and Toft 2006). Recent cross-national research finds that religious intolerance leads to violence (Grim and Finke Reference Grim and Finke2007). However, it is unclear how well religious intolerance outside the United States is understood by policy makers and officials (Danan et al. Reference Danan, Hunt, Barton and von Hippel2007). This is a particularly important question for the foreign policy community of the United States government (Farr Reference Farr2008), which has misunderstood Arab and Muslim-majority public opinion (Lynch Reference Lynch2003) and faces a rising tide of negative global public opinion (Kohut and Stokes Reference Kohut and Stokes2006) that is difficult to reverse (Smith 2007). As one scholar put it, “Religion matters more than ever in global affairs. But don't count on the experts — or the State Department — to know that” (Di Iulio Reference Denzin2007).
We examine the U.S. State Department's understanding of issues related to religion by comparing data from its annual report on international religious freedom with two other types of data sources: public opinion surveys and expert analyses. By doing so, we address two broad and interrelated issues relevant to the social scientific study of religion. First, substantively, we ask whether the State Department's analysis of international religious freedom is consistent with other key indicators of religious freedom and tolerance around the world. The International Religious Freedom Act of 1998 (IRFA) makes the defense of religious freedom a formal foreign policy objective of the United States,Footnote 1 and a key provision of the IRFA requires the State Department to annually produce a written report for the President and Congress on the status of and violations against religious freedom in all countries of the world. These annual reports carry with them the possibility of sanctions and are thus treated as serious documents of state. In the IRF annual reports, the State Department is required to assess and describe not only violations of religious freedom by governments but also violations by nongovernmental (social) actors, including religious groups.Footnote 2 Therefore, social attitudes such as religious intolerance that restrict religious freedom are specifically addressed in each country's IRF report.
A leading scholar has suggested that the State Department's “annual reports have come to be the most extensive and reliable sources of the state of religious freedom in countries of the world” [italics ours] (Van der Vyver Reference Johan D2006, 1).Footnote 3 The IRF reports certainly are extensive (more than 800 pages each year covering nearly 200 countries), but can Van der Vyver's assertion be correct when applied to the reliability of the reports to capture social attitudes, such as religious intolerance, that limit religious freedom? If the data are not comparable to other sources of data on international religious attitudes, this would raise questions about whether the U.S. State Department is out of touch with social religious intolerance around the world.
Second, methodologically, as we evaluate whether the State Department's analysis of international religious intolerance is consistent with other measures of religious intolerance around the world, and we also evaluate whether the different types of data sources tell the same story about international religious intolerance. Specifically, we examine three types of data: an index measuring the social regulation of religion based on coded data from the State Department reports on international religious freedom; public opinion data on religion and tolerance from surveys by the Pew Forum on Religion & Public Life, the Pew Global Attitudes Project, and the World Values Survey; and expert analysis of social restrictions on religious freedom in countries around the globe by the Hudson Institute.
The scholarly understanding of cross-national religious intolerance has been hampered by a lack of adequate data. For instance, although survey research has investigated the links between religion and tolerance in the United States, few studies have examined this topic from a broader, cross-national perspective (Karpov Reference Karpov2002), and those that have, often have limited their focus to European countries (Fetzer and Soper Reference Fetzer and Soper2003) for which data are more readily available. The study of religious intolerance has likewise been hampered by a lack of clear measures. As will be evident when we review our main measures, measures of religious intolerance tap into something quite different from religious commitment and doctrinal orthodoxy, which others have found to be unconnected to at least political tolerance (Eisenstein Reference Eisenstein2006). Furthermore, cross-national surveys often lack measures on religious intolerance, and where they exist, they are often limited by the number of countries covered.
Certainly, measuring religion-related issues can be a complex and challenging endeavor, no matter which aspect of religion is being measured (Fox Reference Fox2008), and indeed, all three data sources have significant strengths and weaknesses. The State Department reports are comprehensive and draw on the extensive country-specific knowledge of State Department personnel, but as noted above, Di Iulio and others have questioned the State Department's understanding of international religious issues. An additional limitation of the State Department information is that their reports make no attempt to measure religious intolerance, but merely report it. To overcome this, we use content coding of the reports, which comes with its own additional set of methodological limitations (Grim et al. Reference Grim, Finke, Harris, Meyers and VanEerden2006). Similarly, the Hudson Institute expert analysis data benefit from scholars with considerable knowledge, but in many cases, expert opinion has been shown to be notoriously inaccurate (see, for example, Tetlock's Reference Tetlock2005 study of expert predictions).
Finally, while survey research is a widely accepted method for assessing public attitudes on religion and other topics, the validity of poll findings has been questioned by a variety of commentators who argue that the limitations of polls are given short shrift (Huffington Reference Huffington1998; Lang Reference Lang2008; Lang and Lang Reference Lang and Lang1987). State-of-the-art survey methodology in the United States perennially wrestles with a host of challenges (Groves et al. Reference Groves, Fowler, Couper, Lepowski, Singer and Tourangeau2004) ranging from satisficing and social desirability response bias (Holbrook, Green and Krosnick Reference Holbrook, Green and Krosnick2003) to nonresponse (Curtin, Presser and Singer Reference Curtin, Presser and Singer2000; Groves, Cialdini and Couper Reference Groves, Cialdini and Couper1992; Keeter et al. Reference Keeter, Miller, Kohut, Groves and Presser2000; Lin and Schaeffer Reference Lin and Schaeffer1995; Teitler, Reichman and Sprachman Reference Teitler, Reichman and Sprachman2003) to a growing cell-only population (Keeter et al. Reference Keeter, Kennedy, Clark, Tompson and Mokrzycki2007).Footnote 4 And cross-national survey work has its own set of serious challenges (Yamagishi and Yamagishi Reference Yamagishi and Yamagishi1994). Moreover, less is known about the shortcomings of cross-national polling, since less research on research has been done in this area.Footnote 5 Given these criticisms and uncertainties, the limitations of polling must be taken seriously (Frankovic Reference Frankovic2005; Igo Reference Igo2007), and measured against other data sources and external realities when possible (Daves and Newport Reference Daves and Newport2005). The survey data used in this article have additional limitations. Data from the World Values Survey cover a sufficient number of countries, but the analysis is based on a single question, which is relevant to the topic being examined, but not directly on point. The two sets of data from the Pew Research Center are more on point, but they cover fewer countries.
It is with such limitations in mind that many researchers emphasize the need for multiple measures and use “data triangulation,” i.e., the employment of distinct measures of the key conceptual dimensions of a proposed concept that tap into the mechanisms underlying the phenomenon. Triangulation applies to both method and measure. Since any one indicator has only a probability relation to our underlying concept, we should consider a great many possible indicators to get at it (Lazarsfeld and Rosenberg Reference Lazarsfeld and Rosenberg1955). If a concept is measured along only one dimension, it will be a unidimensional, flat picture subject to greater bias and error. “In fact, in most instances the only defensible way in which to create viable models is to use multiple measures of each construct assessed” (Maruyama Reference Maruyama1998, 131). Norman K. Denzin (Reference Denzin1970) specifically sees index construction — which we use extensively in this investigation — as “one strategy of triangulation” (117) that increase validity. His assertion is supported by Webb et al. (Reference Webb, Campbell, Schwartz, Sechrest and Grove1981) who argue that once “a proposition has been confirmed by two or more independent measurement processes, the uncertainty of its interpretation is greatly reduced. The most persuasive evidence comes through a triangulation of measurement processes. If a proposition can survive the onslaught of a series of imperfect measures … confidence should be placed in it” (35).
We now explore whether these multiple data sources using three very different methodologies lead us to similar conclusions about religious intolerance. In recent years, numerous social scientists have explored linkages between public opinion data and other types of data. For instance, in his influential study, Making Democracy Work, Robert Putnam (1993) employs survey and other non-survey data to examine the relationship between “civic community” and institutional performance in Italy. And cross-national researchers have examined the relationship between survey results and expert analysis, especially between survey and non-survey based measures of political freedom (Bratton Reference Bratton2002; Inglehart Reference Inglehart2003; Norris and Inglehart Reference Norris and Inglehart2008; Inglehart and Welzel Reference Inglehart and Welzel2005; Netjes and Binnema Reference Netjes and Binnema2007; Norris Reference Norris and Norris1999). Also, other recent studies have used combined data approaches in their study of religion-state issues (Barro and McCleary Reference Barro and McCleary2003; North and Gwin Reference North and Gwin2004). However, relatively few studies have explored the extent to which different research approaches tell us the same thing about global religion or, more specifically, international religious intolerance.
With these substantive and methodological issues in mind, we proceed as follows. We first describe our data, including overview comments on the State Department's International Religious Freedom reports. Then we analyze the extent to which these various data sources correspond to one another, and discuss the results. We conclude by discussing the substantive and methodological implications of our findings.
DATA
Our study uses two relatively new and unique cross-national sources of data in addition to survey data from the World Values Survey, the Pew Global Attitudes Project, and the Pew Forum on Religion & Public Life. The first unique data source was coded by Grim et al. (Reference Grim, Finke, Harris, Meyers and VanEerden2006) from the State Department's annual International Religious Freedom reports. Specifically, we use the social regulation of religion index (SRI) calculated by Grim and Finke (Reference Grim and Finke2006), which is a cross-national measure of social religious intolerance in 196 countries.
The second new source of data is unique and especially useful for our purposes. The data were collected using a quanti-qualitative methodology (QQM) where quantitative data are collected as part of a qualitative study (Grim, Harmon and Gromis Reference Grim, Harmon and Gromis2006). Specifically, as part of a survey of country experts (Marshall Reference Marshall2008; Grim Reference Grim and Marshall2008), the Hudson Institute's Center for Religious Freedom independently calculated SRI scores for 101 countries using the same questions Grim and Finke used for their SRI scores coded from IRF reports.
STATE DEPARTMENT'S IRF REPORTS AND CODING
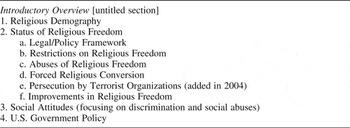
The IRF reports are a loosely structured, retrospective, qualitative survey of most countries of the world, covering 196 countries in 2005. Since 2001, the reporting format is as shown in Table 1.
IRF Report Format (for each country)

The IRF reports are bounded (July 1 to June 30, annually) and include retrospective information on events that have been systematically monitored since 1997, approximating a trend study, which captures both recurring problems and specific problems that occurred during the reporting period. Information for the reports is gathered by Embassy officials in country capitals and other cities with U.S. Consulates, with additional information provided by other government agencies and specialists. The final reports are written by a fulltime research staff under the direction of the special ambassador for international religious freedom at the U.S. State Department in Washington, D.C.
Section 3 of the IRF reports (see Table 1) describes inter-religious attitudes that are manifested in social actions that directly impinge upon religious freedom. The reports cover social issues ranging from whether minority religious groups report discrimination to whether social conflict is directly related to religious identities and/or practices. We should note that the reports on social attitudes are of differing lengths depending on the degree to which social forces affect the free practice of religion in a given country. For example, China's social section — including appended reports on Tibet, Hong Kong, and Macau — is drastically shorter (856 words) compared with India's (8,257 words), which reflects that many of the observed violations of religious freedom in India emanate from social forces, while observed violations of religious freedom in China generally emanate from the government.
In previous work, Grim and colleagues described the process of quantitatively coding the State Department's International Religious Freedom reports (Grim et al. Reference Grim, Finke, Harris, Meyers and VanEerden2006; Grim and Finke Reference Grim and Finke2005, Reference Grim and Finke2006, Reference Grim and Finke2007; Grim Reference Grim2004, Reference Grim2005). In brief, they used common best coding practices (Crittendon and Hill Reference Crittendon and Hill1971; Funkhouser, Ray and Parker Reference Funkhouser, Ray and Parker1968; Montgomery and Crittendon Reference Montgomery and Crittendon1977; Willis et al. 1999) and employed strict training and coding protocols to ensure that the coded data are as transparent, objective, and reproducible as possible. Each country's report was double-blind coded by two trained coders and scores were scanned into an SPSS dataset using TeleForm technology. The pairs of coders met together with a senior researcher to review their scores and reconcile differences item-by-item. Grim and colleagues completed coding of three separate years of IRF reports — 2001, 2003, and 2005. Overall, they report that the coding inter-rater reliability was high.
Grim and Finke's (Reference Grim and Finke2006) SRI is particularly useful both because it represents the negative social attitudes discussed in the IRF reports and because it incorporates multiple measures of social attitudes toward other religions that reliably function as an index in all three years of the coded data. Grim and Finke (Reference Grim and Finke2006) define social regulation of religion as “the restrictions placed on the practice, profession, or selection of religion by other religious groups, associations, or the culture at large” (5). They describe the social regulation of religion as the negative attitudes toward certain religions that are represented either by the pervasive norms and culture of the larger society or by specific discriminatory or aggressive acts of groups that support or oppose religion. This is often a case of one religious group regulating other religions and/or attempting to establish hegemony for their own religion. As is the case in any social situation, a religious group may seek to gain the upper hand in society by forming cartels and alliances that attempt to regulate society and give such a group a competitive advantage (Finke and Stark Reference Finke and Stark2005). Thus, the SRI is a measure of social religious intolerance.
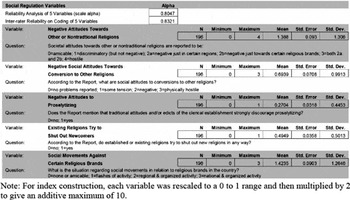
The SRI is composed of five variables that were reliably coded and hold a high level of internal scale reliability.Footnote 6 The variables range from 0 to 1, 2, 3, or 4, but each was rescaled to range between 0 and 2 so that the resulting index would have a maximum value of 10. The SRI variables coded from the IRF are:
1. Are social attitudes negative towards other or nontraditional religions?
2. Are social attitudes negative towards conversions to other religions?
3. Do attitudes and/or edicts of the clerical establishment discourage proselytizing?
4. Do established or existing religious groups try to shut our new religions?
5. Do social movements or civic organizations affect the ability of certain religions to operate freely in the country?
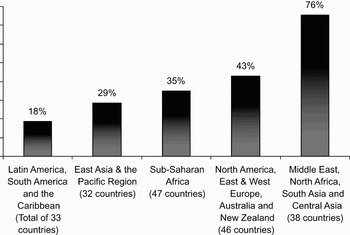
We will use the average SRI score for the three years of coding (2001, 2003, and 2005) to reduce the impact of any annual fluctuations.Footnote 7Figure 1 shows the percentage of countries within each of five different world regions that fall into the top 50% of all SRI scores. As Figure 1 indicates, SRI scores vary considerably across regions of the world. Overall, Latin America, South America, and the Caribbean have lowest SRI scores and therefore the lowest levels of religious intolerance, according to coded IRF reports. Meanwhile, the highest SRI regional scores are found in the Middle East, North Africa, and South and Central Asia, indicating that public attitudes in these countries are relatively more intolerant toward other religious groups.
Countries Within Top 50% of SRI Scores by Region (N=196 Countries).

We will compare the SRI coded from the IRF reports with pertinent data from the World Values Survey, the Pew Global Attitudes Project, the Pew Forum on Religion & Public Life, and the Hudson Institute's Center for Religious Freedom.
WORLD VALUES SURVEY
Wave 4 (1999–2004) of the World Values Survey included a measure directly related to the concept of tolerance, and in particular, to the value that individuals place on teaching tolerance to their children. Respondents were read a list of qualities that children can be encouraged to learn at home, and they were asked to select five from the list that they consider especially important. One of the qualities was “tolerance and respect for other people.” This question was asked of 36,323 respondents from 69 countries throughout the world (66 have comparable SRI data coded from State Department reports). Those who mentioned tolerance and respect for other people as an important quality received a 1 on this measure, while those who did not choose this quality received a 0. The mean score across all respondents is 0.7, indicating that tolerance is an important value to many of those surveyed. When we aggregate the data to the country level, the average score is the same (0.7).
While this measure should strongly and negatively correlate with the SRI coded from the State Department reports, any conclusions drawn due to a correlation with a single variable would be on shaky ground indeed since error and extraneous influences are more likely to affect a single measure, and thus generalizations made from its analysis (Maruyama Reference Maruyama1998). Also, not only is tolerance in general a step removed from religious tolerance, it is also a positive quality that may be aspired to and valued for children to learn, but not necessarily an attitude held by adults when faced with complex choices.
PEW GLOBAL ATTITUDES SURVEY
To overcome the limitation of a single variable, we next turn to data more closely related to religious intolerance with multiple survey measures that can be combined into a single index. The 2006 Pew Global Attitudes survey included a battery of questions designed to measure how people from different cultural and religious backgrounds view one another, especially how people in predominantly Muslim versus non-Muslim countries see each other.Footnote 8 The poll asked non-Muslims in eight countries whether they associate a series of positive and negative characteristics with Muslims — and it asked Muslims in 11 countries the same set of questions about Westerners. Although “Western” is not an explicitly religious concept, being Western, as religion scholar Philip Jenkins (Reference Jenkins2007) has noted, is traditionally understood to be closely related to being part of what was formerly called Western Christendom. Being Muslim is, of course, an explicitly religious identity. Elsewhere, Wike and Grim (Reference Wike and Grim2007) have referred to this concept as religious-cultural negativity (RCN) and defined it as a low opinion toward social groups whose core religion-related social identity is perceived to be different from one's own.
The positive characteristics from the survey included in our analysis are “generous” and “honest,” while the negative qualities are “arrogant,” “greedy,” “immoral,” “selfish,” and “violent.”Footnote 9 In Britain, France, Germany, India, Nigeria, Russia, Spain, and the United States, non-Muslim respondents were read the lists of positive and negative characteristics, and for each one, were asked whether they associated it with Muslims. In Britain, Egypt, France, Germany, India, Indonesia, Jordan, Nigeria, Pakistan, Spain, and Turkey, Muslim respondents were read the same lists and asked whether each one applies to people in Western countries such as the United States and Europe.Footnote 10 (Note: We reverse coded the positive characteristic questions, i.e., generous and honest, so that they represent the negative answer, i.e., that those who aren't my religious-cultural background are not honest or not generous.)
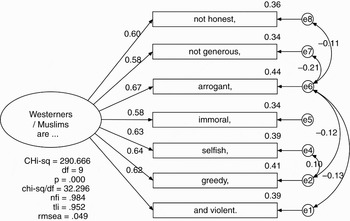
Based on 13,029 cases from the 12 countries used in our analysis, factor analyses of the battery of characteristics questions confirmed that the seven questions statistically related to a common factor of negativity toward those who are of a different religious-cultural orientation, specifically, in this case, negativity of Muslims toward Westerners and of Westerners toward Muslims. The results of this factor analysis are shown in Appendix B. We also ran the factor model for each country, and found that all seven items significantly load onto the factor in each country's model as well. This provides sufficient evidence to treat these seven items as a scale that functions across the 12 countries included in this analysis.
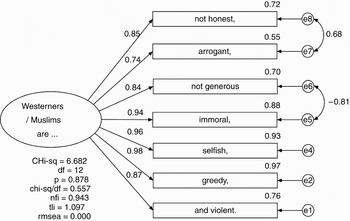
We will use the country means of the weighted data to create individual country indexes rather than using factor scores because means are simpler and more easily reproduced by other researchers.Footnote 11 Therefore, we further tested the factor using just the aggregated weighted mean scores for each country to see if the factor continues to function cross-nationally. The results of this factor analysis are presented in Figure 2. All seven questions load onto the factor at 0.74 or stronger and the R-square, or the amount of variance in each variable that is explained by the common factor, is 0.55 or higher. The fit statistics are extremely strong: The RMSEA statistic of 0.000 can be interpreted to mean that this model is 100% away from the worst-fitting model. The other fit statistics are also good (NFI = 0.943 and TLI = 1.097). The 0.878 p-value associated with the chi-square statistic indicates that the likelihood of a model other than this fitting the data is statistically insignificant.
Confirmatory Factor Analysis of Characteristics Battery (using country means).

We then calculated a RCN index by adding each country's weighted mean score for the seven items, each of which was scored 1 if a respondent indicated that the characteristic applied to the other group. The index thus ranges from 0 (all positive assessments) to 7 (all negative assessments). This provides data on 12 countries that can be compared with coded State Department data.Footnote 12
We expect that the RCN index should be positive and more strongly correlated with the SRI coded from the State Department reports than the World Values Survey variable on intolerance because the RCN is a more robust measure utilizing multiple measures and more importantly because they relate more directly to religious intolerance.
PEW FORUM'S 10-COUNTRY SURVEY
Of the various survey measures we utilize in this article, the next measure is a unique set of two questions that closely reflect the concept of social religious intolerance that impinges upon religious freedom. In 2006, the Pew Forum on Religion & Public Life conducted a 10-country survey that included two questions which, when viewed in tandem, provide a way to assess respondents' attitudes toward freedom of religion for themselves and for others in their country.Footnote 13 As part of a battery of questions probing opinions about things that people can and cannot do in some countries, respondents were asked the following two questions in the order shown:
1. How important is it to you to live in a country where you can practice your religion freely?
2. How important is it to you to live in a country where there is freedom of religion for religions other than your own?
Respondents were given the following response options: very important, somewhat important, not too important, and not at all important, in addition to the options to express no decided opinion or to refuse to answer.
Having these two questions in tandem provides very different information from just a single question asking respondents to assess whether they can practice their religion freely. Asking back-to-back questions about freedom for “your religion” and “religions other than your own” provides a way for respondents to consider the importance of religious freedom for others within the context of their own religious freedom. The degree to which they value their own freedom more highly than they do freedom for others is an indicator of religious intolerance, because the gap between the answers represents a measurable negative social attitude toward other religions. In other words, the difference between the number of people who consider freedom for “their own religion” very important and the number who consider freedom for “religions other than their own” very important represents a “religious intolerance gap.” Any difference between these two numbers becomes especially important because the ordering of the questions will likely cause many respondents to give a higher value to religious freedom for other religions than they would have if the questions been asked in isolation. Once they report on their own religious freedom's importance, respondents will be likely to carry over this same attitude as they answer the next question out of a sense of fairness (Hyman and Sheatsley 1950; Schuman, Kalton and Ludwig Reference Schuman, Kalton and Ludwig1983). The possibility of a positive carryover effect means that any differences found between the two questions reveals a more deeply-felt attitude than would be found by asking the second question in isolation from the first question.
We expect that the “religious intolerance gap” should be strongly and significantly correlated with the SRI scores coded from the State Department reports if the reports actually reflect public opinion.
HUDSON INSTITUTE CENTER FOR RELIGIOUS FREEDOM EXPERT INTERVIEWS
The next data source provides a unique opportunity to check coded State Department data against independent expert opinion and, in the process, also consider whether expert opinion correlates with public opinion poll findings. In 2007, the Hudson Institute's Center for Religious Freedom conducted expert interviews on the state of religious freedom in 101 different countries. As part of the Hudson Institute study, they asked these experts to rate the countries using exactly the same SRI questions used by Grim and Finke to code the State Department reports. We are thus able to compare identical questions used to measure SRI rather than just similarly related measures.
If the State Department reports reflect independent expert opinion, the Hudson Institute SRI scores should be very strongly and positively correlated with the SRI scores coded from the reports. Arguably, however, we should expect that the coded State Department reports will be more strongly correlated with the survey data discussed above for the simple reason that they represent layers of quality control and input from numerous expert sources. The Hudson Institute SRI scores, on the other hand, are assigned by a single country expert who completed the written interview for the particular country of his/her expertise.
RESULTS
We will now look at the results of comparing the SRI scores coded from the State Department reports with data from each of the above sources.
World Values Survey “Tolerance” Question
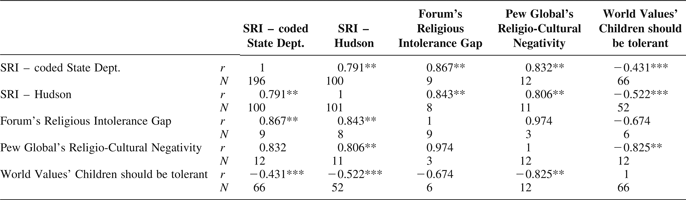
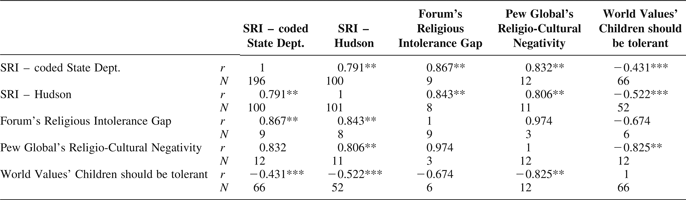
Table 2 shows the correlation between the SRI coded from State Department reports and the 66 weighted mean country scores for the World Values Survey question on whether respondents consider “tolerance and respect for other people” to be an important quality for children to learn. We find a moderate but highly significant and negative correlation (–0.431, p < 0.001, two-tailed), showing that countries with higher mean scores for the importance of encouraging tolerance tend to have lower scores on the SRI, so the correlation works in the expected direction.Footnote 14
Correlation between High Tolerance and High SRI

Pew Global Attitudes RCN Index
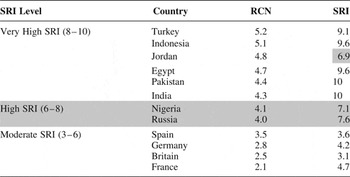
As mentioned above, we believe that the RCN index is a more robust measure of religious intolerance. And we do indeed find a positive, significant, and much stronger correlation between the SRI coded from State Department reports and the RCN calculated from 2006 Global Attitudes Project poll (0.832, p < 0.01, two-tailed). Considering the close association, it is useful to consider how the 12 countries compare when the RCN and SRI scores are put side-be-side. Table 3 puts the countries into three groups according to the level of the SRI scores: Very High = 8 to 10, High = 6 to 7.9 (shaded grey), and Moderate = 3 to 5.9. The countries are rank-ordered from high to low by their RCN score. The RCN index for these 12 countries ranges from 2.1 to 5.2, and the SRI ranges from 3.1 to 10.
SRI compared with the RCN index

Pearson r = 0.832, p < 0.01.
The RCN scores correspond remarkably well with the three SRI levels. Each of the five countries with SRI scores greater than 9 (very high) corresponds with countries at the upper end of the RCN index. All four of the countries in the moderate SRI category correspond with the countries having the lowest RCN values. And two of three high SRI country scores fall in the middle of the RCN range. The one obvious outlier is Jordan, which has only a “high” SRI but is in the highest end of the RCN scores. The discrepancy could be due to an under-reporting of religious intolerance by the State Department, although there may be some reasons to believe that Jordan differs in important ways from other countries in the region. For example, Jordan has uniquely made it possible for religious groups to legitimately participate in the political process (Wiktorowicz Reference Wiktorowicz2001). The situation in Jordan is in contrast to Egypt, where the Muslim Brotherhood has more conflict with the state (Moaddel Reference Moaddel2002). Since the State Department judges attitudes through observable social actions, there may be less negative actions to observe since Jordanian religious groups have a legitimate venue for political participation and for expressing their views. Nonetheless, with only one country score out of the 12 that seems out of general alignment, these results offer some evidence that the IRF reports as measured by the SRI closely correspond to public opinion data.
Pew Forum “Religious Intolerance Gap”
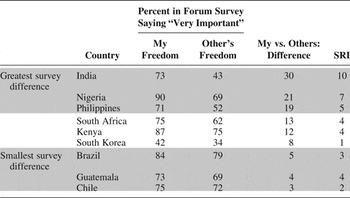
Table 4 presents data on the nine countries surveyed by the Pew Forum in 2006 for which there are corresponding SRI scores coded from State Department reports. Comparing the columns “My Freedom” with “Other's Freedom,” it is evident that a higher percentage of respondents indicated that it was “very important” to live in a country where they could practice their own religion freely than to live in a country where there is freedom of religion for religions other than their own. The important numbers to compare, however, are the differences between the percentage of respondents who indicated that their own versus other's religious freedom was very important, and the SRI scores, i.e., the last two columns of Table 4. There is a very high and statistically significant correlation between these two sets of numbers (0.867, p < 0.01, two-tailed).
Difference between my religious freedom and other's compared with SRI

Pearson r = 0.867, p < 0.01.
Table 4 rank orders countries from greatest to smallest survey difference between “my and others” religious freedom. India, Nigeria, and the Philippines all have the greatest differences between those considering their own religious freedom very important compared with others', which correspond to the highest three SRI scores. Brazil, Guatemala, and Chile have the smallest differences, and two of these three coincide with the lowest SRI scores. The two outlier cases are Guatemala and South Korea. Guatemala's SRI score of “4” means that we would expect it to be in the middle third of the scores along with South Africa and Kenya, while South Korea's SRI score of “1” should place it in the lowest three.
The South Korean case seems to represent a situation where the IRF reports under report negative social attitudes toward other religions. However, this case is unique in that percentage of respondents indicating that their religious freedom (42 percent) or others' (34 percent) was very important is far lower than in any other country. In this case, it may indicate that religious freedom is not as burning an issue in the first place. Also, of the nine countries, South Koreans generally report less religiosity on a number of measures (Pew Forum 2006). In the case of Guatemala, it appears that the IRF reports may over-report negative social attitudes toward other religions. The lower difference between “my and others” religious freedom in Guatemala may, however, be due to other unique cultural phenomena in Guatemala, such as having a high percentage of religious switching, which could be one reason for valuing freedom for other religions.Footnote 15 If so, the difference of only 4 percentage points in Guatemala may reflect the value Guatemalans place on being able to switch religious affiliations. Further inquiry into such cases would be a useful extension of this research. With two country scores out of the nine that seem out of general alignment, these results offer some further evidence that the IRF reports as measured by the SRI closely correspond to public opinion data, but also point to the potential value of comparatively looking at different countries using these very different sources of data.
Hudson Institute Center for Religious Freedom Expert Interviews
In Table 5, the SRI coded from State Department reports are compared with the SRI scores from the Hudson Institute's interview of country experts as well as with the previously discussed public opinion measures. The Hudson Institute's SRI and the SRI scores coded from State Department reports strongly and positively correlate with each other at nearly 0.8 (0.791, p < 0.01, two-tailed) across the 100 countries for which there are comparable data.
Comparison of Main Measures
***Correlation is significant at the 0.001 level (two-tailed).
**Correlation is significant at the 0.01 level (two-tailed).
N Number of countries with data to compare.
DISCUSSION
While the number of cases and the lack of globally representative coverage of the three survey measures means that we should not overstate the importance of statistically significant correlations, we do note that only slight differences can be seen in the correlations of the SRI scores with the three public opinion measures. Both the SRI coded from the State Department reports and the SRI estimated by Hudson Institute experts significantly correlate at greater than 0.8 with the “religious intolerance gap” from the Pew Forum survey and the religious-cultural negativity index from the Pew Global Attitudes survey, and the correlations of both SRI measures with the World Values Survey' tolerance question, are fairly strong and significant.
We hypothesized that, given the fact that the State Department's IRF reports are prepared by multiple experts and in-country embassy staff who draw on a variety of sources, the SRI scores coded from State Department reports should be more closely associated with public opinion data on religious intolerance than the Hudson Institute's, which is limited to a rating by a single country expert who has a less expansive purview. There is limited evidence to support this postulation. While the Hudson Institute's SRI is more strongly correlated with the World Values Survey question on the importance of tolerance (–0.522) than are the SRI scores coded from State Department reports (–0.431), the World Values Survey measure is not as directly related to religion as the measures from the Pew surveys. In support of our proposition, we note that the strength of the correlation is stronger between the SRI scores coded from State Department reports on the two measures that we believe are more directly related to religious intolerance, than is the correlation of the Hudson Institute score with the Pew measures; we note this cautiously given the given, the limited number of countries available for this analysis. The SRI scores coded from State Department reports are slightly more strongly correlated with the RCN (0.832 versus 0.806) and the religious intolerance gap (0.867 versus 0.843). With the caveat on correlations mentioned above in mind, it is nonetheless notable that the correlations are significant given the small number of cases.Footnote 16
Substantive and Methodological Implications
Returning to the research questions posed in our introduction, substantively, our analysis provides some confidence that the information on religious intolerance in the U.S. State Department's reports is generally consistent with other major data sources on this topic. Furthermore, methodologically, our analysis suggests that researchers looking into cross-national religious intolerance can rely on — and should explore — different data sources, as the three types of data presented here generally cross-validate one another and are in line with the methodological concept of data triangulation discussed earlier (Denzin Reference Denzin1970; Webb et al. Reference Webb, Campbell, Schwartz and Sechrest1966, Reference Webb, Campbell, Schwartz, Sechrest and Grove1981). Essentially, although they are generated by very different approaches, the three types of data we examined — coded qualitative data, quantitative survey data, and expert analysis — tell a similar story about religious intolerance in societies.
Specifically, we find that the attitudes coded from the State Department's annual IRF reports — as captured by Grim and Finke's five-item SRI — are comparable to relevant findings from public opinion surveys across more than 66 different countries and independent non-government expert opinion for 100 countries. The SRI coded from IRF reports has a significant negative correlation with the value placed on teaching children “tolerance” in 66 countries as measured by the World Values Survey. Moreover, the SRI coded from IRF reports has a significantly strong and positive correlation both with the “religious-cultural negativity” index in 12 countries surveyed by the Pew Global Attitudes Project (2006) and with a pair of questions on the importance of “my” versus “others” religious freedom in nine countries surveyed by the Pew Forum on Religion & Public Life. We also find good alignment between the SRI coded from IRF reports and the SRI published by the Hudson Institute's Center for Religious Freedom based on written interviews, which asked non-government country experts to independently rate more than 100 countries using the same five-item SRI.
On the one hand, these results suggest that cross-national public opinion survey data can be cross-validated using data coded from both careful systematic qualitative analyses and systematized expert opinion. This addresses concerns about survey data raised by political scientist Kurt Lang (Reference Lang2008) and others, including the importance of taking into account the potential impact of influential social forces operating beneath the “threshold of public attention” (Neuman 1990), such as advocacy groups, religious movements, and religious hierarchies. These social forces are in effect captured by the coded cross-national SRI scores.
On the other hand, our results suggest that coded qualitative data and expert opinion ratings can in turn be cross-validated or evaluated by looking at public opinion data. For example, in our analysis, we found several cases where the State Department reports seemed to either under- or over-report negative social attitudes toward religion, such as in Jordan, Guatemala, and South Korea (as discussed above). Thus, the State Department would seem to benefit from looking carefully at such survey findings.
Having made these conclusions, we must again emphasize the limitations of this article. First, qualitative analysis and expert opinion can be influenced by the results of public opinion polls, which would have the effect of inflating the correlations we found. In this article, however, the SRI scores were calculated before pertinent analysis of the Pew polls were published, and it is unlikely that the data from the World Values Survey played a significant role in the qualitative or expert analysis (at least we have not seen a report on the “tolerance” data that would have been easily available to the State Department or the Hudson Institute experts). Second, our analysis focused on a limited set of social attitudes, which, while important, are certainly not representative of all critical issues related to religion and world affairs. Third, the correlations presented in this article could be further checked by using these data for other studies that draw on statistical techniques such as hierarchical linear modeling. Fourth, conclusions cannot be drawn for data from countries where representative polling is difficult and/or where governments may suppress the free speech of their citizens. And finally, each of the data sets used has its own inherent limitation. The World Values Survey data have a sufficient number of cases but are based on a single question, which is relevant to the topic being examined but not directly on point. The Pew data are more on point, but have fewer cases. And while the Hudson Institute data are on point, they represent expert opinion, which may share some of the same biases as those who write the State Department reports. Despite these limitations, we find the combined results indicate that these various data sources consistently correlate with the coded State Department information on religious intolerance.
Our results give some indication that the IRF office of the State Department has a fairly reliable understanding of social religious intolerance around the world. Still, many commentators argue that the United States government continues to misread issues related to religion and foreign policy. Former diplomat and Georgetown University scholar, Thomas F. Farr (Reference Farr2008), suggests that diplomats and the foreign policy establishment are uncomfortable dealing with religion because of a normative value place on the separation of religion and state. He observes that, for most career diplomats, being assigned to the IRF office is seen as a dead-end assignment. A recent study on the United States government's engagement with religion in conflict-prone settings conducted by the Center for Strategic and International Studies similarly concluded that international religious freedom has not been prioritized. Structurally, religious freedom issues are not mainstreamed and have minimal influence on diplomatic matters (Danan et al. Reference Danan, Hunt, Barton and von Hippel2007, 47).
It is beyond the scope of this article to suggest foreign policy solutions, but we can suggest without hesitation the value of comparing survey data with other relevant sources of data. Public opinion researchers have long argued for the need to reach out “for new kinds of information about the topic under study” (Riley Reference Riley1962, 320), giving attention to other sources and levels of data (Bahr, Caplow and Chadwick Reference Bahr, Caplow and Chadwick1983) that are available, rather than merely going from one poll to the next. Our research suggests that the cross-validation we demonstrated can also be cross-fertilization, where different methodologies are used not only to check one another but also to learn from each other.
APPENDIX A
Descriptive Statistics of SRI Items
APPENDIX B
2006 Pew Global Attitudes Confirmatory Factor Analysis (Survey Data)
Using the full survey dataset (N = 13,029 cases from the 12 countries used in our analysis), we ran the analysis shown in Figure 3. The results of this factor analysis are presented in Figure 2. All seven questions load onto the factor at 0.58 or stronger and the amount of variance (R-square) in each of the variables that is explained by the common factor is 0.34 or higher. The fit statistics are good. The RMSEA statistic of 0.049 can be interpreted to mean that this model is 95.1% away from the worst-fitting model. The other fit statistics are also very strong (NFI = 0.984 and TLI = 0.952). The 0.000 p-value associated with the chi-square statistic, should be ignored in this model since chi-square is sample-size dependent and is not accurate for large sample tests.
Confirmatory Factor Analysis of Characteristics Battery (using survey data).