I. INTRODUCTION
Microelectromechanical systems (MEMS) cover a broad base of systems that use techniques developed for microelectronics processing to fabricate devices with both electrical and mechanical functionality.Reference Witvrouw, Tilmans and De Wolf1 Various types of micromechanical switches have been introduced in MEMS.Reference Petersen2–Reference Hashimoto, Uenishi and Watabe4 These switches are useful in applications where temperature and radiation insensitivity, along with a high on–off impedance ratio, are desired. There is particular interest in having both a good electrical and thermal contact when the switch is closed. Almost all micromechanical switches have been designed with solid-to-solid contacts.Reference Kim, Shen, Latorre and Kim5
Micromechanical switches have traditionally suffered from problems such as contact bounce, high contact resistance, slow rise times, and a short operational lifetime due to adhesive failure, contact contamination, and mechanical wear.Reference Simon, Saffer and Kim6, Reference Chen, Lee, Guo, McGruer, Leedy and Adams7 To reduce wear and decrease adhesion, one design route is to increase the hardness of the contact material, such as recent work regarding precipitation hardening in gold (Au) contacts.Reference Bannuru, Brown, Narksitipan and Vinci8 The issue for the long-term reliability of MEMS contact switches is maintaining a high current density without the increase in contact resistance during switching. In this case, the high contact resistance is one of the main issues that impact MEMS contact switches. The contact resistance depends on the surface condition, contact area due to the applied force, and thermal conduction.Reference Hyman and Mehregany9, Reference Angus10 If the contact surface condition is clean, the resistance value is low. The contact resistance decreases with increases in applied force on the switch because the real contact area increases with force.Reference Hyman and Mehregany9 Poor thermal conduction leads to a high contact resistance because of the resistive heating produced by the current passing through the microswitch and across the contact interface.Reference Hyman and Mehregany9, Reference Machate11 Hyman and MehreganyReference Hyman and Mehregany9 and Kim et al.Reference Kim, Lee, Baek, Kwon and Kim12 have investigated the effect of the Joule heating on Au–Au contacts in a microswitching system and suggest that if the current increases in the switch, the damage of the contact surface and material transfer also increases because of welding and softening of the surrounding the contact area.Reference Hyman and Mehregany9, Reference Kim, Lee, Baek, Kwon and Kim12 Au pads also can fail because of surface roughness and high voltages that lead to softening of the contacts [Au–Au] where the Au undergoes welding due only to forces between the surfaces, even without elevated temperatures due to self-resistive heating. It has been suggested that these problems can be solved using liquid or low-melting-temperature metals because they show low contact resistance, can have a high contact area with a low applied force, and should reduce wear.Reference Simon, Saffer and Kim6
Liquid metals have been used in gaps between solid-to-solid contacts, such as a thermal switch that conducts heat from a heat source to an adjacent device.Reference Weiss, Cho, McNeil, Richards, Bahr and Richards13 Similar devices can be used for mechanical switching applications. There are several pure low-melting-point liquid metals that could be used for MEMS. A common representative liquid metal is mercury for microthermal mechanical switches because it has a good thermal conductivity and can be used in the liquid state at room temperature. However, liquid mercury has potential health and safety problems, which have led to alternative materials being considered.Reference Taylor, Rancourt and Perry14
Gallium (Ga) is a promising liquid metal above room temperature as its high boiling point (∼2400 °C) allows Ga to be used in high-current and high-temperature applications without significant evaporation. Small confined droplets of Ga have been studied on the nanoscale and shown to have mechanical responses that imply a nonzero shear modulus even when liquid.Reference Huang, Fei, Shui, Cui and Wang15 Ga, a solid at room temperature, can melt because of resistive heating. Truong calculated the energy required to melt a 20-μm-diameter Ga droplet on a platinum pad was 3.97 μJ at room temperature, and the required current to cause this for a microswitch was ∼2.3 mA.Reference Truong16 This article will focus on Ga as a material for contact switches at ambient temperatures since it is amenable to microfabrication via electrodeposition. If the Ga switch contact is exposed to oxidizing environments such as ambient air, it will be important to identify the products that may form at the use or processing temperatures. To understand the structure and performance of Ga microdroplets for switching operations, microdroplets were deposited by electroplating, and the contact behavior was investigated by characterizing the macrostructure, hardness, thermal reflow, and electrical performance in a simulated MEMS structure.
II. EXPERIMENTAL PROCEDURES
A. Fabrication
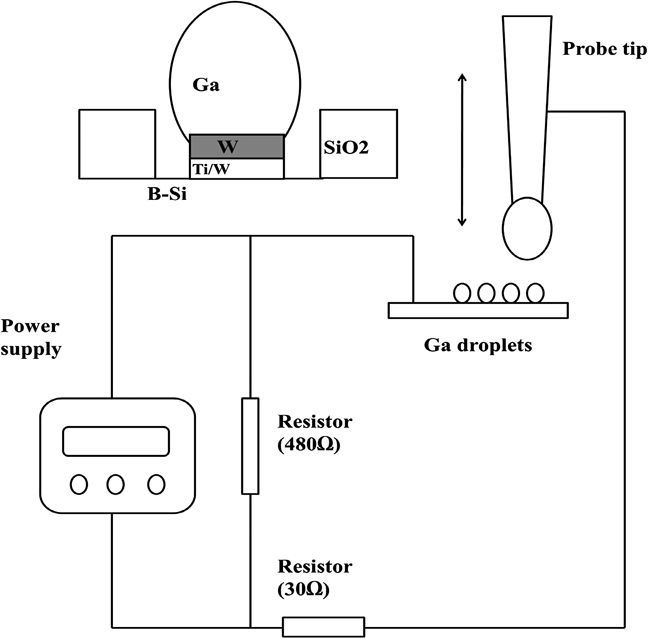
Samples were fabricated on single-side polished, 75-mm-diameter, boron(B)-doped (100) silicon (Si) wafers. Silicon dioxide (SiO2) was grown as a thin (120–180 nm) oxide layer on both sides of the wafer using wet oxidation after B doping. The oxidation layer was chemically etched in buffered oxide etch through a mask defined by conventional photolithography. A 10-nm-thick titanium/tungsten (Ti/W) layer for adhesion was direct current (DC) sputtered at 100 W on the wafer, and a 100-nm-thick W layer was then sputtered on the surface of Ti/W at 113 W. The W and Ti/W layers were photolithographically defined and then chemically etched in hydrogen peroxide to form targets for subsequent Ga plating. Each die was 14 × 7 mm2 and contained several hundred Ga droplets. The diameter of the windows patterned in SiO2 ranged from 100 to 200 μm, while the W targets ranged in diameter from 30 to 60 μm. These features are shown schematically in Fig. 1. In addition, each die had a 4 × 4 mm2 bonding pad for electrical access to the B-doped Si. The wafers were cleaned by rinsing with acetone, isopropyl alcohol, and deionized (DI) water and then diced into test samples.
Schematic of die and electrical testing setup.

B. Electroplating of Ga
Ga droplets were electroplated using an electrolyte of 2.5 M gallium chloride in DI water and hydrochloric acid (HCl). The pH of the solution was kept between 1.5 and 2.5, adjusted by adding HCl. A platinum wire and the patterned Si sample were placed in a glass beaker as a H2 evolution anode and cathode, respectively.Reference Sundararajan and Bhat17 The conditions for the most uniform deposition used a cathode current density of 1 A/cm2 and a potential between −0.6 and −0.7 V. The actual current used depended on the number of droplets on the die but was generally between 0.06 and 0.09 A. The temperature was kept constant between 40 and 50 °C by using a hotplate. Ga droplets with diameters between 50 and 100 μm deposited selectively on the W targets during electroplating, with only small amounts of Ga depositing on the B-doped Si. The size of the Ga droplets was controlled by the lateral size of the W target used for deposition; larger W targets lead to larger Ga droplets, and the range of sizes noted above directly correlates with the size of the underlying W target.
C. Thermal processing, oxidation, and mechanical testing
To analyze the oxidation of the Ga structures that may occur during operation, thermogravimetric analysis (TGA) was carried out using a Rheometrics STA 650 (Rheometrics, Twin Lakes, WI). Samples were placed in open crucibles in oxygen gas and were heated at 10 °C/min to determine if the oxide was passivating. The samples were subsequently put through a thermal reflow to further study the oxide properties. Thermal reflow tests were carried out in both ambient and argon atmospheres. The thermal reflow technique involves heating the fabricated sample with deposited Ga for times between 10 and 60 min in a temperature range of 95–110 °C either in ambient air or while argon gas flowed over the sample in a tube furnace. The surface morphology was examined in a FEI SIRON field emission scanning electron microscope (FEI, Hillsboro, OR).
The hardness of the microdroplets was measured using a Hysitron triboindenter (Hysitron, Minneapolis, MN). Both the top and the cross sections of the droplets were examined. To cross section the Ga droplets, a sample was mounted in epoxy. The sample was cut with a diamond saw, and then the side of the sample was wet ground with SiC paper (120, 600, and 1200) to expose a crosssection of the droplets. Nanoindentation of the droplets was carried out with a boron-doped Berkovich diamond tip with an effective radius of 200 nm. For a measurement of the hardness of the droplets as a function of depth, five indents were performed on a given droplet, corresponding to maximum penetration depths and loads of 140, 400, 900, 1400, and 1800 nm and 205, 480, 700, 1200, and 2000 μN, respectively. The loading and unloading time was fixed at 10 s for all indentations.
D. Electrical performance
Three different electrical test probes were used to measure the electrical performance of the contact materials: a large 2-mm-diameter probe which contacts several droplets during switching, a 15-μm-radius probe which contacts a single droplet (the probe radius is on the order of the droplet radius), and a nanoindentation probe in which the tip radius is much less than the radius of the Ga droplet. In all cases, the other electrical contact was made to a bonding pad on the die. The 15-μm-radius probe did not have the capability to monitor the applied load. In the case of the 2-mm-diameter probe, a stepper motor was used to apply a load of 0.5 N cyclically onto the Ga droplets. The schematic of the mechanical switch contact system is shown in Fig. 1. Currents using the larger probes were measured using either a Fluke 189 multimeter (for steady state measurements; Fluke, Beaverton, OR) or a digital oscilloscope (for measuring transient switching behavior) with 30 and 480 Ω resistors in parallel and series, respectively, with the switch contact (Fig. 1).
Electrical contact resistance (ECR) nanoindentation in a Hysitron triboindenter was used with a boron-doped diamond tip to monitor the resistance during the initial stages of contact between a probe and the Ga droplets. A potential of 2 V was applied during these experiments. In this case, the voltage and current were monitored using a Keithley model 2602 dual channel system SourceMeter (Keithley, Cleveland, OH). The boron tip used for ECR nanoindentation has a nominal resistivity of 3 Ω-cm.
III. RESULTS AND DISCUSSION
A. Structure, oxidation, and mechanical properties of Ga microdroplets
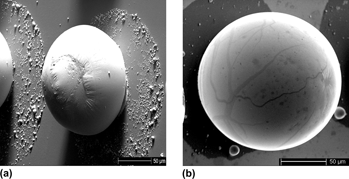
The Ga microdroplets formed from typical processing conditions described in this article are shown in Fig. 2. These particular Ga droplets were electroplated for 78 s, and then thermal reflow was carried out on the droplets at 100 °C for 10 min in ambient air. Many metals react with Ga, but W is relatively inert with Ga up to 800 °C.Reference Truong16, Reference Sheka, Chaus and Mityureva18 Chen et al.Reference Chen, Lin and Sun19 electrodeposited Ga on W wires in a similar manner as the current work and used energy dispersive spectroscopy to analyze the composition of the droplets. In those results, the droplets consisted of pure Ga.Reference Chen, Lin and Sun19 Therefore, W on Si can be used as a cathode to achieve Ga deposition and subsequent reflow without concern of a Ga–W reaction. In general, before thermal reflow, the as-deposited surfaces of Ga droplets were rough, as shown in Fig. 2(a), but after thermal reflow, the surfaces were relatively smooth, as seen in Fig. 2(b). There were small regions of Ga deposition off the W target region; these are likely due to small defects in the native SiO2 allowing ionic access to the B-doped Si. Ga droplets deposited on the W target first as a hemispherical cap, and as the droplets do not expand onto the Si surface, the resulting structure is a truncated sphere, with the base equal to the W target.
Electroplated Ga droplets on 60-μm-diameter W in a patterned 0.2-mm SiO2 window (a) before and (b) after thermal reflow in ambient air at 100 °C for 10 min. Tilt condition for both droplets is the same.

The surface of the liquid metal is highly reactive with oxygen at room temperature. Even under high-vacuum conditions, the surface can be easily and rapidly oxidized.Reference Regan, Tostmann and Pershan20 Gallium oxide (Ga2O3) has several crystalline phases, with β-Ga2O3 the most stable phase up to 1800 °C (its melting temperature).Reference Dai, Pan and Wang21, Reference Ortiz, Alonso, Andrade and Urbiola22 Shan et al.Reference Shan, Liu, Lee, Lee, Kim and Shin23 and Rotter et al.Reference Rotter, Ferretti, Mistele, Fedler, Klausing, Stemmer, Semchinova, Aderhold and Graul24 demonstrated the structure of Ga2O3 was amorphous below 500 °C, but at 700 °C the structure changed to β-Ga2O3 (the monoclinic structure). β-Ga2O3 can have a semiconducting or an insulating nature, depending on the stoichiometry between Ga and oxygen.Reference Shan, Liu, Lee, Lee, Kim and Shin23 β-Ga2O3 is an insulating material at room temperature with band gap of 4.9 eV but shows n-type semiconducting behavior at temperatures above 500 °C. Regan at al.Reference Regan, Tostmann and Pershan20 and ChabalaReference Chabala25 investigated the oxidation of liquid Ga surfaces at room temperatures and 10−6 Torr. In their research, the oxide layer was amorphous or poorly crystallized β-Ga2O3 up to 443 K. Therefore, in this study, it is assumed that the oxide phase before and after thermal reflow (100–120 °C) is amorphous or poorly crystallized. If there is a crystalline phase, it is likely β-Ga2O3, and at these temperatures, the oxide will act as an insulator.
Regan et al.Reference Regan, Tostmann and Pershan20 used surface x-ray scattering techniques to examine the oxidation of a liquid Ga surface and reported an oxide thickness of ∼5 Å at room temperature. This suggests that ambient oxidation of the Ga droplets will not be a significant issue for switching applications.
The oxide structures that form on Ga often create fractal structures of complex, branched patterns.Reference Chabala25 ChabalaReference Chabala25 used imaging secondary-ion mass spectrometry (SIMS) to analyze the lateral distribution of the oxide during growth and showed the oxide developed at random positions before spreading laterally and slowly closing gaps. The size and shape of the fractal structure does not change, and the oxide film is initially thin and then gets thicker. The SIMS image in Ref. Reference Chabala25 is similar to the surface structure of the Ga droplet as seen in Fig. 2(b), suggesting that the Ga droplet is covered with a similar Ga oxide film.
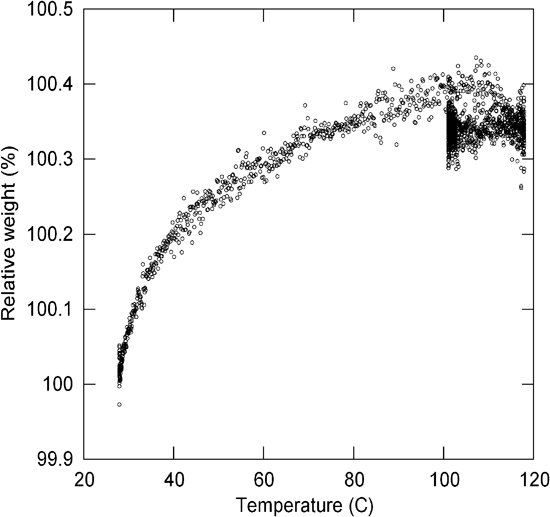
TGA was performed to examine the oxide thickness after the switch contact was annealed at elevated temperatures. TGA of an electroplated Ga sample was completed in dry oxygen. The sample was heated to 115 °C, and TGA weight gain curves showed that Ga formed a protective oxide at temperatures above ambient. Further annealing above 115 °C shows no significant weight gain (oxide growth) as seen in Fig. 3. This is similar to results from Regan et al., who observed the topmost layer of the liquid Ga surface during oxidation with x-ray absorption fine structure experiments. In that work, increases in the temperature up to 573 K made no significant change in the oxide layer thickness.Reference Regan, Tostmann and Pershan20 In Chabala’sReference Chabala25 case, the oxide growth was limited by the exposure time in fixed oxygen dosages. First, the film grew laterally; next, the film became thicker. The TGA analysis presented in this study supports the idea of a passivating oxide on Ga.
Thermogravimetric analysis of a typical Ga droplet in oxygen. The sample exhibits an initial weight loss and then a subsequent weight gain which plateaus, indicating a passive oxide film has formed.

Using the total volume of the Ga droplets and the weight gain from the TGA as an upper bound estimate, the oxide thickness after annealing in oxygen is 30 nm. For this estimate, we assume no additional oxidation of Si, as this temperature is significantly below the original temperature used for oxidation of Si (900 °C). A thin oxide supported on a compliant substrate suggests that pressures in excess of those needed to cause permanent deformation of the substrate would cause fracture of the passivation layer and make electrical contact in this system. Evidence of oxide growth is present in the surface structure of the reflowed structures. Figure 4 shows the surface structure of an oxidized droplet after thermal reflow at 75 °C and one annealed in argon (Ar) for a similar time and temperature profile. The changes in droplet shape toward a more spherical surface during thermal reflow suggest that new regions of the surface are exposed to atmosphere during this process, and may lead to nonuniform oxide growth as shown in Fig. 4(b).
Surface structure of Ga microdroplet annealed in (a) argon and (b) oxygen at 75 °C.

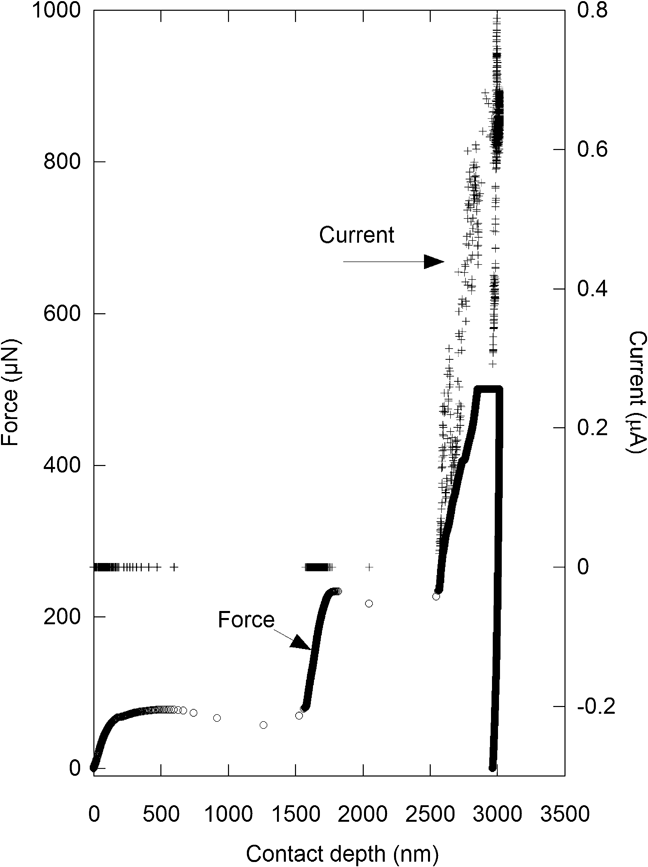
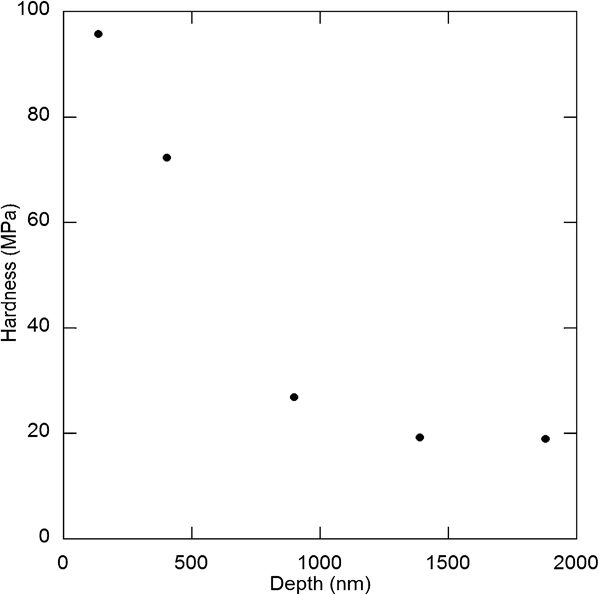
Figure 5 shows a typical load–displacement curve of an ECR nanoindentation experiment onto a Ga droplet. Several features in the curve are worth noting. First, the indentation begins to show atypical indentation behavior (the load does not increase as depth increases) at a depth of ∼60 nm. This, in conjunction with the rapid increase in depth, is indicative of a fractured surface oxide. After a second film fracture event at a load of 235 μN, the material appears to follow a more conventional load–depth pattern, as well as registering large increases in the current as the contact depth continues to increase. This suggests that at this point the tip is primarily in contact with metallic Ga. An analysis of the unloading slope from multiple indentations was performed using the Oliver–Pharr methodReference Oliver and Pharr26; the modulus of the Ga droplet was between 1.25 and 2 GPa, and the average hardness was on the order of 2 MPa. However, as the droplet is somewhat unconstrained (i.e., material can flow laterally), these are likely lower bound estimates of the modulus and hardness. To determine an upper bound, indentations were made on cross sections of the reflowed Ga droplets to measure hardness as a function of depth, as shown in Fig. 6. The hardness of the cross-sectioned Ga droplets is between 20 and 95 MPa when the droplet is constrained by a surrounding medium (in this case the mounting epoxy). The hardness of the surrounding epoxy was between 200 and 300 MPa, so the droplets are constrained by a harder medium.
Load (○) and current (+) as a function of contact depth during nanoindentation of a thermally reflowed Ga microdroplet at room temperature.

The hardness of cross section of Ga droplets as function of depth.

The load, P, required to cause plastic deformation under a spherical contact (with the assumption of an elastic, perfectly plastic material with a yield strength σ y made for this first-order estimate) is

where r is the reduced radius (1/R 1 + 1/R 2)−1 and E is elastic modulus of Ga, assuming that the probe is significantly stiffer than the droplet.Reference Meyers and Chawla27 The radius of a typical Ga droplet is 50 μm, and the elastic modulus of the Ga is ∼1.5 GPa from nanoindentation testing. The yield stress of the reflowed Ga droplet was 0.6 MPa assuming the classical Tabor relationship for hardness and yield strength. For electrical testing using the 15-μm-radius and 2-mm-diameter probes, the lower bound estimate of plastic deformation is approximately 2 and 30 nN, respectively. Even the highest hardness measured (95 MPa) on a constrained droplet would still lead to deformation occurring at submicro-Newton loads. The purpose of this first-order estimate is only to demonstrate the likelihood of plastic deformation occurring during any of the electrical switching processes described in the next section.
B. Electrical performance of Ga microswitch contacts
The electrical properties of the reflowed Ga droplets were measured by ECR testing. The resistance values with and without Ga on the W pad were measured to determine the resistivity of the Ga droplets. The resistance with and without Ga was 4.83 × 10⁵ Ω at 500 μN and 4.77 × 10⁵ Ω at 2.8 × 10³ μN, respectively; therefore, the resistance of the Ga contact and the contact resistance between the droplet and the tip was 6000 Ω. In this case, the interfacial resistance between the Ga droplet and the boron-doped diamond tip needs to be considered. An ECR between two materials with resistivity ρ 1 and ρ 2 is shown by TimsitReference Timsit28 as

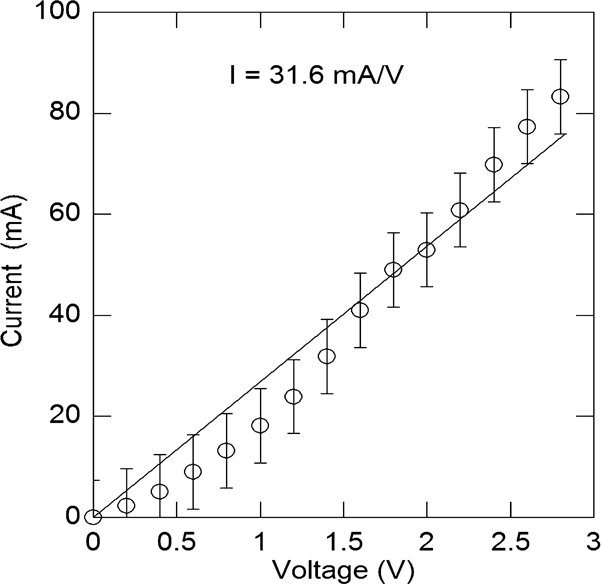
where a is the constriction radius. Assuming that the resistivity of the boron-doped diamond tip (ρ d) and the bulk resistivity of Ga (ρ Ga) are 3 Ω-cm and 1.5 × 10⁻⁵ Ω-cm,Reference Askeland29 respectively, and from the area function of the tip, a is 1.2 × 10⁻⁴ cm, the resulting ECR value would be 6250 Ω. This value is almost same as the measured resistance of the Ga droplet shown above. Therefore, the electrical resistance of the electroplated Ga appears to be well described by bulk properties. A tungsten tip, which has a relatively low resistivity of 5 × 10⁻⁶ Ω-cm, was used to eliminate the effect of interfacial resistance by material of the contact tip. Figure 7 shows the average and standard deviation of 10 tests for the resistance of Ga droplets with the 15-μm W probe that did not cause significant plastic deformation in the droplet (i.e., no residual impression was visible using optical microscopy). However, given the loads estimated for plasticity in these samples, it is likely some plastic deformation occurs during these contacts, which may lead to nonuniform resistances between the tests. The total conductance is 31.5 mA/V. Uncertainty for the voltage measurement of 2.8 V across the Ga droplet is ±0.07 V, and uncertainty for the typical current of 0.083 A is ±0.013 A. The mean and uncertainty using the root sum of squares methodReference Wheeler and Ganji30 of the total resistance was 31.8 ± 0.5 Ω, much lower than the 6000 Ω observed when using the ECR test.
Measured current–voltage plot of deposited Ga droplets to determine resistivity.

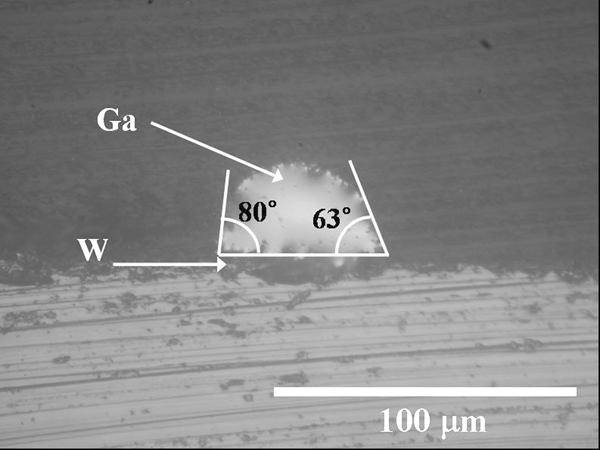
The interfacial electrical resistance between the Ga droplet and the underlying W target for electroplating Ga also needs to be considered. In a solid-to-solid contact, all solid surfaces are usually rough on the microscale, so the true contact area is a small fraction of nominal contact area. ECR at a solid–liquid interface is minimized because the true contact area is maximized as the liquid can cover the surface asperities of a solid.Reference Timsit28 This also indicates that if contact wetting between the contact surfaces is improved, the interfacial resistance decreases.Reference Yazdanpanah, Chakraborty, Harfenist, Cohn and Alphenaar31 The contact angle of the droplet before it grew larger than the diameter of the target, as seen in cross section in Fig. 8, is less than 90° between the Ga droplet and the W, typical for a wetting condition. This suggests that the interfacial area between Ga and W is maximized, which will minimize the resistance at this interface.
Contact angle of the cross section of the Ga droplet.

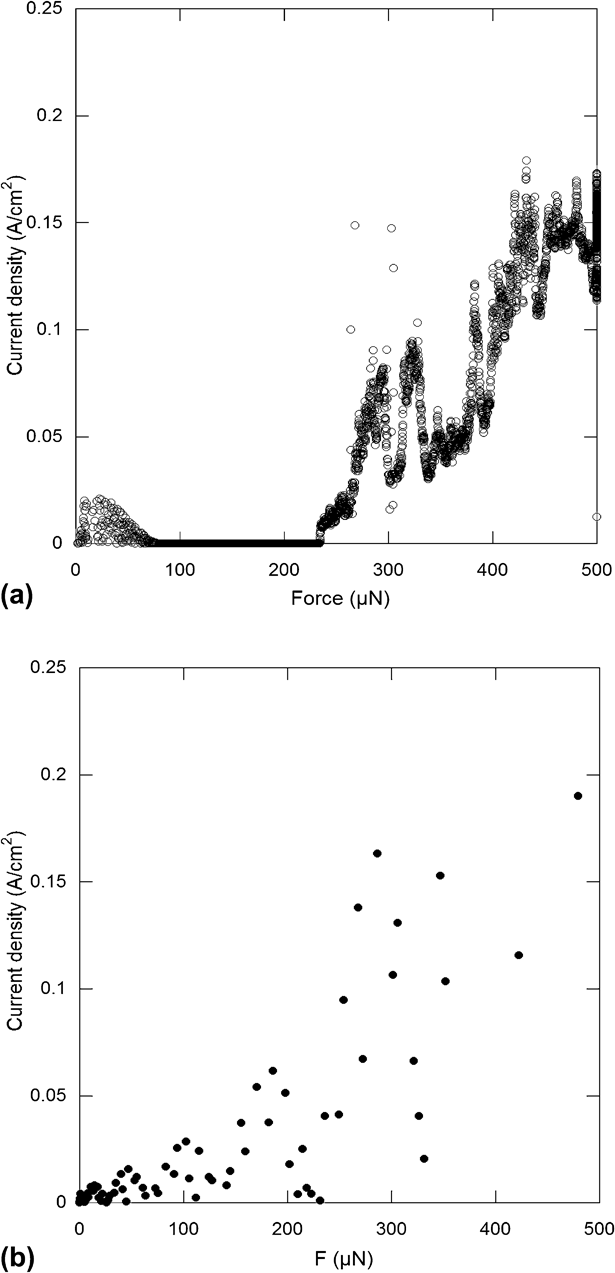
The ECR decreases as the contact load increases because the actual contact area is increased. ECR nanoindentation testing was used to study the effect of force on the interfacial electrical resistance between the diamond tip, a Ga droplet, and an isolated W target. During ECR testing, the nominal area of contact can be determined directly from the area function calibration for the tip, and so it is possible to estimate the current density at any point in the test. Figure 9 shows the current density when in contact with Ga droplet and a W film as a function of force, assuming that the depth of the indentation is equal to the contact depth and resulting area of contact from the calibrated nanoindenter tip. This will slightly overestimate the area, therefore underestimating the actual current density. The current density with and without Ga on a W pad at 500 μN with a 2 V applied voltage was approximately 0.175 and 0.182 A/cm2, respectively.
The current density and force curve comparing the results of (a) Ga and (b) W.

The load–depth curve of ECR testing of Ga droplets after thermal reflow showed that as the force increased, the current density also increased except for the force range of 70 to 220 μN [Fig. 9(a)]. This decrease in current density may be due to contamination on the surface of the Ga droplet. If low mechanical and electrical loads are applied, surface contaminants are not removed in solid contacts.Reference Dickrell and Dugger32, Reference Neufeld and Rieder33 There are three likely contaminations in these experiments: dust particles, oxides on the surface, and carbon deposits from arc pyrolysis of adsorbed organic vapor.Reference Neufeld and Rieder33 The sudden drop of the current density could be caused by contaminants from the oxide layer. In the case of a growing oxide layer, the resistance increases as the contact area becomes covered by oxide layers (particularly at the edge of the contact where new material may be exposed to the atmosphere). The resistance can be reduced by displacement of the contact spot (i.e., moving away from the newly grown oxide) or mechanical damage that erodes or fractures the initial layer.Reference Neufeld and Rieder33 Therefore, it suggests that the ECR indenter breaks the oxide layer covered on the surface at first and makes contact with Ga, but the resistance increases by the remaining oxide particles surrounding the break. As the load increases, the contact area either melts (because the melting point of Ga is decreased with the increase in the pressure)Reference Sheka, Chaus and Mityureva18 with increase in resistance leading to Joule heating or deforms plastically and causes the oxide particles to sink or be pressed into the Ga so that the resistance decreases again.
The resistive heating and temperature rise can be calculated from Joule’s law,Reference Truong16, Reference Kasap34

where I is the current, R is the resistance, t is the applied test time, m is the mass of the material, C is the specific heat capacity, and ΔT is the temperature differential. The measured electrical response of the electroplated Ga droplet in contact with different tips was well described by the bulk properties as shown earlier; therefore, the resistance of the Ga droplet alone, neglecting contact resistance, is 0.01 Ω. The specific heat capacity and mass of the Ga droplet are 371 J/kgKReference Breteque35 and 9.3 × 10⁻⁶ g, respectively, leading to an expected temperature rise of 6.9 K for I of 0.08 A and test times of 1 s. The electronic test was performed at room temperature (300 K), so the contacted area of the droplet with the tip could melt within 1 s. For longer time tests (1 min), it is likely the thermal conductivity of the Si substrate will minimize additional heating of the Ga.
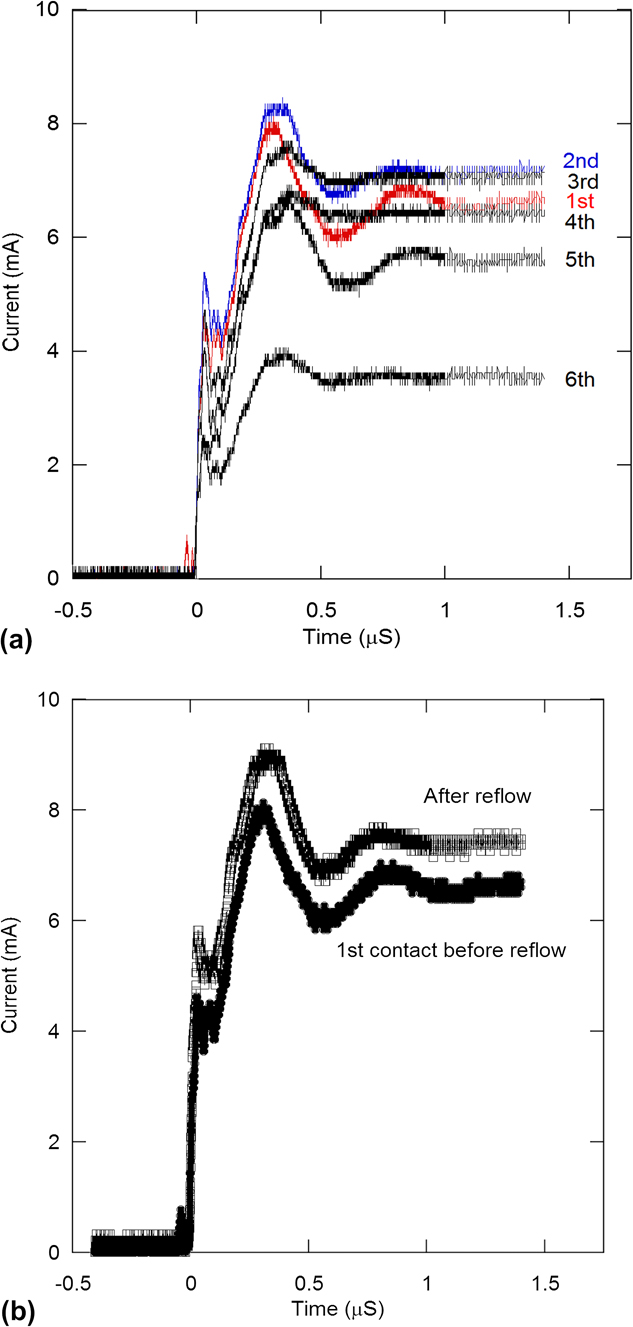
Figure 10 shows the typical electrical performance of the Ga droplet switch contact at a constant voltage (3 V DC) as a function of time with a W tip (with a radius on the order of the Ga droplet radius). Tests on multiple droplets show that upon repeated switching, the second contact always exhibited a lower resistance contact, but the steady-state resistance increases with the third and subsequent contacts, as noted in Fig. 10(a). One likely mechanism for this would be that the first contact causes some minor damage and flattens the contact surface (leading to a larger contact area), while subsequent contacts degrade with switching because of plastic deformation and subsurface defect generation. Subsequent thermal reflow [Fig. 10(b)] “heals” the switch contact back to the initial performance level, suggesting that damage to the switch contact is removed during reflow. Figure 10 shows a “voltage plateau” at 0.1 μs. This phenomenon typically indicates carbon contamination in the area surrounding a contact spot. The contact resistance continuously increases with increases in contact cycles; thus, the “voltage plateau” also decreases with increasing contact cycles, as shown in Fig. 10. When the contact spot is cleaned by the arc discharge or movement of the contacts, the rise in the current occurs again.Reference Neufeld and Rieder36, Reference Slade and Taylor37 It is possible that this could be due to additional oxidation in the area around the droplet as new material is exposed to the atmosphere, and additional testing in a controlled environment would be needed to verify which of the contaminants would be most responsible for this behavior.
The mechanical switching behavior of a Ga droplet at a constant voltage (3 V DC). (a) First series of electrical switch contact and (b) Electrical switch contact after thermal reflow at 120 C.

Images of a Ga droplet after switching for six cycles and the same droplet after a thermal reflow at 120 °C in ambient air are shown in Fig. 11. After electrical performance testing, there is clearly a region of plastic deformation on the top of the Ga droplet. However, after a 120 °C, 10-min thermal reflow, the Ga droplet in the switch contact recovers its initial shape and structure, and the switch performance is equivalent to that of the initial condition. Even though the Ga droplets can suffer damage during mechanical switching, the defects can be repaired by a moderate thermal reflow while maintaining the basic shape of the device.
Scanning electron microscope images of the defects formed on a Ga droplet which has operated as a switch (a) before and (b) after thermal reflow. The initial droplet was similar in structure to that in Fig. 2(a).

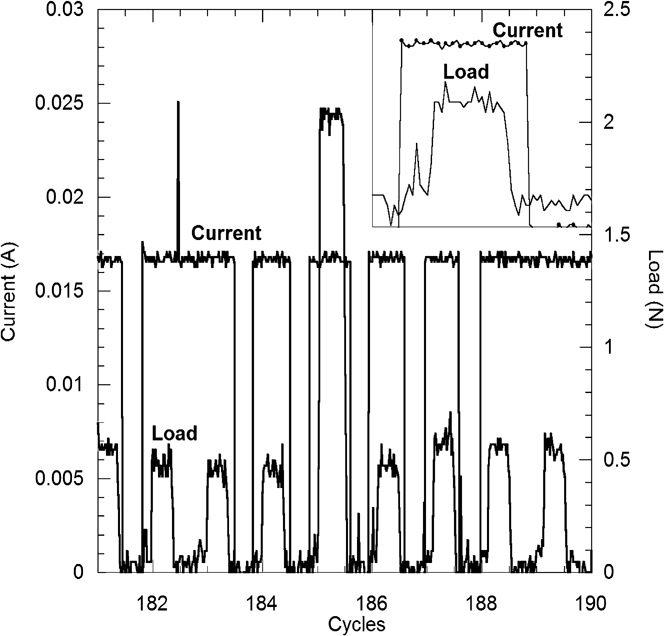
As repeated contact between the W probe and one Ga droplet during switching led to degradation in properties because of plastic deformation, longer term and larger area contacts were used to measure the contact behavior under high-current conditions. Mechanical switching was carried out at 0.5 V DC between an aluminum sphere with a radius of ∼2 mm and the Ga droplets. The contact was cycled at 0.4 Hz in depth control (with a stroke of ∼50 μm) to apply a nominal load of 0.5 N (large enough to cause plastic deformation on the first cycle), and the applied load and current through the switch contact were monitored as a function of cycle number. This magnitude of contact leads to approximately four Ga droplets coming into contact with the probe tip and a total effective contact area of ∼50 μm in radius. The resulting current density of the switch contact for this test was ∼200 A/cm2 at an applied contact pressure of ∼60 MPa. This pressure is similar to the hardness of the constrained droplets and may be a result of the large displacement leading to a more constrained condition (i.e., the drop is constrained between the substrate and the tip) than with the nanoscale contacts during ECR testing. As the contact is made using depth control, we expect no subsequent deformation after the first cycle. For the first 182 cycles, each cycle produced an open and close cycle. At cycle 182, the switch contact remained closed while the load was removed, suggesting that material had transferred to the aluminum contact and fibers of Ga were bridging the gap. Figure 12 shows the load and current during switching at cycle 182. The maximum load increased at cycle 185 (Fig. 12) because of the nonconductive contamination as mentioned above. According to Dickrell and Dugger,Reference Dickrell and Dugger32 a nonconductive contamination layer develops with repeated contact during long-term switching. They implied that the contamination layer was breached by the added force. This suggests that an increase in the maximum load in this switching system occurs to make contact through the contamination developed on the surface of the Ga droplets. The inset in Fig. 12 shows the switch contact turns on when the load begins to increase and remains on while the load decreases. In case of the solid-to-solid contacts, this phenomenon is just exhibited when the contact surface has a clean and flat surface. However, with continued cycling, the device does not remain closed but regains its ability to act as a switch. The resistance of the entire switching system at the initial switching cycle (partially contacting four droplets) was 73 Ω, while after 300 cycles, the resistance was 74 Ω. After thermal reflow, the resistance decreased to 67 Ω. Therefore, the thermal reflow again lowers the contact resistance by removing defects and damage caused by the imposition of plastic deformation. The higher resistance is likely due to the use of an Al contact for this test as compared to the W contact in the individual droplet tests.
Cyclic mechanical switching at 0.5 V using Ga switch contact in contact with aluminum sphere at a nominal contact load of 0.5 N. Inset shows cycle 186.

IV. CONCLUSIONS
The suitability of a Ga microdroplet for use as a “healable” MEMS switch contact was investigated by characterizing the structure, hardness, and electrical performance of the system. The initial surface shape of electroplated Ga was rough, but the surface smoothed and became mostly spherical after a thermal reflow process. Oxidation of the Ga droplets was minimal at ambient conditions, and moderate thermal reflow temperatures, on the order of 100 °C, caused no more than 30 nm of oxide growth, which grew in a generally passivating manner. The Ga droplet resistivity was similar to that of bulk Ga, and the strength of the plated Ga droplet is on the order of 2 MPa. When the Ga droplet is used for a switching system, interfacial electrical resistance between the Ga and the contact tip should be considered. When the droplets were repeatedly used as a mechanical switch contact with single-point contacts, the total resistance approximately doubled after six cycles because of deformation and the formation of defects from contact between the probe and the Ga droplet. A thermal reflow at 120 °C restored the resistance to the initial value. Larger contacts could be run for over 100 cycles with no significant increase in resistance. Electroplated Ga microdroplets have potential for carrying high current density (up to 200 A/cm2 has been demonstrated here) while switching using mechanical contact, and the damage that may occur during switching can be eliminated with a moderate thermal reflow process that does not lead to an oxide film that significantly degrades the switching performance.
ACKNOWLEDGMENTS
The authors thank Dr. L. Scudiero of WSU’s Chemistry Department for assistance in performing the Auger analysis of the Ga droplets, Ms. Anqi Qiu for nanoindentation assistance, and Dr. Sean Hearn of Sandia National Laboratories for helpful discussions through the Center for Integrated Nanotechnologies (CINT) User program. We also thank the WSU’s Composite Materials and Engineering Center for the use of the TGA. Partial support of this work was provided by the National Science Foundation under grant DMR 0907378.