Aggressive behavior (AB) is an intentional physical or verbal act that aims to cause damage to someone or something (Bushman & Anderson, Reference Bushman and Anderson2001). When intense and persistent, this disruptive behavior can lead to important psychosocial losses both for the victims and for the aggressors (Babcock, Tharp, Sharp, Heppner, & Stanford, Reference Babcock, Tharp, Sharp, Heppner and Stanford2014; Dodge & Coie, Reference Dodge and Coie1987). Reactive Aggression (RA; a.k.a. impulsive or “hot-blooded”) and Proactive Aggression (PA; a.k.a. instrumental or “cold-blooded”) are considered the two main broad dimensions of AB (Dodge, Reference Dodge, Pepler and Rubin1991; Hubbard, McAuliffe, Morrow, & Romano, Reference Hubbard, McAuliffe, Morrow and Romano2010; Vitaro & Brendgen, Reference Vitaro, Brendgen, Bliesener, Beelmann and Stemmler2012; Vitaro, Brendgen, & Tremblay, Reference Vitaro, Brendgen and Tremblay2002). RA occurs when, in response to provocation or frustration, one reacts impulsively and aggressively (Crick & Dodge, Reference Crick and Dodge1996; Dodge & Coie, Reference Dodge and Coie1987). This reaction may, for example, be instigated by jealousy or by the frustration arising out of a refused request, in which case someone might engage in verbal acts of aggression toward another person. PA, on the other hand, takes place when a person causes someone else physical or relational pain to obtain a secondary reward. For example, an individual might behave proactively aggressive when highly motivated to win a match during a competition (Crick & Dodge, Reference Crick and Dodge1996; Dodge & Coie, Reference Dodge and Coie1987). The present study aims to assess the dimensionality and latent profiles that emerged based on new two-self report measures of proactive and reactive aggressive behaviors, specifically the Peer Aggressive Behavior Scale (PAB-S) and the Peer Aggressive and Reactive Behavior Questionnaire (PARB-Q).
Many classifications of human aggression exist (e.g., “overt” versus “covert”, see Frick et al., Reference Frick, Lahey, Loeber, Tannenbaum, van Horn, Christ and Hanson1993; “social” versus “physical”; see Burt, Donnellan, & Tackett, Reference Burt, Donnellan and Tackett2012). Nevertheless, the Reactive-Instrumental duality represents one of the most popular classifications across studies (Babcock et al., Reference Babcock, Tharp, Sharp, Heppner and Stanford2014). One theoretical distinction between RA and PA is that differing underlying cognitive processes might be involved in each case (Dodge, Reference Dodge, Pepler and Rubin1991; Hubbard et al., Reference Hubbard, McAuliffe, Morrow and Romano2010; Vitaro, Brendgen, & Tremblay, Reference Vitaro, Brendgen and Tremblay2002; Vitaro & Brendgen, Reference Vitaro, Brendgen, Bliesener, Beelmann and Stemmler2012). Whereas, RA implies a likely deficit or bias (e.g., hostile attributional bias) in the first stages of the processing of social cues; while PA is theorized to result from deficits in the later stages (Dodge, Reference Dodge, Mikulincer and Shaver2011). For example, a frustrated individual can exhibit RA because of a distorted interpretation of ambiguous social events as being threatening, such as inadequately seeing someone else as a mate competitor. In turn, PA can arise from the failure to inhibit goal-directed behavior (i.e., deficits in passive avoidance learning), as is the case when someone interprets social situations correctly, but fails to control their urges to achieve goals, results in other individuals being emotionally or physically hurt.
The two aggression dimensions appear to possess specific correlation patterns to external variables. Although both RA and PA are associated with low conscientiousness and high psychopathy, they differ to the extent that, RA involves lower social skills, more social anxiety, emotion dysregulation, neuroticism, hostility and negative emotionality; while PA implies more externalizing problems, poor peer relationships, lower agreeableness and lack or premeditation (Babcock, et al., Reference Babcock, Tharp, Sharp, Heppner and Stanford2014; Poland, Monks, & Tsermentseli, Reference Poland, Monks and Tsermentseli2016; Raine et al., Reference Raine, Dodge, Loeber, Gatzke-Kopp, Lynam, Reynolds and Liu2006). Among youths, PA is uniquely associated with a lower resting heart rate, while RA tends to be predicted by a combination of low heart rate and social adversities (Raine, Fung, Portnoy, Choy, & Spring, Reference Raine, Fung, Portnoy, Choy and Spring2014). Moreover, while striatum size associates positively with both RA and PA in adolescents (Yang, Joshi, Jahanshad, Thompson, & Baker, Reference Yang, Joshi, Jahanshad, Thompson and Baker2017), RA is uniquely linked to orbital-frontal dysfunction, while PA is more associated with amygdala dysfunction across ages (Blair, Reference Blair2004). Moreover, aggression subtypes are useful in differentiating dimensions of other social-emotion/cognitive regulation characteristics. For instance, RA-PA dimensions help distinguish the psychopathy variants called “primary” (low empathy, high interpersonal exploitation) and “secondary” (high impulsivity) (Falkenbach, Poythress, & Creevy, Reference Falkenbach, Poythress and Creevy2008). Whereas primary is more strongly associated to PA (or mixed aggression), secondary psychopathy tends to be uniquely associated to RA. Among children with conduct problems, the presence of the primary features of psychopathy leads to more PA relative to other youths with conduct problems, and to RA even under low provocation situations (Helseth, Waschbusch, King, & Willoughby, Reference Helseth, Waschbusch, King and Willoughby2015).
Alternative conceptions of PA-RA also exist. Recently, Smeets et al. (Reference Smeets, Oostermeijer, Lappenschaar, Cohn, van der Meer, Popma and Buitelaar2017) proposed three forms of aggression: Proactive aggression, reactive aggression due to internal frustration and reactive aggression due to external provocation. Despite still not consensual and predominant in the literature, this dual-perspective of RA is worthy of attention in future research. If the separation between these two types of reactive manifestations truly exists, then one should be able to find many latent classes as well reflecting combinations of (PA × RA due to internal frustration × RA due to provocation) scores on each one of the three aggression factors. However, based on the findings here reported, the independence of these three putative factors is quite unlikely, and it would require a latent class study with a very large sample size.
In regards to the dual model of aggression (PA and RA), which is, up to date, the most acceptable structure, factor analytic investigations have also found two correlated factors as underlying several self-report scales of aggressive behaviors. Dodge and Coie (Reference Dodge and Coie1987) conducted one of the first investigations of this kind. To this end, the authors developed a teacher-report scale (Dodge & Coie, Reference Dodge and Coie1987) composed by three items to evaluate PA and three items to evaluate RA. An exploratory factor analysis separated both item sets as loading primarily on two distinct factors. Since then, many other instruments of aggressive behavior have been proposed, and researchers have repeatedly found RA and PA as being separate factors in exploratory and confirmatory models (Little, Henrich, Jones, & Hawley, Reference Little, Brauner, Jones, Nock and Hawley2003; Marsee & Frick, Reference Marsee and Frick2007; Raine et al., Reference Raine, Dodge, Loeber, Gatzke-Kopp, Lynam, Reynolds and Liu2006; Rieffe et al., Reference Rieffe, Broekhof, Kouwenberg, Faber, Tsutsui and Güroğlu2016). For example, the two-factor structure of the Reactive–Proactive Aggression Questionnaire (RPQ; Raine et al., Reference Raine, Dodge, Loeber, Gatzke-Kopp, Lynam, Reynolds and Liu2006) has been widely replicated in cultures as diverse as China (Li & Fung, Reference Li and Fung2015), Italy (Fossati et al., Reference Fossati, Raine, Borroni, Bizzozero, Volpi, Santalucia and Maffei2009), Netherlands (Cima, Raine, Meesters, & Popma, 2013), Portugal (Pechorro, Ray, Raine, Maroco, & Gonçalves, Reference Pechorro, Ray, Raine, Maroco and Gonçalves2017) and Turkey (Cenkseven-Onder, Avci, & Colakkadıoglu, Reference Cenkseven-Onder, Avci and Colakkadıoglu2016). Joint factor analyses of several aggression and antisocial inventories also tend to result in two RA and PA factors (Walters, Reference Walters2008, Reference Walters2009), such as can be found in a series of other measures such as the Reactive-Proactive Aggression Questionnaire (Raine et al., Reference Raine, Dodge, Loeber, Gatzke-Kopp, Lynam, Reynolds and Liu2006), the Children’s Scale of Hostility and Aggression (C-SHARP; Farmer & Aman, Reference Farmer and Aman2010) and Parent-Rating Scale Reactive and Proactive Aggression (PRPA; Kempes, Matthys, Maassen, van Goozen, & van Engeland, Reference Kempes, Matthys, Maassen, van Goozen and van Engeland2006).
Based all these findings, one can arrive at the conclusion that aggression dimensions are indeed independent phenomena with distinct nomothetic networks. Nevertheless, very often RA and PA emerge as highly correlated factors in the available self-report inventories (Card & Little, Reference Card and Little2006; Little, Brauner, Jones, Nock, & Hawley, Reference Little, Brauner, Jones, Nock and Hawley2003). In the study by Dodge and Coie (Reference Dodge and Coie1987), for instance, the two extracted factors were correlated at r = .76, while the second extracted factor yielded an eigenvalue below the conventional cutoff of 1.0. This situation has been extensively replicated across different samples and instruments developed for the same intent (e.g., Dodge & Coie, Reference Dodge and Coie1987; Poulin & Boivin, Reference Poulin and Boivin2000; Price & Dodge, Reference Price and Dodge1989; Rieffe, Reference Rieffe, Broekhof, Kouwenberg, Faber, Tsutsui and Güroğlu2016). Accordingly, the large communality between these two extracted factors raises questions about their independence, to the extent that the distinction between PA and RA as separate constructs is not consensual. Overly aggressive children and adolescents are not the only populations to display both kinds of behaviors (Brugman et al., Reference Brugman, Lobbestael, Arntz, Cima, Schuhmann, Dambacher and Sack2014; Hubbard et al., Reference Hubbard, McAuliffe, Morrow and Romano2010), however aggressive behaviors in real life might contain components from both RA and PA, so that their conceptual and empirical boundaries are rather blurred (Bushman & Anderson, Reference Bushman and Anderson2001).
One possibility is that, besides specific RA and PA factors, a general factor of aggression exists that accounts for the common variance shared by aggression indicators. Twin studies, for instance, have suggested the existence of a general antisocial factor that is highly heritable (Baker, Jacobson, Raine, Lozano, & Bezdjian, Reference Baker, Jacobson, Raine, Lozano and Bezdjian2007), for which RA and PA phenotypes have more genetic causes in common than that which sets them apart (Paquin, Lacourse, Brendgen, & Bouvin, Reference Paquin, Lacourse, Brendgen and Bouvin2014). Moreover, RA and PA seem to share certain developmental causes (sensation seeking, risk taking and moral reasoning deficits) at least from mid-childhood into early adolescence (Cui, Colasante, Malti, Ribeaud, & Eisner, Reference Cui, Colasante, Malti, Ribeaud and Eisner2016). Moreover, findings from one study support interpretations consistent with both a general factor of aggression and an RA-PA separation. More specifically, when using residualized scores of RA and PA (i.e., after controlling for common variance between factors), Raine et al. (Reference Raine, Dodge, Loeber, Gatzke-Kopp, Lynam, Reynolds and Liu2006) found that the two factors presented different patterns of associations with external variables. However, the effect-size of these associations were very low, showing that the reminiscent variance had low explanatory power. Albeit not tested in the study (Raine et al., Reference Raine, Dodge, Loeber, Gatzke-Kopp, Lynam, Reynolds and Liu2006), these results lead one to argue to the existence of a bi-factor model. In a bi-factor model, each item of an inventory is explained by a general factor, along with additional specific factors (e.g., PA and RA) that are uncorrelated with the general factor (Reise, Moore, & Haviland, Reference Reise, Moore and Haviland2010). Accordingly, a bi-factor approach allows researchers assesses two distinct types of variance shared by indicators, i.e. variance that is common to all items and variance that is unique to item clusters. The advantage of this modeling strategy is that one can combine uni- and multi-dimensional models in the same analysis and estimate the relative contribution of each factor—general versus specific—when explaining item variance. For instance, if factor loadings on the general factor are large, while factor loadings on specific factors are relatively small, this might count as evidence of unidimensionality (Reise et al., Reference Reise, Moore and Haviland2010). To the best of our knowledge, not a single study has assessed the dimensionality of AB via bi-factor models, which is a clear limitation in the field.
Another way to address dimensionality issues is via latent class or latent profile analysis (LPA). In recent studies, these techniques, which were primarily designed to uncover latent groups of persons, have been used for investigating the expression of RA and PA as independent phenotypic tendencies. The assumption of the independence between RA and PA entails that one should be able to find groups of individuals possessing only one of these behavior patterns (Smeets et al., Reference Smeets, Oostermeijer, Lappenschaar, Cohn, van der Meer, Popma and Buitelaar2017). Nevertheless, investigations conducted so far using this approach yielded results that question the existence of “pure” reactive or proactive types or latent classes (e.g., Cui et al., Reference Cui, Colasante, Malti, Ribeaud and Eisner2016; Smeets et al., Reference Smeets, Oostermeijer, Lappenschaar, Cohn, van der Meer, Popma and Buitelaar2017). More specifically, Cui et al. (Reference Cui, Colasante, Malti, Ribeaud and Eisner2016) conducted a 5-year longitudinal study and found, in a sample of 1576 school-aged children, that, in general, the PA and RA trajectories tended to follow a similar decreasing pattern over time. For a specific group of increasing AB children, both PA and RA also tended to increase in a similar fashion (Cui et al., Reference Cui, Colasante, Malti, Ribeaud and Eisner2016). Smeets et al. (Reference Smeets, Oostermeijer, Lappenschaar, Cohn, van der Meer, Popma and Buitelaar2017), in turn, found similarity in the external correlation patterns of PA and RA dimensions, and they could not find classes of individuals who presented only PA but not RA or vice-versa. Given the theoretical independence between these aggression dimensions, one would expect latent class studies with large sample sizes to report at least one or a few classes of “purely” instrumental or reactive aggressors. The question of why no study was able to find classes of individuals with only one type of aggression (PA or RA only) in either a clinical and non-clinical sample is still unanswered. Rather, the relative interdependence between aggression factors across studies might support the interpretation of the existence of a general factor of aggression.
In the present study, we conducted a set of CFAs as well as LPAs to assess the dimensionality of the AB construct. To this end, a set of concurrent models were tested via confirmatory factor analyses (CFA). Specifically, a bi-factor model was contrasted against 1- and 2-factor models. For the LPA, in turn, if one assumes the independence of RA and PA dimensions, then it would be expected to find one or more latent classes containing individuals that exhibit only one kind of these aggressive behaviors but not the other (Smeets et al., Reference Smeets, Oostermeijer, Lappenschaar, Cohn, van der Meer, Popma and Buitelaar2017). In this study, The Peer Aggressive Behavior Scale (PAB-S; Borsa, Reference Borsa2016)) and the Peer Aggressive and Reactive Behavior Questionnaire (PARB-Q; Gremign, Damásio, & Borsa, Reference Gremigni, Damásio and Borsa2013) were employed. The PAB-S and PARB-Q are two new AB self-report scales, which have been recently developed (Borsa, Reference Borsa2016) and adapted (Gremigni et al., Reference Gremigni, Damásio and Borsa2013) to the Brazilian context. Both scales present adequate psychometric properties and evidences of validity, as described in the Method section.
Method
Participants
Participants were a nationwide non-representative Brazilian sample, composed by 2,517 children (1,275 girls; 50.7%), aged from seven to 16 years of age (M = 9.97; SD = 1.31). Regarding socioeconomic status (SES), the majority of the sample belonged to the lower-middle class (79%). Data was collected in several regions of Brazil, including the South (n = 727, 28.9%), Southwest (n = 827, 32.9%) and Northern (n = 963; 38.2%) regions. The students were enrolled in the 1st to 7th grade of public (69.3%) and private (30.7%) elementary schools in Brazil. A total of 12 schools participated in the study, all of which were located in capitals or large urban centers. We opted to conduct this study with a wide age range, since there is no evidence that the dimensionality of the phenomenon varies from childhood to adolescence. We opted to exclude participants with missing data (n = 168) from the total sample, once the large majority of the absent information was not at random (i.e., participants did not finished answering the whole battery).
Measures
The Peer Aggressive Behavior Scale (PAB-S; Borsa, Reference Borsa2016): The PAB-S is a Brazilian 25-item self-report questionnaire, in which 15 items address PA-related behaviors and 10 address RA. The content of the items involves either direct physical (e.g., “When a colleague does something that makes me sad, I beat him”) or verbal (e.g. “I scream to my colleagues for them to do what I want”) manifestations, or indirect and relational behaviors (e.g., “I gossip about my colleagues to become more popular”). Each item is rated on an analogue-visual five-point Likert scale that asks respondents about the frequency with which each behavior occurs. In the validation study (Borsa, Reference Borsa2016), a one-dimensional solution was the most adequate to the data, and presented the following fit and reliability indexes: χ2(df) = 1,881.55 (702); χ2/df= 2.68; RMSEA = .052, 90 % CI [.049 – .055]; CFI = .94; TLI = .94; SRMR = .066; Alpha reliability = .96. Despite capturing a general factor of aggression, the PAB-S contains items that emphasize characteristic behaviors of both the PA and RA components. In the current study, we tested this possibility by implementing a bi-factor modeling approach, which allows the emergence of specific RA and PA factors as dimensions independent from a general factor.
Peer Aggressive and Reactive Behaviors Questionnaire (PARB-Q;). The PARB-Q is an Italian self-report instrument consisting of two separate scales (Gremigni et al., Reference Gremigni, Damásio and Borsa2013), adapted to Brazilian context by Borsa e Bandeira (Reference Borsa and Bandeira2014). The first scale, Peer Aggression Scale (PA), composed of 5-items, which investigates direct aggressive behavior. The second scale, entitled Reaction to Peer Aggression Scale (RPA), is composed of 12 items that investigate three different reactions to peer aggression: Reactive aggression (RA; 6 items), internalizing reaction subscale (IR; 3 items) and seeking teacher support subscale (STS; 3 items). For this study, only the PA Scale (5 items) and RA subscale (6 items) were used. The content of the items include intentional physical and verbal aggression (e.g., “how often do you say bad things to your classmates?”) and physical and verbal reactions (e.g., “When a classmate pushes and hurts you, do you hit him/her?”) to PA and RA, respectively. In the original study, the PARB-Q presented adequate goodness of fit and reliability indexes (for PA: χ2/df = 1.61/5; SRMR = .0190; RMSEA = .041, 90% CI [.000, .091]; CFI = .99; TLI = .99; α = 0.81); (For RA: χ2/df = 2.337; SRMR = .0563; RMSEA = .061, 90% CI [.047, .075]; CFI = .96; TLI = .95; α RPA = .86; IR = .82; STS = .84).
Procedures
Schools were contacted either in person or by phone. Each school received a summary of the study and clarification of the study’s objectives and procedures. The schools that consented to participate in the study signed a consent letter authorizing the study, while the children’s parents or legal guardians received and signed an informed consent form. The scales were collectively applied in classrooms by trained psychologists in such a way that the children’s routine of curricular activities were not interrupted. All the children whose parents consented to their participation completed the questionnaire. The instructions were read aloud and completed by each student and the application lasted approximately 50 minutes.
Participants had no cost or material or financial benefit to participate in the study. The parents and children were instructed to discontinue their participation in case of any discomfort with the study. The study adheres to Resolution 466/2012, of the Brazilian Ministry of Health and with the Declaration of Helsinki.
Data analysis
Confirmatory factor analyses assessed concurrent factor models for each questionnaire. Specifically, we tested three different models: Model 1, Single-factor structure: Both PA and RA items predicted by a single factor; Model 2, Two-factor structure: Two-correlated factors representing PA and RA, respectively; and Model 3: Bi-factor structure: both PA and RA items predicted by both PA and RA factors and also by a general “Aggressiveness” factor. Figure 1 presents representational structures of all the candidate models.
Illustrative Depiction of the Concurrent Models Tested.

The Weighted Least Squares Mean-and-Variance adjusted (WLSMV) estimation method was implemented on the CFAs, as it takes into account the categorical nature of the data (Muthén & Muthén, Reference Muthén and Muthén2012). For model assessment, we relied on the χ2 test and the following fitness indexes: Root mean square error of approximation (RMSEA), comparative fit index (CFI), and Tucker–Lewis index (TLI). According to Brown (Reference Brown2006), the χ2 value must be non-significant, which provides evidence that the observed covariance matrix is not significantly different from the model-implied covariance matrix. The RMSEA value must be less than .06 or .08 (with higher-bound 90% confidence interval not exceeding .10) and the CFI and TLI values should be greater than .90 (preferably closer to or greater than .95).
After finding the most adequate factor structure for each scale, Multiple-Causes Multiple Indicators (MIMIC; Muthén, Reference Muthén, Wainer and Braun1988) analyses were implemented. The MIMIC aimed to assess if age would present bias in items responses. The MIMIC model can be interpreted as follows: Age is firstly regressed on the latent factors. The β values represent the direct influence of the age on the latent trait (proactive and/or reactive aggression). In the second step, age is directly regressed on the items. If age continues impacting items response, after controlling for its impact on the latent trait, evidence of response biases are found, which suggests that age affects the parametrization of the items (Kim, Yoon, & Lee, Reference Kim, Yoon and Lee2011). Considering that a full MIMIC model is non-identified, we followed a hierarchical approach. The first MIMIC model regressed age on the latent traits (no bias model). Then, the impact of age on the first item of each scale/factor was fixed to 0. Then, we empirically evaluated which item had the value closest to zero and this item was chosen to be set to 0 in the final models.
In a further step, latent profile analysis (LPA) was used to verify issues with the scales. Our rationale here was that if propensity toward PA and RA are independent latent entities, then we should be able to find latent classes in which individuals score high on one of these factors but not the other. For instance, if we assume that PA and RA are truly distinct dimensions, then we would be able to see, in a large dataset, one latent class in which individuals score high on one dimension and low on the other, and another latent class with the exact opposite pattern. To test this possibility, we conducted latent analyses of each separate instrument using the Robust Maximum Likelihood estimator.
As in our case the possibility was that the target latent groups could be comprised of a small number of members, we ran several latent profile models with an increasing number of classes. Keeping small classes, even if they do not necessarily imply substantive individual differences, is at the core of our purpose in the present study. More specifically, we intended to test if the LCA would reveal independence between RA and PA dimensions in the form of a low RA/high PA or a high RA/low PA group-even if one these possibilities would show up as comprised by only a few individuals. To compare the fitness of these models with varying number of classes, we relied on the log-likelihood value (the larger the better), the Akaike Information Criterion (the smaller the better), the Bayesian Information Criterion (the smaller the better). We also relied on the entropy coefficient, which summarizes how unambiguously the solution yielded a classification of individuals (the larger the better) (Nylund, Asparouhov, & Muthén, Reference Nylund, Asparouhov and Muthén2007). In addition, the Vuon-Lo-Mendell Rubin (VLMR) test was employed as a criterion for model parsimony. More specifically, the procedure allows for testing if adding a latent class in the model (k classes + 1) significantly improves the fitness of the data relative to a model with one less class (k classes). The standard procedure consists of adding classes until reaching a non-significant improvement in the VLMR test, a result that indicates the previous model with one less class as the best representation of the data (Nylund et al., Reference Nylund, Asparouhov and Muthén2007). As indicators for the LPA, we employed the two indicators provided by the instruments PAB-S and PARB-Q – the sum score of PA and RA factors. To aid in the interpretation of latent profiles, each indicator variable was previously z standardized (mean 0, standard deviation 1).
All CFA, MIMIC and LPA analyses were separately performed for both the PAB-S and the PARB-Q. The decision to perform all analyses in two independent scales was to reduce the possibility of our findings be solely based on questionnaire´s characteristics rather in the phenomena itself.
Results
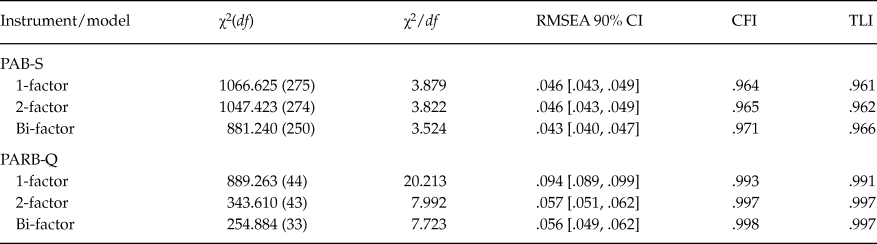
Table 1 presents the CFA results for the tested models (A supplementary file–Appendix 1-contains all between-item zero-order correlations). Results indicated a reasonable approximate fit to the data for all models of both scales, even though chi-square values were significant (p < .001).
Concurrent Models for both Peer Aggressive Behavior Scale (PAB-S) and Peer Aggressive and Reactive Behaviors Questionnaire (PARB-Q)

Note. χ2 = chi-square; df = degrees-of-freedom; RMSEA = Root Mean Square Error of Approximation; CI = Confidence Interval; CFI = Comparative Fit Index; TLI = Tucker-Lewis Index.
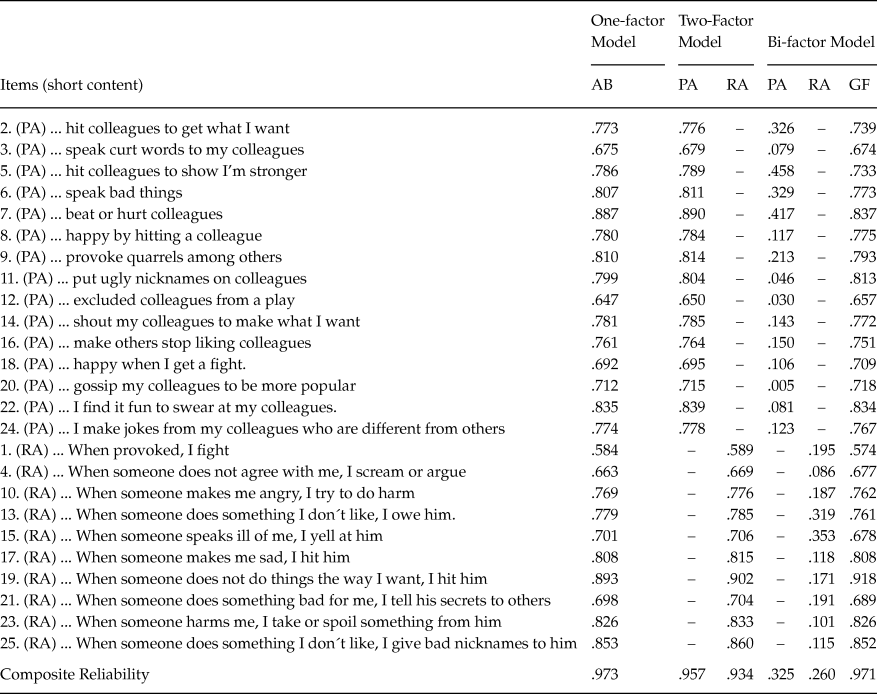
Tables 2 and 3 report on the factor loadings and composite reliability for all specified models of the PARB-Q and the PAB-S, respectively. For both PARB-Q and PAB-S scales, the general factor accounted for most of the common variance between items, as hypothesized (Tables 2 and 3). For both scales, RA and PA factors poorly contributed with unique variance, as a general factor played a major role as an explanation of the data. Although the fit indexes of all candidate models were virtually identical, the pattern of factor loadings of the bi-factor models seem to support that AB is a unitary construct, and that a multifactorial structure might emerge due to methodological artifacts related to item content or response biases.
Factor Loadings for Concurrent Structures of the Peer Aggressive and Reactive Behaviors Questionnaire (PARB-Q)

Note: PA = Proactive Aggression; RA = Reactive Aggression; GF = General Factor; - Not presented factor loadings (once they were fixed to 0 on the CFA).
Factor Loadings for Concurrent Structures of the Peer Aggressive Behavior Scale (PAB-S).

Note. AB = Aggressive Behavior; PA = Proactive Aggression, RA = Reactive Aggression, GF = General Factor; - Not presented factor loadings (once they were fixed to 0 on the CFA).
Age is a key variable in the occurrence of response biases to self-report inventories, as younger individuals tend to agree with items more than disagree, which causes distortions in factor structure (Soto, John, Gosling, & Potter, Reference Soto, John, Gosling and Potter2008). Accordingly, we conducted additional analyses using age as a proxy for response bias, i.e., inspecting for measurement invariance violations as a function of age. Multiple indicators multiple causes (MIMIC; Muthén, Reference Muthén, Wainer and Braun1988) analyses specifying age as an item covariate were implemented for the PARB-Q and PAB-S. Nevertheless, for both scales, no age bias was found in any of the three models (one, two and bi-factor models). After controlling for the effect of the age variable on the latent factors, no direct effect of age on items responses was significant (p > .05). These results suggest that the wide age range of the sample is not a cause for concern in the parametrization of the models assessed.
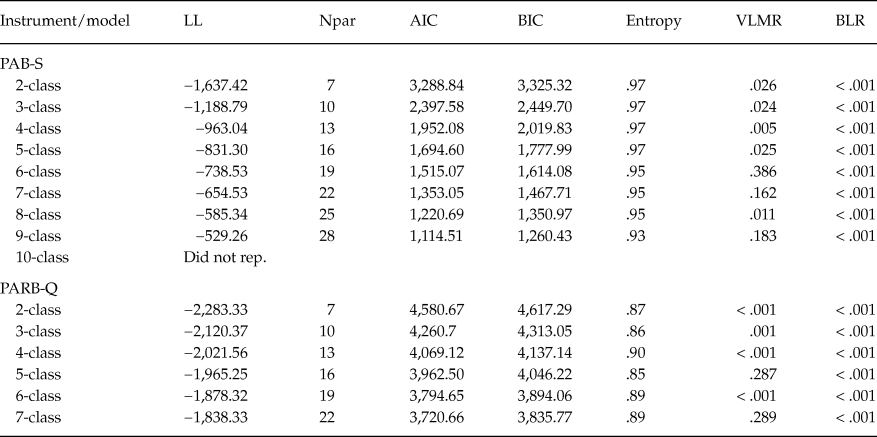
After evaluating the factor structure on both scales, as a further step, we explored the construct dimensionality by using an alternative strategy, namely, latent profile analysis (LPA). The LPA was implemented considering the aggressive behavior as a two-factor phenomenon. As said before, our main hypothesis was that, if PA and RA arise from two distinct latent factors, then irrespective of the respective inter-correlation in a large dataset, it should be possible to find groups where individuals score high on one of the aggression factors, but low on the other (i.e., high PA + low RA or low PA + high RA). The existence of such groups would count as evidence for a “pure” RA or PA aggression type, therefore supporting the theoretical and empirical distinction between RA and PA dimensions. In order to maintain consistency with the previous analyses, we ran separate latent profile models for each instrument, for which Table 4 presents the results obtained.
Latent Profile Analysis of PAB-S and PARB-Q

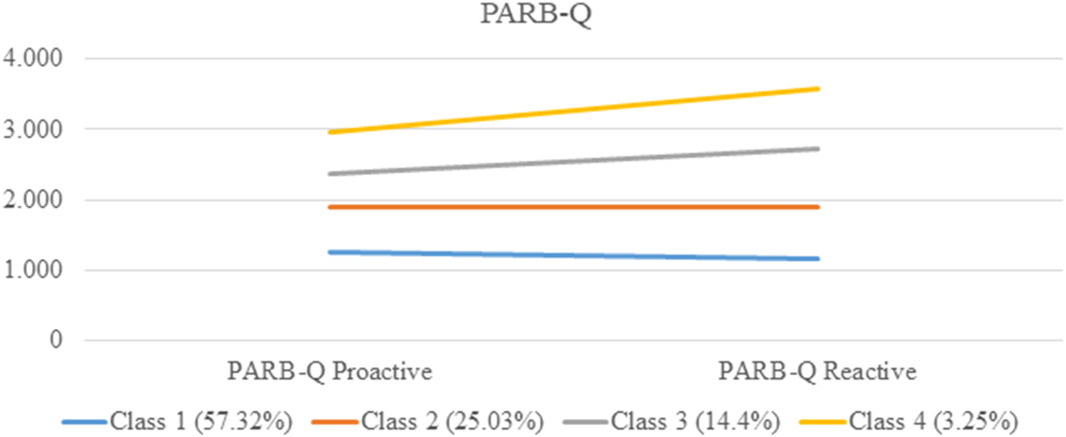
As seen in Table 4, fitness indexes (AIC and BIC) were not unanimous in indicating a single model as the best fit to the data in each set of analyses. Thus, we relied on the results from the VLMR test to determine the number of classes to be retained. According to the VLMR test, the PAB-S data was better explained by a 5-class model, while the PARB-Q data yielded a better fit for a 4-class model. Despite the difference in the number of classes, the same pattern of results emerged from the analysis of these two distinct inventories (Figures 2 and 3).
Estimated latent profiles for the PAB-S.

Estimated latent profiles for the PARB-Q.

In both analyses, results indicated the interdependence between PA and RA factors. More specifically, the LPA yielded a large class containing youths with low scores for PA and RA dimensions, a small class with young individuals scoring high on these two dimensions, and classes aligned in between. In other words, classes contained members with similar levels of proactive and reactive tendencies and the between-class differences occurred mainly because of a linear increase in these dimensions. No crossed profiles (low PA + high RA or high PA + low RA) was found, which once again rejects the hypothesis that PA and RA factors occur as independent phenotypic dimensions of aggression in children and adolescents. In line with the bi-factor model, these findings confirm that RA and PA factors tend to co-occur or overlap at a high degree. Even though the bi-factor model was less supportive of a general aggression factor in the PARB-Q, the latent profiles recovered from the data collected using this instrument, strongly mirrored those obtained when analyzing the data from the PAB-S.
Discussion
The current study investigates whether child PA and RA behaviors should be conceptualized as unique or separate constructs. As said before, although several authors argued in favor of separate dimensions, this distinction has also been criticized because of the difficulty in distinguishing the two types of aggression, as it tends to simultaneously occur in the same individual (Bushman, & Anderson, Reference Bushman and Anderson2001; Brugman et al., Reference Brugman, Lobbestael, Arntz, Cima, Schuhmann, Dambacher and Sack2014). The overall findings from the CFA and the LPA in our study indicate that PA and RA dimensions are correlated to a degree that might evidence the existence of a general factor of aggression.
Our CFA results suggested that all measurement models (one-factor, two-factor and bi-factor solutions) are empirically plausible. However, a clear pattern in the bi-factor models was found, which showed that the general factor played a major role in explaining items covariance. By employing LPA, the same pattern of latent profiles was observable for the PARB-Q and the PAB-S. As we had hypothesized, phenotypic independence between PA and RA would appear in a LPA in the form of one or more latent profiles consisting of high PA + low RA or low PA + high RA. However, results were rather supportive of a high interdependence between these two factors, as reported in other LPA investigations (e.g., Cui et al., Reference Cui, Colasante, Malti, Ribeaud and Eisner2016; Smeets et al., Reference Smeets, Oostermeijer, Lappenschaar, Cohn, van der Meer, Popma and Buitelaar2017). Despite the difference in the number of classes from both the PARB-Q and the PAB-S, the common scenario was a large class with non-aggressive youths (low PA + low RA), a small class with highly aggressive individuals (high PA + high RA) and classes aligned in between, with members scoring moderately (and similarly) on PA and RA factors. Thus, LPA results were more consistent with an empirical overlap of PA and RA. One of the implications is that if no “pure” PA or RA class is found in such a large dataset of youths (n = 2,517), then one might be tempted to consider that these factors are solely different facets of the same latent trait. In line with genetic studies (e.g., Bake et al., Reference Baker, Jacobson, Raine, Lozano and Bezdjian2007; Paquin et al., Reference Paquin, Lacourse, Brendgen and Bouvin2014), our findings might call for a common cause perspective on human aggression, in which a general factor might predispose young individuals toward both PA and RA manifestations.
One audacious interpretation of our findings is that the conclusion that PA and RA are distinct entities might have been influenced by the type of analyses employed in previous studies (e.g. Dodge & Coie, Reference Dodge and Coie1987; Poulin & Boivin, Reference Poulin and Boivin2000; Raine et al, Reference Raine, Dodge, Loeber, Gatzke-Kopp, Lynam, Reynolds and Liu2006; Vitaro et al., Reference Vitaro, Brendgen and Tremblay2002). Traditionally, these studies addressing the latent structure of aggression in youths (and the human species more broadly) have included only more basic one- and two-factor model candidates, not alternative factor models such as second-order and bi-factor representations. More specifically, authors customarily contrast fitness indexes of both single and two-factor solutions and base their conclusions on those results. This strategy ignores the plausibility of a second-order factor, which explains the first-order dimensions (Reise, Reference Reise2012). In the present study, the bi-factor models showed that the specific factors lost their explanatory power in face of the general factors. Of course, our results require replication in other inventories and age ranges (i.e., adults and older adults). Of interest would be the testing of bi-factor models using the Dodge and Coie’s teacher-report scale and RPQ scale, which has been the most popular inventory in studies that tested the distinction between PA and RA.
As far as we know, no other studies evaluated the structure of aggressive behavior based on bi-factor models. As presented earlier, bi-factor models have the capability of assessing the strength of the specific and general factors in the same analysis. Thus, we argue that both second-order and bi-factor CFA analyses are more adequate statistical procedures in modeling peer aggressive behaviors. Further, based on the qualitative differences of the items, as represented by the respective content, one can suppose that the characteristic of the instrument may have an important role on the factor structure of the scale. Thus, arguing in favor of a single or multidimensional structure of aggressive behaviors, based on factor analysis, may be more closely related to the characteristic of the scale rather than the structure of the psychological phenomenon. This may be one of the main limitations of the study, since the different content of the instruments may have interfered with the results obtained. Another limitation is that the scales are designed to assess peer-related aggression. However, proactive aggression can also involve non-peer related activities, such as fire setting, stealing, delinquent behavior, etc. Thus, we cannot argue that we assessed all kinds of proactive or reactive aggression, but only those more frequently observed in school-age children peer interaction.
Another limitation in the present study is worth mentioning. This and many other factor-analytic investigations have made use of self-report questionnaires to collect data and test the plausibility of factor models for aggression. Self-report items describing aggressive behaviors generally receive negative assessments (Card & Little, Reference Card and Little2006), i.e., they tend to be worded in a socially undesirable manner. As repeatedly demonstrated in many investigations, the assessment (i.e., social desirability) is strongly connected to item endorsement, which results in aversive item content tending to produce lower item endorsement (Holtgraves, Reference Holtgraves2004; Kuncel & Tellegen, Reference Kuncel and Tellegen2009).
One of the consequences is that the presence of evaluative content (i.e., social desirability) in item wording tends to produce common variance, which inflates inter-item correlations and then generates a general dimension in factor analysis (Podsakoff, MacKenzie, Lee, & Podsakoff, Reference Podsakoff, MacKenzie, Lee and Podsakoff2003). Indeed, evidence suggests that general factors in personality and psychopathology areas are produced more do to evaluative rather than descriptive systematic variance in self-report inventories (e.g., Pettersson, Turkheimer, Horn, & Menatti, Reference Pettersson, Turkheimer, Horn and Menatti2012). Accordingly, we are compelled to consider the possibility that the strong connection between PA and RA and the very emergence of a general factor of aggression in this study might partially reflect evaluative content in the wording of items from the PARB-Q and the PAB-S.
Further investigations partialling out social desirability are necessary to establish the existence of a general factor of aggression from self-reported data. Alternatively, the use of second-person measures, observational approaches as well as experimental designs may also contribute to the comprehension of the dimensionality of the phenomenon (Card & Little, Reference Card and Little2006; Little et al., Reference Little, Brauner, Jones, Nock and Hawley2003). Finally, it is also noteworthy that our data might have a hierarchical structure, in which variance of the data may arise from different sources, such as different schools, and different cities of the country, etc. Even though it was not possible to assess this in this study, future studies should investigate if multilevel analyses are capable of extracting different and unexpected results of the data.
The implications of this study for clinical practice needs to be mentioned. The identification of different types of aggressive behavior is important to promote an effective intervention, which must consider the specificity of each type of aggressive behavior (Little et al., Reference Little, Brauner, Jones, Nock and Hawley2003). However, we understand that it is the professional’s role (psychologist, educator, etc.) to identify the intrinsic (e.g., cognitive processes) and extrinsic (e.g., violent context) motivations associated with the emergence and maintenance of aggressive behaviors. This will only be possible through a complex process, including the application of different tools, the collection of information from multiple informants and the interdisciplinary analysis of the child’s history and context. In this sense, we understand that a standardized self-report instrument is not enough to capture this complexity. Reflections on the applicability of a possible dichotomization of aggressive behavior are necessary. Above all, it is important to reflect on the quality of information derived from psychological instruments, especially those that present biases in the response, such as self-reporting instruments.