INTRODUCTION
The Japanese jack mackerel (Trachurus japonicus (Temminck & Schlegel, 1844)) is a semi-pelagic fish distributed mainly on the continental shelf of the East China Sea (ECS), western Sea of Japan, and Pacific coast of southern and central Japan (Ochiai & Tanaka, Reference Ochiai, Tanaka, Ochiai and Tanaka1986). It is commercially fished by the countries adjacent to the ECS, one of the largest marginal seas of the western Pacific (Seikai National Fisheries Research Institute, 2001; FAO, 2013). Catches of the Japanese fisheries during 1980–2015 have fluctuated from 50 to 319 thousand metric tons (Watanabe et al., Reference Watanabe, Watari, Yukami, Kamimura, Furuichi and Akamine2017; Yoda et al., Reference Yoda, Kuroda and Takahashi2017). The catches have reflected the year-to-year variation in recruitment, therefore it is necessary to examine the mechanism underlying the recruitment variability.
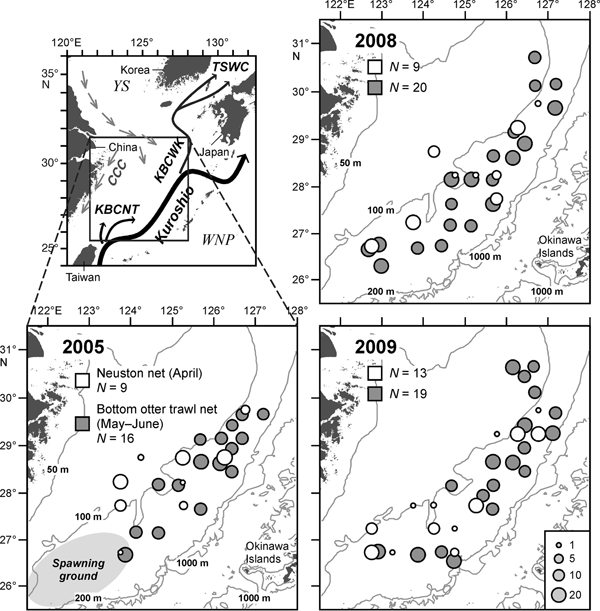
The primary spawning ground of T. japonicus is found in the shelf-break region of the southern part of the ECS south of 28°N during February to April (Sassa et al., Reference Sassa, Takahashi, Konishi and Tsukamoto2016), although they also spawn on a smaller scale in the coastal region off Japan (Ochiai & Tanaka, Reference Ochiai, Tanaka, Ochiai and Tanaka1986; Kanaji et al., Reference Kanaji, Watanabe, Kawamura, Xie, Yamashita, Sassa and Tsukamoto2009). The Kuroshio and Kuroshio Branch Current north of Taiwan have been shown to affect transport processes of eggs, larvae and juveniles of T. japonicus from the spawning ground of the southern ECS into the nursery grounds in the downstream areas (Figure 1) (Sassa et al., Reference Sassa, Konishi and Mori2006, Reference Sassa, Tsukamoto, Nishiuchi and Konishi2008b; Kasai et al., Reference Kasai, Komatsu, Sassa and Konishi2008). During the juvenile stage, the habitat and behaviour of T. japonicus change greatly, as well as physiological changes such as rate of digestion and absorption (Ochiai & Tanaka, Reference Ochiai, Tanaka, Ochiai and Tanaka1986). The juveniles of ~10–30 mm standard length (SL) occur in the pelagic layer (hereafter referred to as ‘pelagic juveniles’), and associate with gelatinous zooplankters, drift algae and flotsam (Uehara & Mitani, Reference Uehara and Mitani2002; Sassa et al., Reference Sassa, Konishi and Mori2006; Masuda et al., Reference Masuda, Yamashita and Matsuyama2008). Swimming ability of the juveniles markedly increases from ~30 mm SL (Ochiai et al., Reference Ochiai, Mutsutani and Umeda1982). After reaching approximately 30–50 mm SL, T. japonicus begin to occur near the bottom layer in the shelf-break region of the southern and central ECS mainly at the depth of 70–140 m between 27° and 31°N (hereinafter referred to as ‘demersal juveniles’), which subsequently forms the ECS stock (Sassa et al., Reference Sassa, Yamamoto, Tsukamoto, Konishi and Tokimura2009; Takahashi et al., Reference Takahashi, Sassa and Tsukamoto2012).
Sampling locations of Japanese jack mackerel (Trachurus japonicus) juveniles during the six cruises in the shelf-break region of the southern and central East China Sea in 2005, 2008 and 2009. The size of circles indicates the number of fish analysed at each site. N, total number of sampling stations. KBCNT, Kuroshio Branch Current north of Taiwan; KBCWK, Kuroshio Branch Current west of Kyushu; TSWC, Tsushima Warm Current; CCC, China Coastal Current. YS, Yellow Sea; WNP, western North Pacific.

Recruitment variability of fish is thought to be largely determined during the early life stages, when the larvae and juveniles are vulnerable to a variety of physical and biological factors that can affect their survival (Houde, Reference Houde1987; Chambers & Trippel, Reference Chambers and Trippel1997; Fuiman & Werner, Reference Fuiman and Werner2002). In T. japonicus, survival from the larval to demersal juvenile stages is estimated to vary among years in the ECS, which is considered to be a key process for understanding the fluctuations in recruitment (Kasai et al., Reference Kasai, Komatsu, Sassa and Konishi2008; Sassa et al., Reference Sassa, Takahashi, Nishiuchi and Tsukamoto2014, Reference Sassa, Takahashi, Konishi and Tsukamoto2016). Importance of the growth rate during the early life stages for subsequent recruitment has been suggested in various marine fishes (Anderson, Reference Anderson1988; Litvak & Leggett, Reference Litvak and Leggett1992; Bailey et al., Reference Bailey, Brown, Yoklavich and Mier1996; Meekan & Fortier, Reference Meekan and Fortier1996; Takahashi et al., Reference Takahashi, Nishida, Yatsu and Watanabe2008). Takahashi et al. (Reference Takahashi, Sassa and Tsukamoto2012, Reference Takahashi, Sassa, Nishiuchi and Tsukamoto2016) suggested that growth rates during the late larval and pelagic juvenile stages are associated with recruitment success of demersal juveniles and subsequent year-class strength of T. japonicus in the ECS. Feeding as well as habitat temperature is directly related to growth of fishes (Takahashi & Watanabe, Reference Takahashi and Watanabe2005; Zenitani et al., Reference Zenitani, Kono, Tsukamoto and Masuda2009), thus detailed information on feeding habits during the early life stages is essential for understanding the mechanism of year-to-year variations in recruitment of fishes. Recent papers have detailed the dietary composition, prey size, daily ration and inter-annual variability in diet of T. japonicus larvae in the southern ECS during late winter (Sassa et al., Reference Sassa, Tsukamoto and Konishi2008a; Sassa & Tsukamoto, Reference Sassa and Tsukamoto2012; Hirota et al., Reference Hirota, Honda, Sakaji, Uehara and Ichikawa2016). However, information on ontogenetic changes and inter-annual variations in feeding habits of T. japonicus juveniles is not available in the literature. Any variations in feeding behaviour might have implications for growth and subsequent recruitment to the ECS stock.
The goal of this study was to examine the feeding habits of T. japonicus juveniles in the surface and near bottom layers of the ECS in the three years of 2005, 2008 and 2009. The results are discussed in relation to reported growth rates and recruitment levels (Takahashi et al., Reference Takahashi, Sassa and Tsukamoto2012; Yoda et al., Reference Yoda, Kuroda and Takahashi2017).
MATERIALS AND METHODS
Sample collection
Specimens were sampled during six cruises in the shelf-break region of the ECS in 2005, 2008 and 2009 (Figure 1). Pelagic juveniles of T. japonicus were sampled at 9, 9 and 13 stations during 19–29 April 2005, 18–29 April 2008 and 17–29 April 2009, respectively, from the RV ‘Yoko-Maru’ (Seikai National Fisheries Research Institute) (Figure 1). A neuston net (mouth size 1.3 × 0.75 m; mesh size 1.0 mm; Oozeki et al., Reference Oozeki, Kimura, Kubota and Ishida2001) was towed for 10 min with a vessel speed of 3.5 knots during the daytime. This net is designed to be towed horizontally in the upper 0.75 m layer, with a buoy attached on each side of the frame for keeping it on the surface. Specimens were first fixed in 10% borax-buffered formalin seawater for 6 h, formalin rinsed out with fresh water, and then transferred to 95% ethanol for preservation.
For zooplankton sampling, we used a conical Norpac net with an opening of 45 cm in diameter and with 100 µm mesh size (Motoda, Reference Motoda1957). The net was towed vertically from 50 m to the surface at each station where the samplings of pelagic juveniles were conducted. The volume of water filtered by the Norpac net was measured with a flowmeter mounted at the net mouth. Plankton samples were fixed with 5% buffered formalin seawater immediately after collection.
Demersal juveniles of T. japonicus were sampled at 16, 20 and 19 stations using a bottom otter trawl net from 12 May to 1 June 2005, from 21 May to 20 June 2008, and from 18 May to 15 June 2009, respectively, from the RV ‘Kumamoto-Maru’ (Kumamoto Prefecture) (Figure 1). The net had a mouth opening of 22 m (width) × 9.4 m (depth) and variable mesh size from 180 mm at the mouth to 66 mm at the cod-end, which was covered with a 18 mm cod-end cover. The net was towed for 30 min at a vessel speed of 3 knots during the daytime. Subsamples of T. japonicus were sorted out from the trawl catch and immediately frozen at −10 °C onboard, and fixed in 10% borax-buffered formalin fresh water in laboratory.
During the six cruises, a conductivity-temperature-depth profiler (CTD, Alec Electronics Co., Ltd, Tokyo, Japan) was used at each sampling station from surface to 5 m above the bottom to obtain hydrographic data.
We analysed only specimens sampled between sunrise and sunset, since T. japonicus juveniles are daytime visual feeders (Suzuki, Reference Suzuki1965; Kozasa, Reference Kozasa1970). Number of the pelagic juveniles collected by the neuston net was <10 individuals at 77% of the stations, while >20 demersal juveniles were always sampled by the bottom otter trawl net. To pool a sufficient number of the pelagic juveniles each year for describing the diet composition, we examined all specimens at the stations where <20 individuals occurred, and up to 20 randomly selected specimens at the stations where ≥20 individuals occurred (Figure 1). In the demersal juveniles, we randomly selected from 10 to 15 individuals from each sampling station for the stomach contents analysis. As a whole, a total of 82–100 pelagic juveniles (8.0–29.8 mm SL) and 205–269 demersal juveniles (26.5–105.3 mm SL) were examined during the three years (Figure 2).
Length-frequency distributions of Japanese jack mackerel (Trachurus japonicus) juveniles examined for stomach contents in 2005, 2008 and 2009, where n is the total number of juveniles examined.

Laboratory analysis
For each specimen, SL was measured to the nearest 0.1 mm. Thereafter, stomachs were dissected and the contents removed. Since the identification of prey items at the species or genus level is fundamental to understand the trophic relationships within a food web, we identified prey items to the lowest possible taxon, based on Chihara & Murano (Reference Chihara and Murano1997). Copepod species were categorized into the developmental stages of adult female, male and copepodite; euphausiids into calyptopis, furcilia and juvenile; decapods into zoea, mysis, megalopa and juvenile. Body lengths and widths of prey items in good condition were measured to the nearest 0.01 mm for each category under a microscope fitted with an ocular micrometer to estimate mean dimensions. The mean dimensions of each prey category were converted to the approximate dry weight (DW) based on equations from Anraku et al. (Reference Anraku, Hirota, Taniguchi, Endo and Uye1986) for copepods, ostracods and decapods; Ikeda (Reference Ikeda1990) for amphipods; Iguchi & Ikeda (Reference Iguchi and Ikeda1999) for euphausiids; and Beers (Reference Beers1966), Anraku et al. (Reference Anraku, Hirota, Taniguchi, Endo and Uye1986) and Uye et al. (Reference Uye, Nagano and Tamaki1996) for the other taxa.
The results presented below indicated that pelagic juveniles of T. japonicus preyed mainly on Paracalanus parvus s.l., Calanus sinicus and Corycaeus affinis. Consequently, we used the densities of these three copepods as indices of the food availability. To assess inter-annual variations in the food availability for the pelagic juveniles, the three species were identified and counted in the Norpac net samples from each tow in the three years. Since the pelagic juveniles were collected in the top 0.75 m of the water column in this study, the sampling layers of juveniles and zooplankton were largely different. Consequently, applying a selectivity index to the data was not considered adequate. However, in the shelf-break region of the ECS, copepods distribute fairly evenly in the upper 50 m layer during late winter when the mixed layer depth is observed to ~60–100 m (Hirota et al., Reference Hirota, Honda, Sakaji, Uehara and Ichikawa2016). In spring, the mixed layer depth becomes shallower, but it is still ~40–60 m in the study area (Sassa et al., Reference Sassa, Konishi and Mori2006). Therefore, we assumed that the densities of the three copepods in the upper 50 m layer would be representative of the food availability for the pelagic juveniles.
Data analysis
The sampling locations were relatively evenly distributed across the whole area with a similar survey effort in all the three years (Figure 1). Consequently, the data were pooled for each year to represent the inter-annual variation in the diet composition.
The habitat temperature for the pelagic juveniles in each year was defined as the mean sea surface temperature (SST) across all the stations in April. In the same way, the mean temperature in the near bottom layer in May–June each year represented the habitat for the demersal juveniles. The habitat temperatures for the juveniles were compared among the three years by one-way ANOVA followed by Tukey–Kramer post-hoc test.
The pelagic juveniles were separated into two size classes of <15 and ≥15 mm SL, and the demersal juveniles into <60 and ≥60 mm SL to assess ontogenetic changes in the diet. Stomach data were partitioned into subsets according to these size classes and years. The modified index of relative importance (IRI), i.e. using DW rather than wet weight of prey items (Pinkas et al., Reference Pinkas, Oliphant and Iverson1971; Landingham et al., Reference Landingham, Sturdevant and Brodeur1998), was calculated for each data subset to characterize the diet and to rank prey taxa:
 $${\rm IRI} = ({\rm \%} N + {\rm \%} W) \times {\rm \%} F$$
where %N is percentage of each prey item to the total number of identifiable prey items, %W is percentage DW of each prey item to the total DW of identifiable prey items, %F is frequency of occurrence of each prey item in the total number of stomachs examined (excluding empty stomachs). The IRI was expressed as the percentage of total IRI (%IRI) for each data subset (Cortés, Reference Cortés1997). The diversity of prey items was analysed using Levins’ diet breadth index (B; Levins, Reference Levins1968):
 $$B = \left( {\sum \limits_{i = 1}^n p_i^{\;2}} \right)^{ - 1}$$
where p i is the %IRI of each prey category in the diet.
The Bray–Curtis similarity index (BC; Bray & Curtis, Reference Bray and Curtis1957) was used to compare the %IRI of all prey items identified among the three years and between the two size classes of both the pelagic and demersal juveniles. The index comparing the two data sets of stomach contents (A and B) was calculated using the following equation:
 $${\rm BC} = 100 \times \left( {1 - \displaystyle{{\sum \nolimits_{i = 1}^n \left \vert {\,p_{iA} - p_{iB}} \right \vert} \over {\sum \nolimits_{i = 1}^n p_{iA} + \sum \nolimits_{i = 1}^n p_{iB}}}} \right)$$
where p iA and p iB are the %IRI of prey item i in data sets of stomach contents of A and B, respectively. To reduce the influence of dominant prey items, the %IRI values were square root transformed prior to analysis. Clustering by UPGMA (unweighted pair-group method using the arithmetic average) was used to construct similarity matrices. Cluster analysis was performed with PRIMER v6 software package (Clarke & Gorley, Reference Clarke and Gorley2006).
The number of the three copepods of P. parvus s.l., C. sinicus and C. affinis sampled in the plankton net was standardized to the number per 1 m3 in the upper 50 m layer. Densities of each species were log10 (x + 1) transformed prior to the analyses to normalize the data and decrease the variance. Median prey densities were compared among the three years by the Kruskal–Wallis test followed by the Steel–Dwass post-hoc test. The significance level for the statistical test was set at α = 0.05.
RESULTS
Overall diet composition
Mean habitat temperature for pelagic juveniles ranged from 19.3 to 19.9 °C and for demersal juveniles from 17.6 to 18.2 °C in the three years, without a significant inter-annual difference (ANOVA, P > 0.05; Table 1).
Mean±standard deviation of the habitat temperature (°C) of Japanese jack mackerel (Trachurus japonicus) juveniles, as represented by sea surface temperatures in April, and temperature in the near bottom layer in May–June for pelagic and demersal juveniles, respectively.

The 44 different prey categories detected in the stomachs of pelagic juveniles are listed in Table 2. Copepods were highly abundant and the most diverse prey categories, including four orders, 19 genera and 37 species or species groups, while occurrence of the other taxa was less. The number of taxa that occurred in the stomachs was markedly different among years, and Levins’ index B was highest in 2008 (Table 2).
Summary of prey items in the pelagic juveniles of Japanese jack mackerel (Trachurus japonicus) in the epipelagic layer in the southern and central East China Sea in 2005, 2008 and 2009.

%N is numerical percentage, %W is dry weight percentage, %F is frequency of occurrence percentage of fish with prey item i, and %IRI is per cent of total IRI (index of relative importance) for all prey taxa. IRI = (%N + %W) × %F. –, no occurrence.
In the stomachs of the demersal juveniles, a total of 82 prey categories were identified (Table 3). Copepods were the most abundant and diverse prey categories, including three orders, 25 genera and 56 species or species groups, although ostracods, amphipods, euphausiids and decapods were also occasionally abundant. The B values of the demersal juveniles were higher than the values of the pelagic juveniles in the three survey years (Table 3).
Summary of prey items in the demersal juveniles of Japanese jack mackerel (Trachurus japonicus) in the near bottom layer in the southern and central East China Sea in 2005, 2008 and 2009.

%N is numerical percentage, %W is dry weight percentage, %F is frequency of occurrence percentage of fish with prey item i, and %IRI is per cent of total IRI (index of relative importance) for all prey taxa. IRI = (%N + %W) × %F. –, no occurrence.
Ontogenetic changes and inter-annual variations in diet
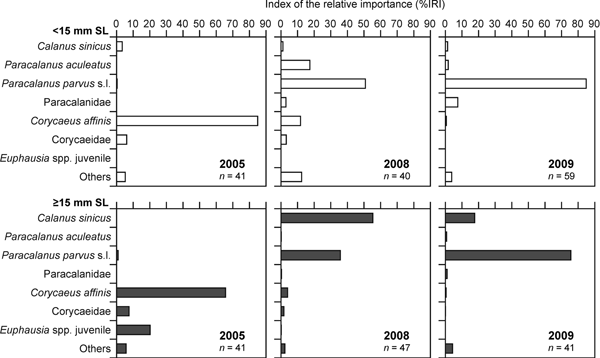
In 2005, Corycaeus affinis dominated in the stomach contents of pelagic juveniles in both size classes, and the %IRI values were 65.6–85.0% of the total prey identified (Figure 3). Euphausia spp. juveniles were also preyed on by juveniles ≥15 mm SL, constituting 20.2% of %IRI. In 2008 and 2009, in contrast, Paracalanus parvus s.l. was the most dominant prey item in juveniles <15 mm SL, accounting for %IRI values of 50.9 and 84.9%, respectively, of the total prey identified (Figure 3). In 2008, P. aculeatus and C. affinis were also preyed on by juveniles <15 mm SL, which constituted 17.5 and 11.8% of %IRI, respectively. In 2008 and 2009, juveniles ≥15 mm SL predated heavily on P. parvus s.l., with %IRI values of 35.8–75.6%. In addition, the importance of Calanus sinicus was markedly higher in juveniles ≥15 mm SL, which constituted 17.7–55.3% of %IRI values.
Dietary composition of pelagic juveniles of Japanese jack mackerel (Trachurus japonicus) in the surface layer in April from the East China Sea in 2005, 2008 and 2009, expressed as per cent of an index of the relative importance (%IRI) of each prey category in relation to two size classes of juveniles, where n represents the total number of juveniles examined. Only prey categories that accounted for more than 5% of %IRI values of the total prey categories identified in at least one of the years are shown.

In the demersal juveniles, C. sinicus was the most important prey item in all survey years in terms of %N, %W, and %F (Table 3), and the %IRI values in juveniles <60 and ≥60 mm SL ranged from 30.8–55.5% and 29.3–62.2%, respectively (Figure 4). Planktonic halocypridid ostracods were also dominant prey items of demersal juveniles during the three years in terms of %F (Table 3), resulting in %IRI values of 0.9–54.6 and 6.0–26.1% in juveniles <60 and ≥60 mm SL, respectively (Figure 4). In addition, the demersal juveniles preyed considerably on C. affinis and Euphausia nana in 2005, and on Paraeuchaeta plana in 2008 and 2009, all of which accounted for >10% of %IRI values (Figure 4). The %IRI values of hyperiid amphipods in juveniles ≥60 mm SL was higher than those in juveniles <60 mm SL in the three years.
Dietary composition of demersal juveniles of Japanese jack mackerel (Trachurus japonicus) in the near bottom layer during May to June from the East China Sea in 2005, 2008 and 2009, expressed as per cent of an index of the relative importance (%IRI) of each prey category in relation to two size classes of juveniles, where n represents the total number of juveniles examined. Only prey categories that accounted for more than 5% of %IRI values of the total prey categories identified in at least one of the years are shown.

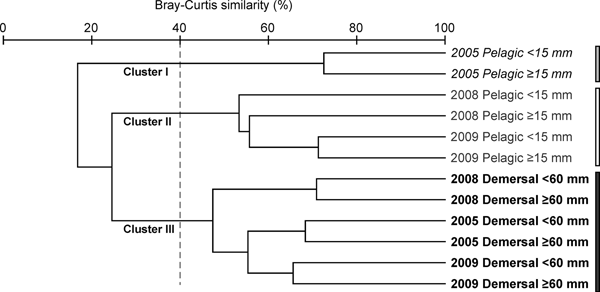
The cluster analysis of the compiled data of diet composition (%IRI) showed the level of similarities among years and juvenile types (Figure 5). Three clusters were delineated at a similarity level of 40%. Cluster I included only the pelagic juveniles in 2005, cluster II included the pelagic juveniles in 2008 and 2009, while cluster III included the demersal juveniles from all three surveys.
Dendrogram by cluster analysis based on the Bray–Curtis similarity index on square root-transformed %IRI of prey items in the stomach contents of Japanese jack mackerel (Trachurus japonicus) juveniles in the East China Sea in 2005, 2008 and 2009.

Sex and developmental stages of prey items
In the stomach contents of the pelagic juveniles, percentages of adult females of P. parvus s.l. were higher than percentages of males and earlier copepodite stages (Table 4). On the contrary, a preponderance of adult males over females was significant in C. affinis found in the stomachs of pelagic juveniles. In the stomachs of both pelagic and demersal juveniles, percentages of adult females and the fifth copepodite stage (CVs) of C. sinicus were markedly higher than percentages of males and fourth copepodite stage (CIVs), constituting >80% of the total (Table 4).
Composition (%) of developmental stages of the dominant copepod species in the stomachs of pelagic juveniles of Japanese jack mackerel (Trachurus japonicus) in the epipelagic layer in April and demersal juveniles in the near bottom layer during May to June in the shelf-break region of the East China Sea.

F, adult female; M, adult male; CIV, the fourth copepodite stage; CV, the fifth copepodite stage. –, total number of individuals sampled from the stomachs was <65.
Based on the mean body size and the reported body size–carbon relationship, carbon content of P. parvus s.l. females was approximately twice as high as that of C. affinis males (Table 5). Carbon contents of adult females and CVs of C. sinicus were ~23 and 13 times higher than the value of P. parvus s.l. females.
Dimensions and carbon contents of the four major prey items taken by Japanese jack mackerel (Trachurus japonicus) juveniles.

The mean prosome length was converted to the approximate carbon contents based on equations from Liang and Uye (1996) for P. parvus s.l., Satapoomin (Reference Satapoomin1999) for C. affinis, and Uye (Reference Uye1988) for C. sinicus. F, adult female; M, adult male; CV, the fifth copepodite stage. SD, standard deviation.
Zooplankton in the water column
The density of zooplankton in April showed both inter-annual and spatial variations (Figure 6). Median density of P. parvus s.l. in 2005 was significantly lower than in 2008 and 2009 (Kruskal–Wallis test and Steel–Dwass test, P < 0.05). The interquartile range of density of C. sinicus in 2005 was lower than in the other two years, while median density of C. affinis was markedly higher in 2005 (Figure 6). However, the densities of C. sinicus and C. affinis were not significantly different among the years (Kruskal–Wallis test, P > 0.05 in both species), which is probably driven by the variations among locations within each year.
Box plots of log10 (x + 1) transformed densities (individuals per m3, 0–50 m depth) of Paracalanus parvus s.l., Calanus sinicus and Corycaeus affinis collected by Norpac net (0.1 mm mesh) in the shelf-break region of the southern and central East China Sea in April 2005, 2008 and 2009. The total number of stations in 2005, 2008 and 2009 were 9, 9 and 13, respectively. The box plots denote median values and 25% and 75% interquartiles (IQ25 and IQ75 respectively); the lower and upper whiskers represent IQ25 − 1.5 × (IQ75 − IQ25) and IQ75 + 1.5 × (IQ75 − IQ25) respectively; dots represent outliers. Different letters beside plots indicate statistical difference (P < 0.05) among the three years.

In P. parvus s.l., females were more abundant than males in the water column, while in C. affinis males were more abundant than females (Table 6). In C. sinicus, percentage of CVs was highest (61.9%). Although the percentage of adults was low in C. sinicus, females were more abundant than males (Table 6).
Composition (%) of developmental stages of the three copepod species collected by Norpac net (0.1 mm mesh) in the shelf-break region of the East China Sea in April.

F, adult female; M, adult male; CI–V, copepodite stages I–V. Data in 2005, 2008 and 2009 was pooled for C. affinis, while data in 2008 and 2009 for P. parvus s.l. and C. sinicus.
DISCUSSION
Diet composition of pelagic juveniles and its inter-annual variations
Diet composition of the pelagic juveniles showed a significant difference between 2005 and the other two years. That is, in 2008 and 2009, the pelagic juveniles <15 mm SL ate mainly P. parvus s.l., and started to prey on C. sinicus when they reached ≥15 mm SL. In 2005, on the other hand, the pelagic juveniles predated heavily on C. affinis in both size classes. The observed difference in diet partly corresponded with the between-year difference in the prey densities in the field. That is, in 2005, the median density of P. parvus s.l. was significantly lower than in 2008 and 2009. Also, the density of C. sinicus in the water column was lowest in 2005, although the difference between the other two years was much smaller compared with P. parvus s.l. In contrast to these two species, C. affinis density in 2005 was highest among the three years. Therefore, the difference in the prey densities in the field could be one of the main factors influencing the between-year difference in the diet. However, it must be noted that the prey density in the upper 50 m layer, although well mixed, may be different from the food availability for the pelagic juveniles occurring in the surface layer (upper 0.75 m).
Paracalanus parvus s.l. is numerically the most dominant small-sized copepod in the epipelagic layer of the ECS shelf and its adjacent waters (Liang & Uye, Reference Liang and Uye1996; Lan et al., Reference Lan, Lee, Chen, Hsieh, Pan, Liu and Su2008; Chou et al., Reference Chou, Tseng, Ou, Chen and Hwang2012). Except for 2005, pelagic juveniles of T. japonicus depended on P. parvus s.l. adult females, while larvae of T. japonicus preyed mainly on early developmental stages of Paracalanus spp. copepodites (mainly P. parvus s.l.) in the southern ECS (Sassa et al., Reference Sassa, Tsukamoto and Konishi2008a; Sassa & Tsukamoto, Reference Sassa and Tsukamoto2012). This indicated that various developmental stages of P. parvus s.l. provide a wide size spectrum of prey items, being a key species for the early survival of T. japonicus. The density of P. parvus s.l. shows a peak from spring to early summer on the ECS shelf (Chihara & Murano, Reference Chihara and Murano1997; Chou et al., Reference Chou, Tseng, Ou, Chen and Hwang2012; Kitajima, unpublished data), corresponding to the seasonal peak abundance of the pelagic juveniles (Sassa et al., Reference Sassa, Konishi and Mori2006; Takahashi et al., Reference Takahashi, Sassa, Nishiuchi and Tsukamoto2016). This seasonal overlap with P. parvus s.l. is most likely advantageous for the survival of T. japonicus during the pelagic juvenile stage.
Corycaeus affinis is a neritic corycaeid copepod and commonly distributed in the epipelagic layer of the ECS shelf (Chihara & Murano, Reference Chihara and Murano1997; Lan et al., Reference Lan, Lee, Chen, Hsieh, Pan, Liu and Su2008). In 2005 when low densities of P. parvus s.l. were observed, pelagic juveniles of both size classes ate mainly C. affinis. This indicated that pelagic juveniles adapted their diet to the available prey having a similar body size to P. parvus s.l. This also suggests that they are opportunistic predators. However, based on the carbon content, C. affinis would be energetically less favourable prey than P. parvus s.l. and the pelagic juveniles in 2005 had trophically poorer conditions than in 2008 and 2009. In addition, no ontogenetic variation in diet of the pelagic juveniles in 2005 should have resulted in increased intraspecific competition among the different size classes.
The predation by pelagic juveniles on C. sinicus in 2008 and 2009 was largely limited to the larger juveniles (≥15 mm SL). Since a bimodal vertical distribution of C. sinicus is observed on the ECS shelf, with the maximum abundance near the bottom layer and another peak in the epipelagic layer (Wang et al., Reference Wang, Zuo and Wang2003; Kitajima, unpublished data), not only the demersal juveniles but also pelagic juveniles can encounter C. sinicus. The occurrence of C. sinicus in stomachs of pelagic juveniles ≥15 mm SL can most likely be linked to larger mouth size and increased swimming availability of T. japonicus. The total length and width of C. sinicus found in stomachs ranged from 2.2–2.6 mm and 0.6–0.8 mm, respectively, with dimensions which were ~2–3 times larger than those of P. parvus s.l. The upper jaw length and mouth width, a proxy of mouth size (Shirota, Reference Shirota1970), of T. japonicus at 15 mm SL were 2.4 and 1.3 mm, respectively (Sassa, unpublished data), which is considered to be large enough to begin eating C. sinicus. Carbon contents of C. sinicus were 13–23 times higher than that of P. parvus s.l., implying a higher energetic gain for the pelagic juveniles. Accordingly, the occurrence of C. sinicus in the stomachs of pelagic juveniles in 2008 and 2009 indicates that the food availability for the juveniles was markedly higher than in 2005.
In this study, P. parvus s.l. and C. sinicus found in the stomach of the pelagic juveniles were mostly females, while C. affinis were mostly males in all the three years. Extremely female-skewed sex ratios in the water column have been observed in various copepods including P. parvus s.l. and C. sinicus (Chen, Reference Chen1964; Hirst et al., Reference Hirst, Bonnet, Conway and Kiørboe2010; Gusmão et al., Reference Gusmão, McKinnon and Richardson2013; this study). In C. affinis, on the contrary, males were more abundant than females in the water column of the ECS shelf, corresponding with the previous study of Böttger-Schnack et al. (Reference Böttger-Schnack, Schnack and Weikert1989) in the Red Sea that showed a high percentage of Corycaeus spp. males. For the three copepod species, the prosome length of the females is slightly larger than of the males (~1.1 fold difference; Kitajima, unpublished data). Thus, potential selection of larger prey by the juveniles should hardly impact the sex ratios observed in the stomachs. Consequently, the skewed sex ratios of prey items in the stomachs of the pelagic juveniles are considered to reflect the sex ratios of the prey in the field.
Importance of C. sinicus as prey for demersal juveniles
After the habitat transition from the surface to the near bottom layer, the index of importance of P. parvus s.l. and C. affinis as prey items for T. japonicus juveniles decreased greatly. Instead, C. sinicus became the dominant prey item for the demersal juveniles in the three survey years. Also, the demersal juveniles occasionally fed on halocypridid ostracods and Paraeuchaeta plana as numerically dominant prey items. No difference in the diet composition was observed between the two size classes of the demersal juveniles, although the juveniles ≥60 mm SL would have sufficient swimming ability and a large mouth to feed on larger prey items. Jiang et al. (Reference Jiang, Jin, Zhou, Xue and Guo2013) also found C. sinicus in the stomach of T. japonicus juveniles (mostly 65–85 mm SL) in the ECS during spring. In addition, stomach contents of the age-0 T. japonicus (80–140 mm SL) mainly consisted of calanoid copepods (probably C. sinicus based on the body width) in the northern ECS in summer (Tanaka et al., Reference Tanaka, Aoki and Ohshimo2006). This suggests that T. japonicus prefers C. sinicus for at least three months after the habitat transition to the near bottom layer. Calanus sinicus is one of the key components of the ecosystem on the ECS shelf and adjacent waters, supporting the production of commercially important fishes including both pelagic and demersal species (Chen, Reference Chen, Zhou, Liang and Zeng1994; Uye, Reference Uye2000; Wang et al., Reference Wang, Zuo and Wang2003; Hwang & Wong, Reference Hwang and Wong2005; Xu & Chen, Reference Xu and Chen2007). Density of C. sinicus shows a strong monthly variation, with a single peak season from May to June on the ECS shelf (Chen, Reference Chen, Zhou, Liang and Zeng1994; Wang et al., Reference Wang, Zuo and Wang2003; Xu & Chen, Reference Xu and Chen2007). This corresponds to the seasonal peak abundance of the demersal juveniles (Sassa et al., Reference Sassa, Yamamoto, Tsukamoto, Konishi and Tokimura2009), and is likely advantageous for survival of T. japonicus during the demersal juvenile stage.
In the stomachs of the demersal juveniles, percentages of CVs and adult females of C. sinicus were markedly higher than of the other developmental stages. This corresponds to the composition of C. sinicus in the southern Yellow Sea and the ECS during spring to summer (Wang et al., Reference Wang, Zuo and Wang2003; Pu et al., Reference Pu, Sun, Yang, Ji, Zhang and Zhang2004; Hwang & Wong, Reference Hwang and Wong2005; Wang et al., Reference Wang, Li, Liu and Sun2014). The CVs and females of C. sinicus store lipids in the body, and the total lipid content in CVs and females are 22.4–40.1% and 5.4–17.2% of their body DW, respectively, in the ECS and Yellow Sea (Wang et al., Reference Wang, Li, Liu and Sun2014), i.e. they are high-calorie prey items.
Implications of diet for growth and recruitment
Growth during the larval and juvenile stages has been suggested to be an important factor determining survival and recruitment success of fishes including both pelagic and demersal species, even if competing alternative hypotheses for recruitment variation exist as well (Anderson, Reference Anderson1988; Chambers & Trippel, Reference Chambers and Trippel1997; Fuiman & Werner, Reference Fuiman and Werner2002; Robert et al., Reference Robert, Castonguay and Fortier2007). Early growth is directly related to feeding and habitat temperature (Takahashi & Watanabe, Reference Takahashi and Watanabe2005; Zenitani et al., Reference Zenitani, Kono, Tsukamoto and Masuda2009). In this study, diet composition of the pelagic juveniles showed a significant difference between 2005 and the other two years, although no difference was observed in the habitat temperature. Takahashi et al. (Reference Takahashi, Sassa and Tsukamoto2012, Reference Takahashi, Sassa, Nishiuchi and Tsukamoto2016) reported that growth rates of T. japonicus during the late larval and pelagic juvenile stages in 2005 were lower than in 2008 and 2009 in our study area. Also, they discussed that this lower growth rate potentially resulted in the lowest observed recruitment level of the demersal juveniles for the ECS in 2005 over these three years (Yoda et al., Reference Yoda, Kuroda and Takahashi2017). The diet composition of the pelagic juveniles in the three years studied, likely impacted the growth and recruitment of the stock for these years. That is, the markedly low occurrence of P. parvus s.l. and C. sinicus, which are considered to be energetically more favourable than C. affinis, from the stomach of the pelagic juveniles in 2005 potentially relates to the lower growth rate that year and consequently poor recruitment.
In the upper 50 m water column, the density of P. parvus s.l. in 2005 was significantly lower than in 2008 and 2009. Also, the density of C. sinicus tended to be low in 2005, although a significant difference was not detected between the other two years. This suggests that the availability of the two prey items in 2005 may have been lower compared with the other two years. However, our results of stomach contents are just a snapshot picture of the three years. We need to analyse the relationships among the diet, growth, and recruitment levels for other years that show significantly different levels of recruitment.
In contrast to the pelagic juveniles, there was no difference in the diet of the demersal juveniles among the three years. This indicates that food availability did not differ greatly during the study period and/or the prey items were abundant enough for their feeding, although we have no data on prey density in the near bottom layer in May–June to confirm this conclusion. This would also be related to the active feeding behaviour of demersal juveniles that have enough swimming ability to search for their favourable prey items. Our results suggest that if T. japonicus successfully survive the pelagic juvenile stage, they can reach a habitat with favourable food conditions in the near bottom layer of the southern and central ECS where C. sinicus densities are consistently high (Chen, Reference Chen, Zhou, Liang and Zeng1994; Wang et al., Reference Wang, Zuo and Wang2003; Xu & Chen, Reference Xu and Chen2007). Thus, we conclude that the survival rate during the demersal juvenile stage is relatively stable among years. Inter-annual variations in abundance of demersal juveniles in May–June have been shown to correlate with the recruitment of the T. japonicus stock in the ECS (Yoda et al., Reference Yoda, Kuroda and Takahashi2017), which supports our conclusion.
Our results suggested that inter-annual fluctuations in food availability, especially P. parvus s.l. and C. sinicus, during spring is one of the key factors determining the growth and survival of the pelagic juveniles, and possibly subsequent year-class strength in the ECS. As a next step, we need to analyse the mechanism of fluctuations in densities of P. parvus s.l. and C. sinicus during spring in the nursery ground of T. japonicus in detail. In addition, factors other than food availability, such as transport processes of larvae and pelagic juveniles and abundances of predators and competitors for prey may also affect fluctuations in early survival of T. japonicus. Comprehensive information on factors potentially affecting early survival is needed for understanding of the mechanism of inter-annual variations in recruitment of T. japonicus to allow forecasts of annual recruitment levels.
ACKNOWLEDGEMENTS
We are grateful to the captains, officers and crews of the RV ‘Yoko-Maru’ and ‘Kumamoto-Maru’ for their assistance in the field. We thank anonymous reviewers for their insightful comments and suggestions for improvements of the earlier versions of manuscript. In addition, we are grateful to Dr Y. Tsukamoto of Hokkaido National Fisheries Research Institute, Japan Fisheries Research and Education Agency for valuable discussions during the course of this study. We also thank Mr K. Furusawa of the Marine Biological Research Institute of Japan Co. Ltd. for helping with the identification and counting of prey items.
FINANCIAL SUPPORT
This work was partially supported by grants from the Dynamics of Commercial Fish Stocks (DoCoFis) programme of the Fisheries Agency of Japan.