Introduction
Temperate glacier motion can be divided into two components: internal deformation and basal sliding (Sugden and John, 1976). Internal deformation is the flow of ice within a glacier in response to stress applied by the force of gravity. Basal sliding involves the movement of a glacier over its bed, enhanced flow close to the bed, and/or the deformation of sediment underlying a glacier. A good understanding of the mechanics and spatial and temporal variability of these processes is important to enable the accurate formulation of predictive equations for glacier motion (Harbor, 1993). A good knowledge of glacier dynamics is also necessary to understand the role of glaciers in climate change (Budd and Smith, 1981), as well as the processes of glacial erosion and deposition that drive landform and landscape development (Harbor, 1992).
The deformation of ice has been studied extensively in the laboratory, and the results form the basis of what has been termed Glen’s flow law (Glen, 1955):

where  is the shear strain rate, τ is the effective shear stress (a function of gravity, ice density, ice thickness, surface slope, and a shape factor related to the width and depth of the glacier), A is a constant related to ice temperature and other factors, and n is an exponent with a mean value of 3 (Paterson, 1994). The general form of the law is well known, but the lack of extensive field testing under a variety of glaciological conditions and scales limits its predictive value. Past studies have obtained up to an order-of-magnitude difference in strain rate for a given shear stress and temperature, and values of n have varied from 1.5 to 4.2 (Weertman, 1973). This is partly because factors not included in the flow law such as the deformation history of the ice, and longitudinal stresses, influence the strain rate at a particular location (Paterson, 1994).
Our understanding of the magnitude and spatial and temporal variability of basal sliding is also relatively limited due to the physical inaccessibility of the base of glaciers. There have been some direct measurements of basal sliding (e.g. Kamb and LaChapelle, 1964; Theakstone, 1967, 1979: Vivian, 1980; Anderson and others, 1982; Blake and others, 1994; Rea and Whalley, 1994), but the generally poor spatial and temporal resolution of these records limits the ability to draw general conclusions. Given this limitation, some studies have used variations in surface velocity as an indicator of variations in basal sliding (e.g. Hodge, 1974; Iken and Bindschadler, 1986; Jansson, 1995). These studies have used Glen’s flow law to predict the proportion of surface motion due to ice deformation, and then attributed the remaining motion to basal sliding. This approach is problematic, however, as basal sliding is not being measured directly, the accuracy of Glen’s flow law in these applications is unknown, and the determination of basal sliding by numerical inversion of surface velocities magnifies measurement errors exponentially with depth (Bahr and others, 1994).
A better way to determine the internal deformation and basal sliding of temperate glaciers is to measure the deformation of ice directly. This allows evaluation of the parameters in Glen’s flow law and, when linked to surface velocity measurements, provides a measure of basal sliding. As discussed below, virtually all field-based studies of the
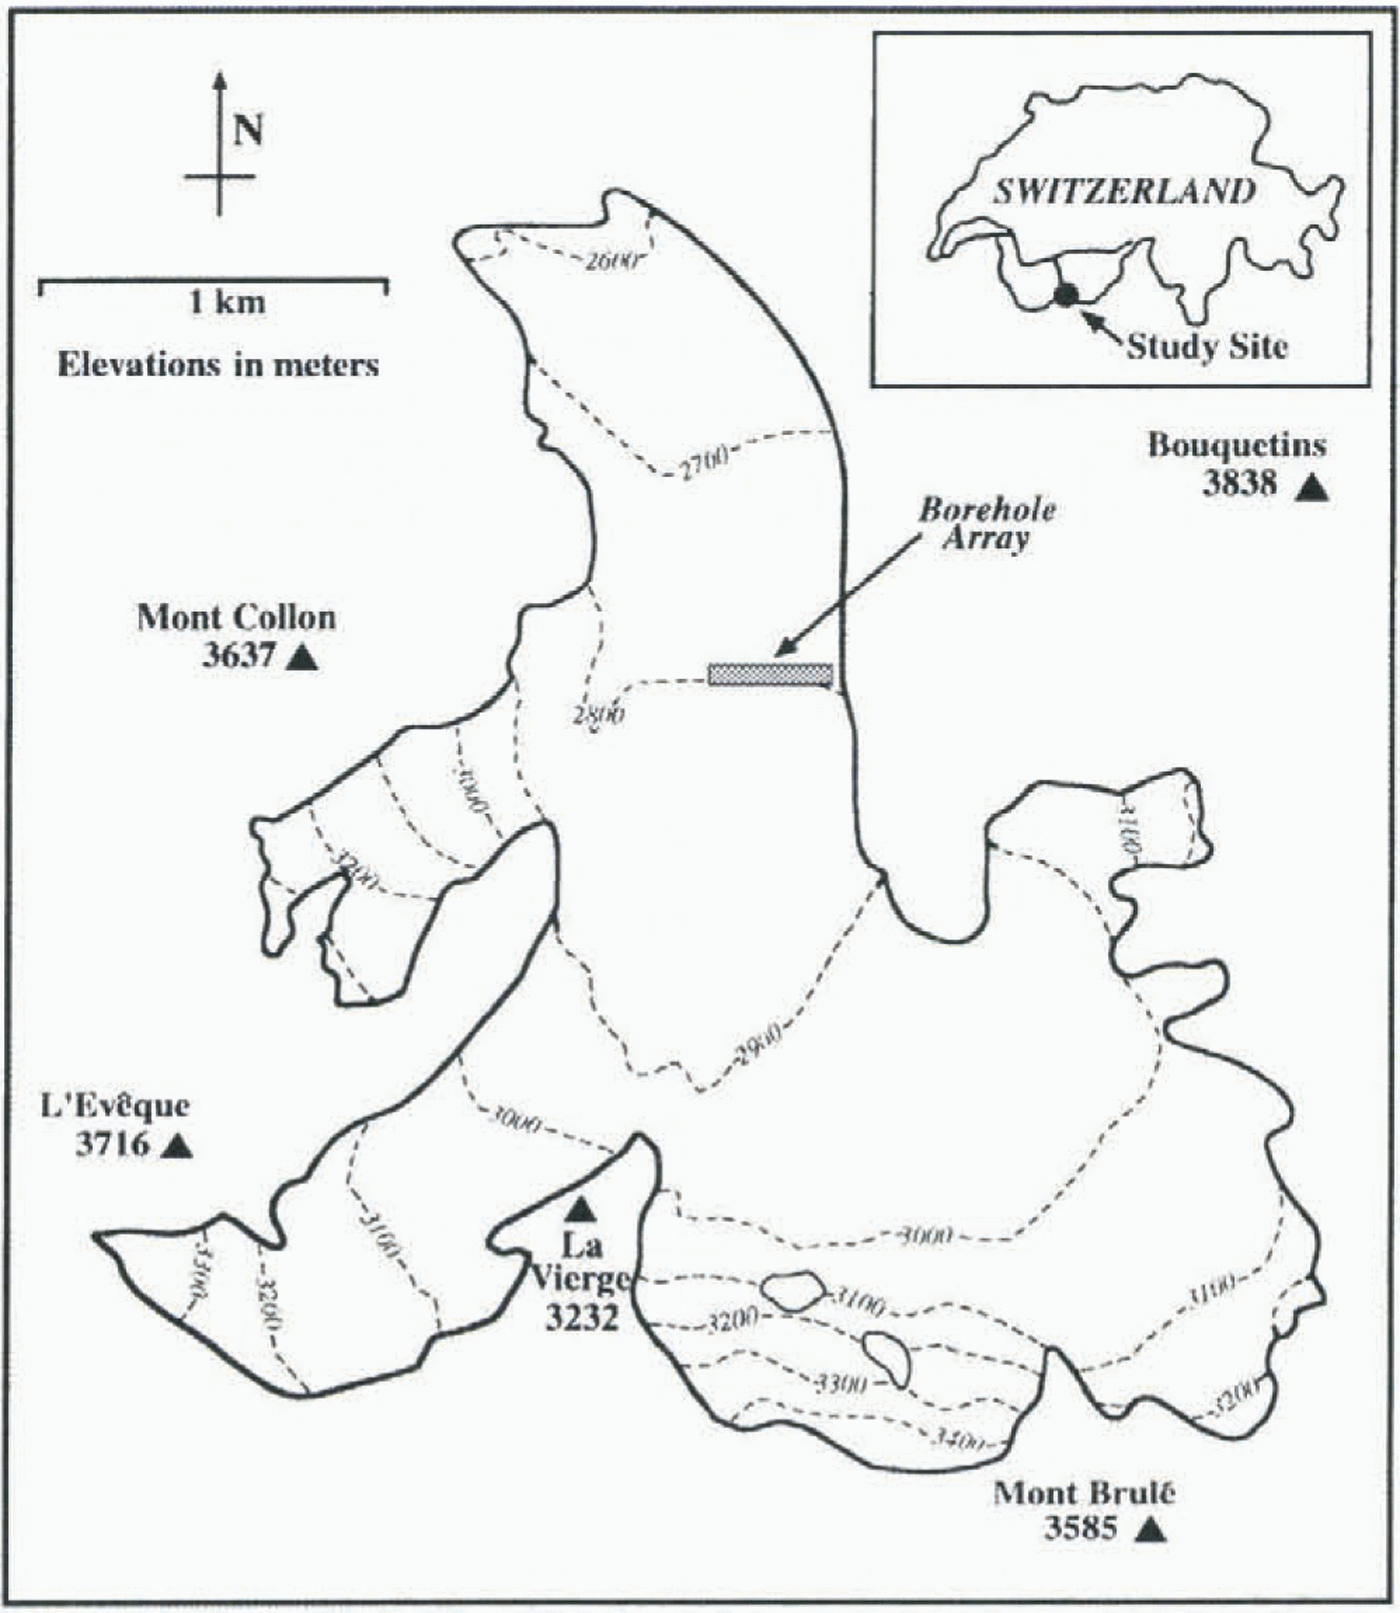
Map of Haut Glacier d’Arolla, Switzerland. The borehole array was located towards the eastern margin of the glacier, approximately 1.5 km from the terminus.
deformation of ice have involved measuring the change in longitudinal shape over time of glacier boreholes with an inclinometer (the longitudinal shape of a borehole refers to the vertical profile from the glacier surface to the glacier bed). The initial longitudinal borehole shape is determined by measuring the azimuth and tilt of the inclinometer at a series of locations from the surface to the base of a borehole. The deformation rate with depth and over time is then determined by measuring the difference in longitudinal shape of the same borehole at a later date.
Most ice deformation studies have been based on inclinometry measurements of variations in tilt along cased boreholes. The advantage of casing is that the azimuth of the inclinometer is known, as the orientation of the casing is assumed to be constant along the borehole length. Perutz (1947, 1949, 1950) was the first to use this technique, at Jungfraujoch in Switzerland, and since then similar studies along boreholes cased with steel, aluminum or plastic have been reported by Gerrard and others (1952), Sharp (1953), Miller (1958), Paterson and Savage (1963), Savage and Paterson (1963), Shreve and Sharp (1970), Hooke (1973), Hooke and Hanson (1986) and Hooke and others (1987, 1992). Borehole casing is expensive, time-consuming, and logistically complex, however, and there are several potential problems. For example, movement of the casing may occur independently of the ice (Hooke and others, 1992), and the fact that maximum displacements tend to occur at joints in the casing (personal communication from V. A. Pohjola, 1996) suggests that casing influences measurements of ice deformation. Errors due to twisting of the borehole casing will also violate the assumption of a constant inclinometer azimuth (Blake and Clarke, 1992).
This paper describes the use of a digital borehole inclinometer to measure patterns of internal deformation and basal sliding at Haut Glacier d’Arolla, Switzerland. The inclinometer used contained a magnetometer for azimuth control, meaning the boreholes did not need to be cased. This removed many of the problems discussed above, and allowed the rapid profiling of a large number of boreholes. The inclinometry measurements taken in 1995 comprise part of a larger study to measure the patterns of ice flow, basal sliding and water pressure across a temperate valley glacier. In the future, these measurements will serve as inputs to a computer model to improve estimation of glacier flow and sliding law parameters.
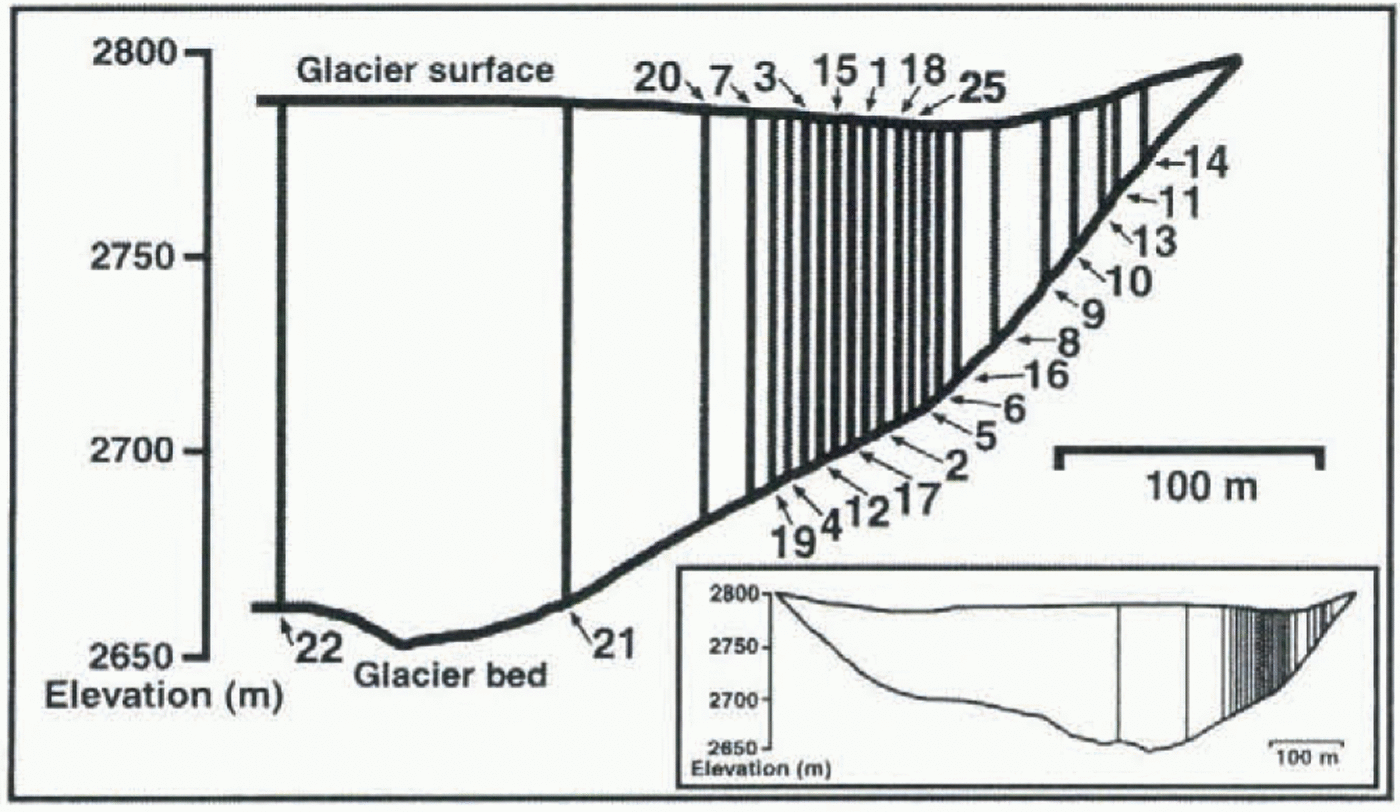
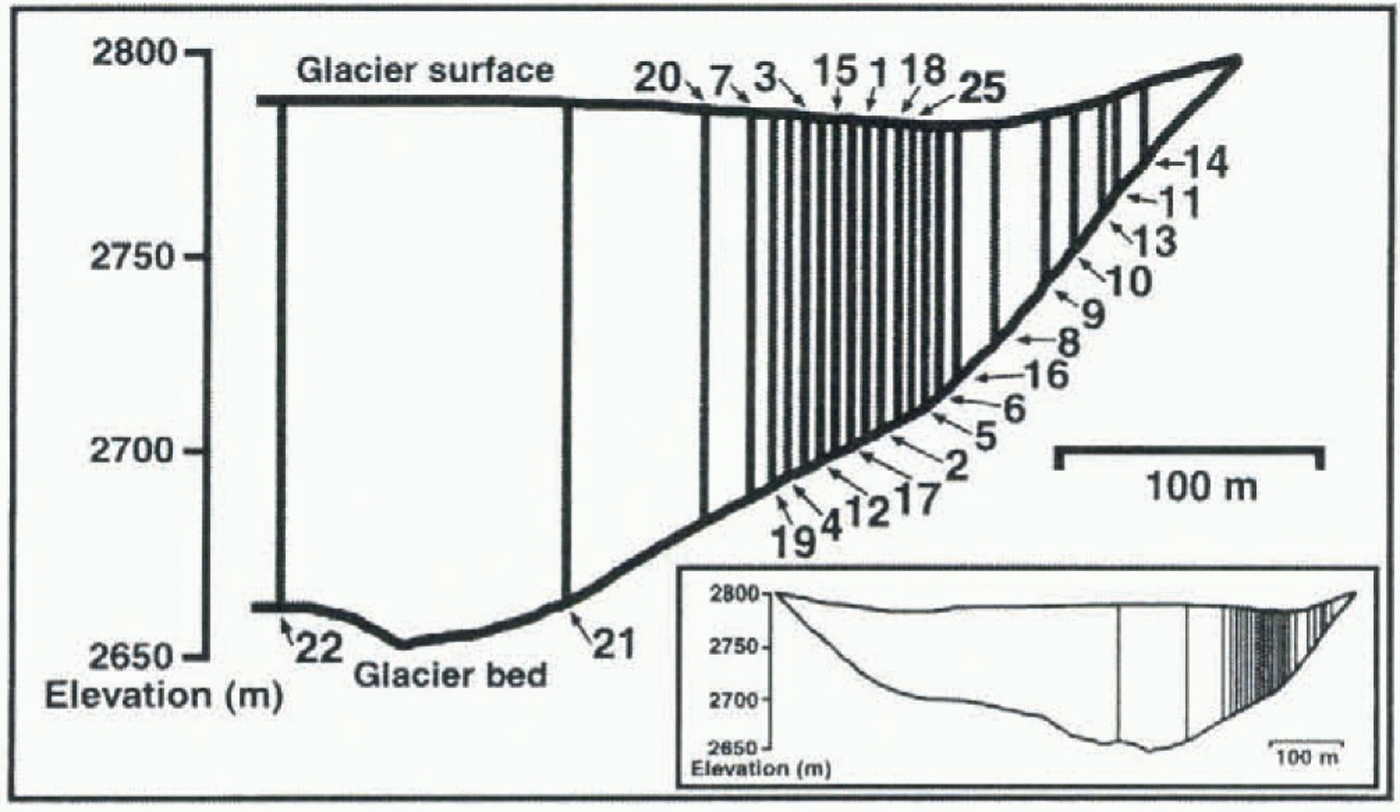
Cross-section of Haut Glacier d’Arolla, showing location of boreholes profiled with the inclinometer in summer 1995. The numbers signify borehole location.
Field Site And Methodology
Haut Glacier d’Arolla is a temperate valley glacier located in the Alps of southern Switzerland (45°58′ N, 7°32′ E; Fig. 1). The glacier ranges in elevation from approximately 2560 to 3500 m, is predominantly north-facing and is about 4.5 km long. A high-pressure hot water drilling program was initiated 1.5 km from the glacier terminus in 1992, and has continued every summer since. Approximately 25 boreholes have been drilled per year, and these have provided information about the hydrology and dynamics of the glacier (Hubbard and others, 1995; Lamb and others, 1995; Copland and others, 1997, in press; Tranter and others, in press).
Twenty-five boreholes were drilled across a section of Haut Glacier d’Arolla in July and August 1995 (Fig. 2). Of these, 23 were profiled with the inclinometer soon after drilling, and 14 were re-profiled up to 6 weeks later to determine changes in borehole shape with time. It was not possible to re-profile all of the boreholes, due to the presence of in situ probes, and partial closure due to ice deformation and the freezing of water. Besides the main surveys, three of the boreholes were profiled 14 times each to assess the accuracy and reproducibility of the inclinometry measurements.
Borehole inclinometry
The borehole inclinometer was manufactured by Mountain Watch Inc., and consists of a flux-gate magnetometer and two force-balance tilt transducers housed in a 2 m long stainless-steel waterproof tube. The inclinometer is digital and connected to a portable computer, which allows rapid data collection and observation of the borehole shape during profiling. A full technical description of an analog version of the inclinometer is provided by Blake and Clarke (1992). The longitudinal shape of a borehole was determined
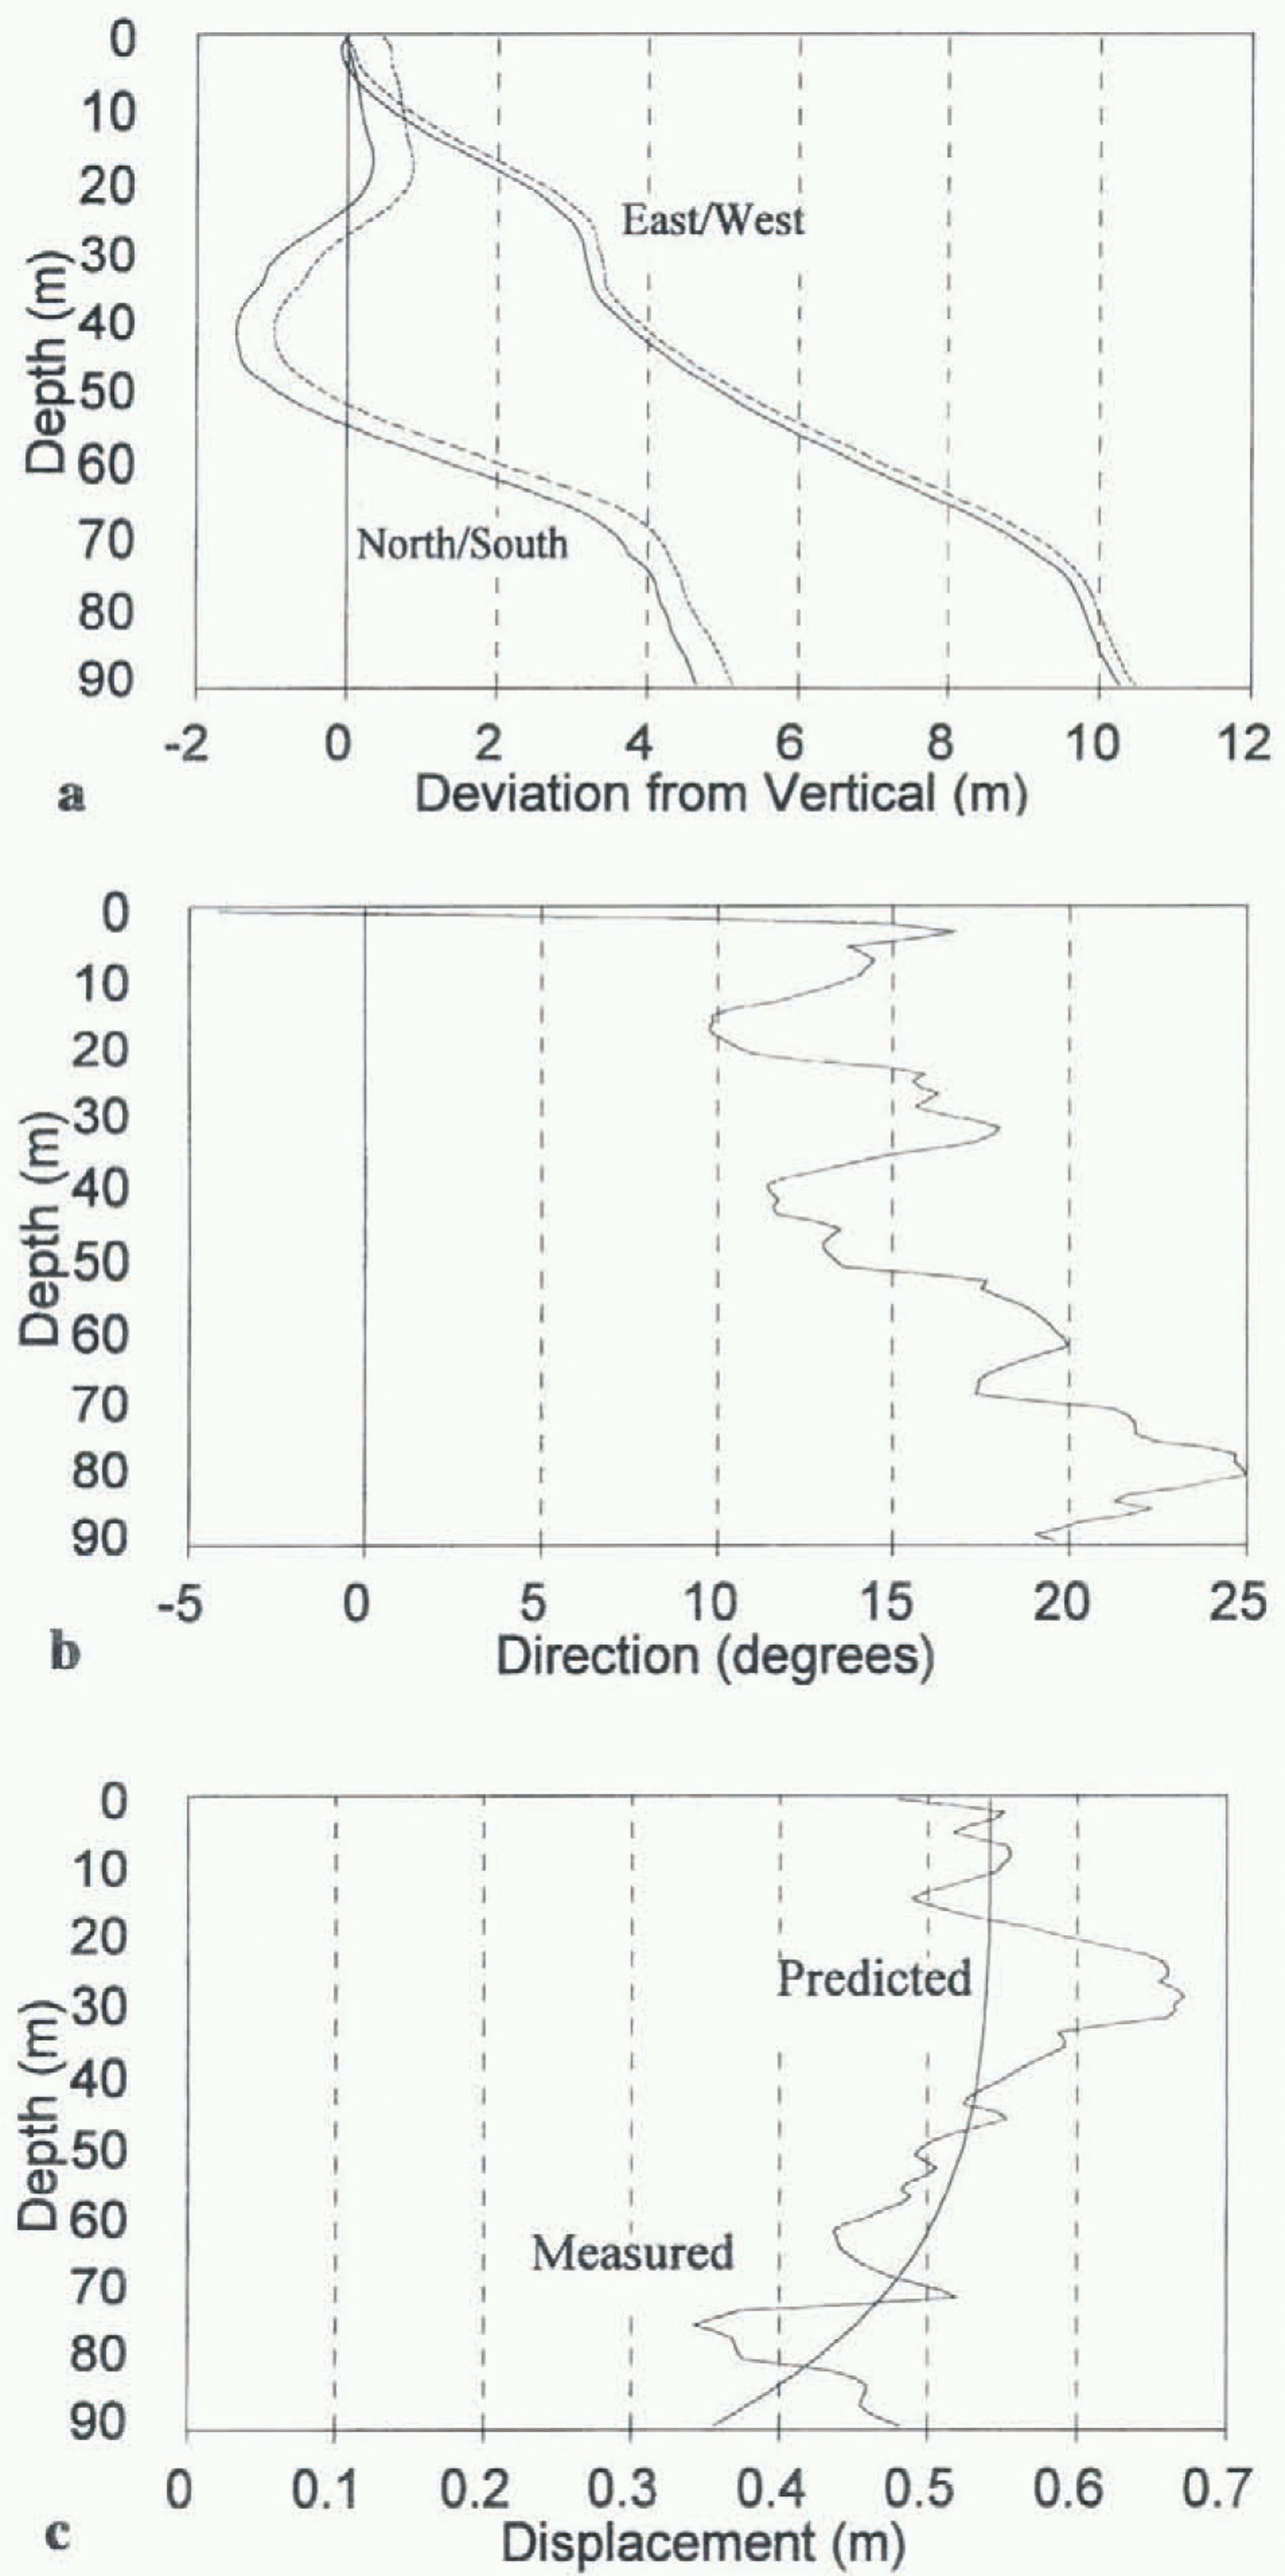
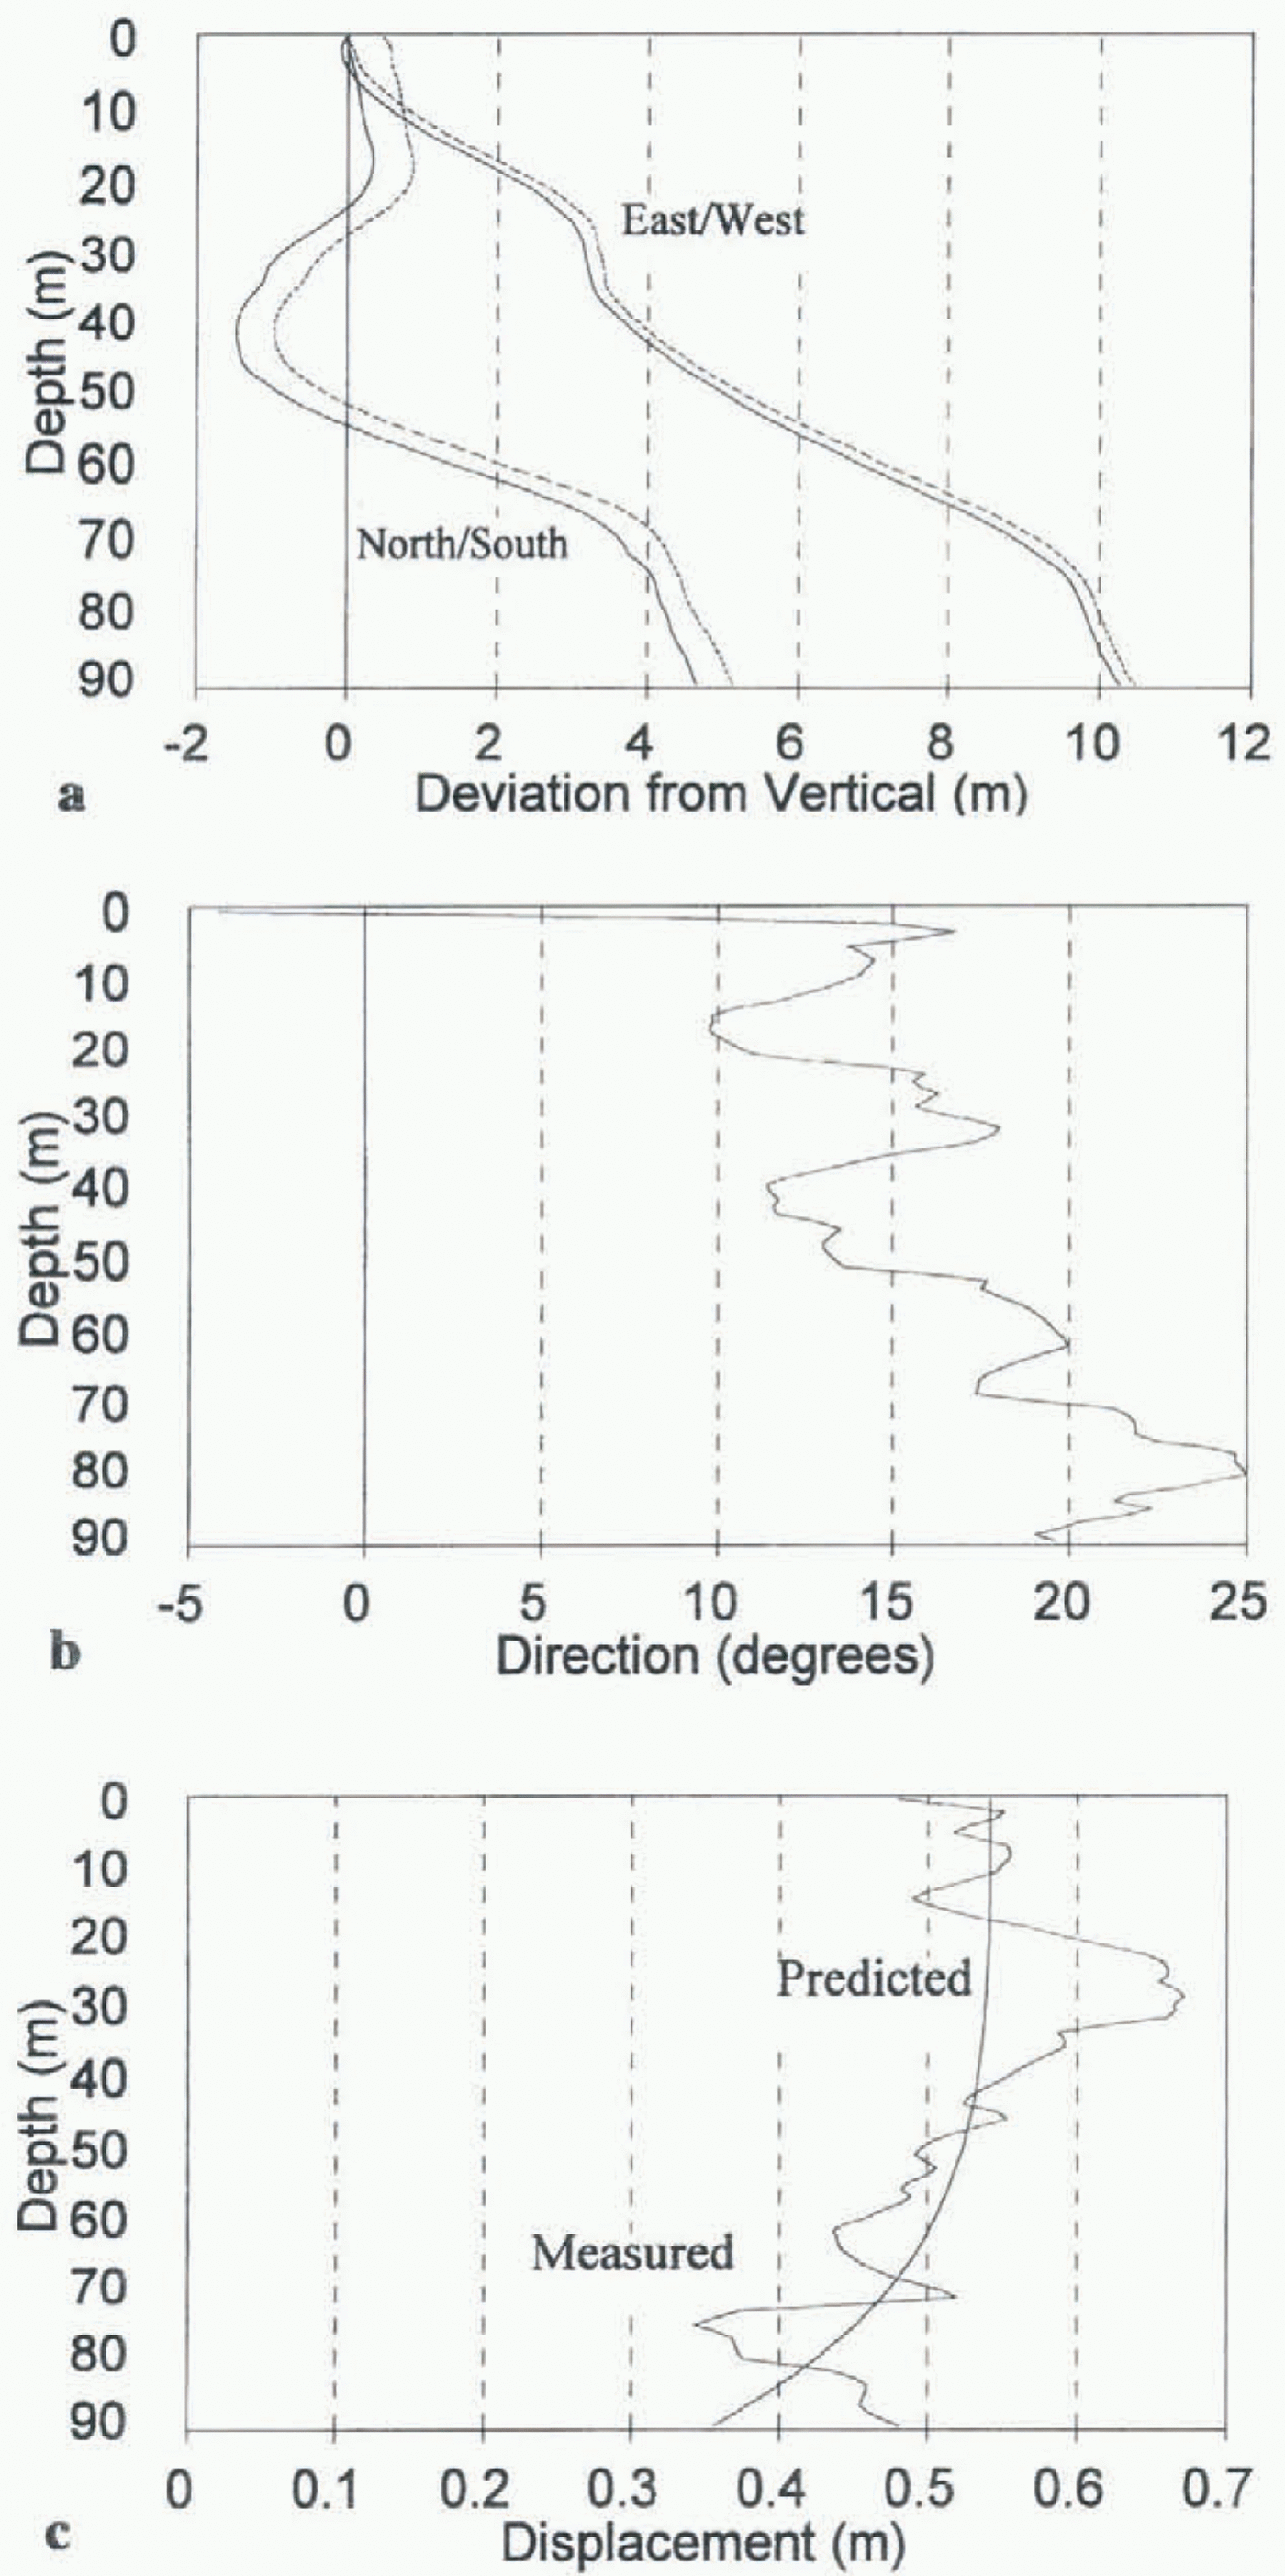
(a) Mean profiles of borehole 95 / 2 on 4 and 22 August 1995. Borehole orientation is divided into north–south and east–west components (north and east are positive, south and west are negative). Solid lines show the original borehole profile, and dotted lines show the later profile. Note the difference in scale between the horizontal and vertical axes. (b) Displacement direction of borehole 95 / 2 between 4 and 22 August 1995. 0° is pointing north, with positive and negative angles referring to displacements to the east and west of north, respectively, (c) Comparison of the measured displacement with depth of borehole, 95 / 2 between 4 and 22 August 1995, and the pattern of ice deformation with depth predicted by Glen’s flow law.
by recording the tilt and azimuth of the inclinometer at 1 m intervals along the borehole length. This process was repeated in the up and down directions, with the final borehole profile constructed from the mean of these measurements. Blake and Clarke (1992) estimate that their inclinometer was able to locate the bottom of a 70 m borehole to within 0.2–0.3 m. The borehole lop locations were also surveyed close to the date of the inclinometry profiles using a Geodimeter Total Station with an accuracy of ± (2 mm + 3 ppm). This provided information on the surface motion of the glacier, and allowed estimation of the relative importance of internal deformation and basal sliding.
Results And Discussion
Individual borehole profiles provided information about borehole depth, basal location and longitudinal shape. The boreholes were not straight, but tended to deviate increasingly from vertical with depth. For example, borehole 95/2 was 94 m deep, and the basal location lay 4.9 m to the north, and 10.6 m to the east, of the surface location (Fig. 3a). The longitudinal shape of the boreholes was confirmed by the
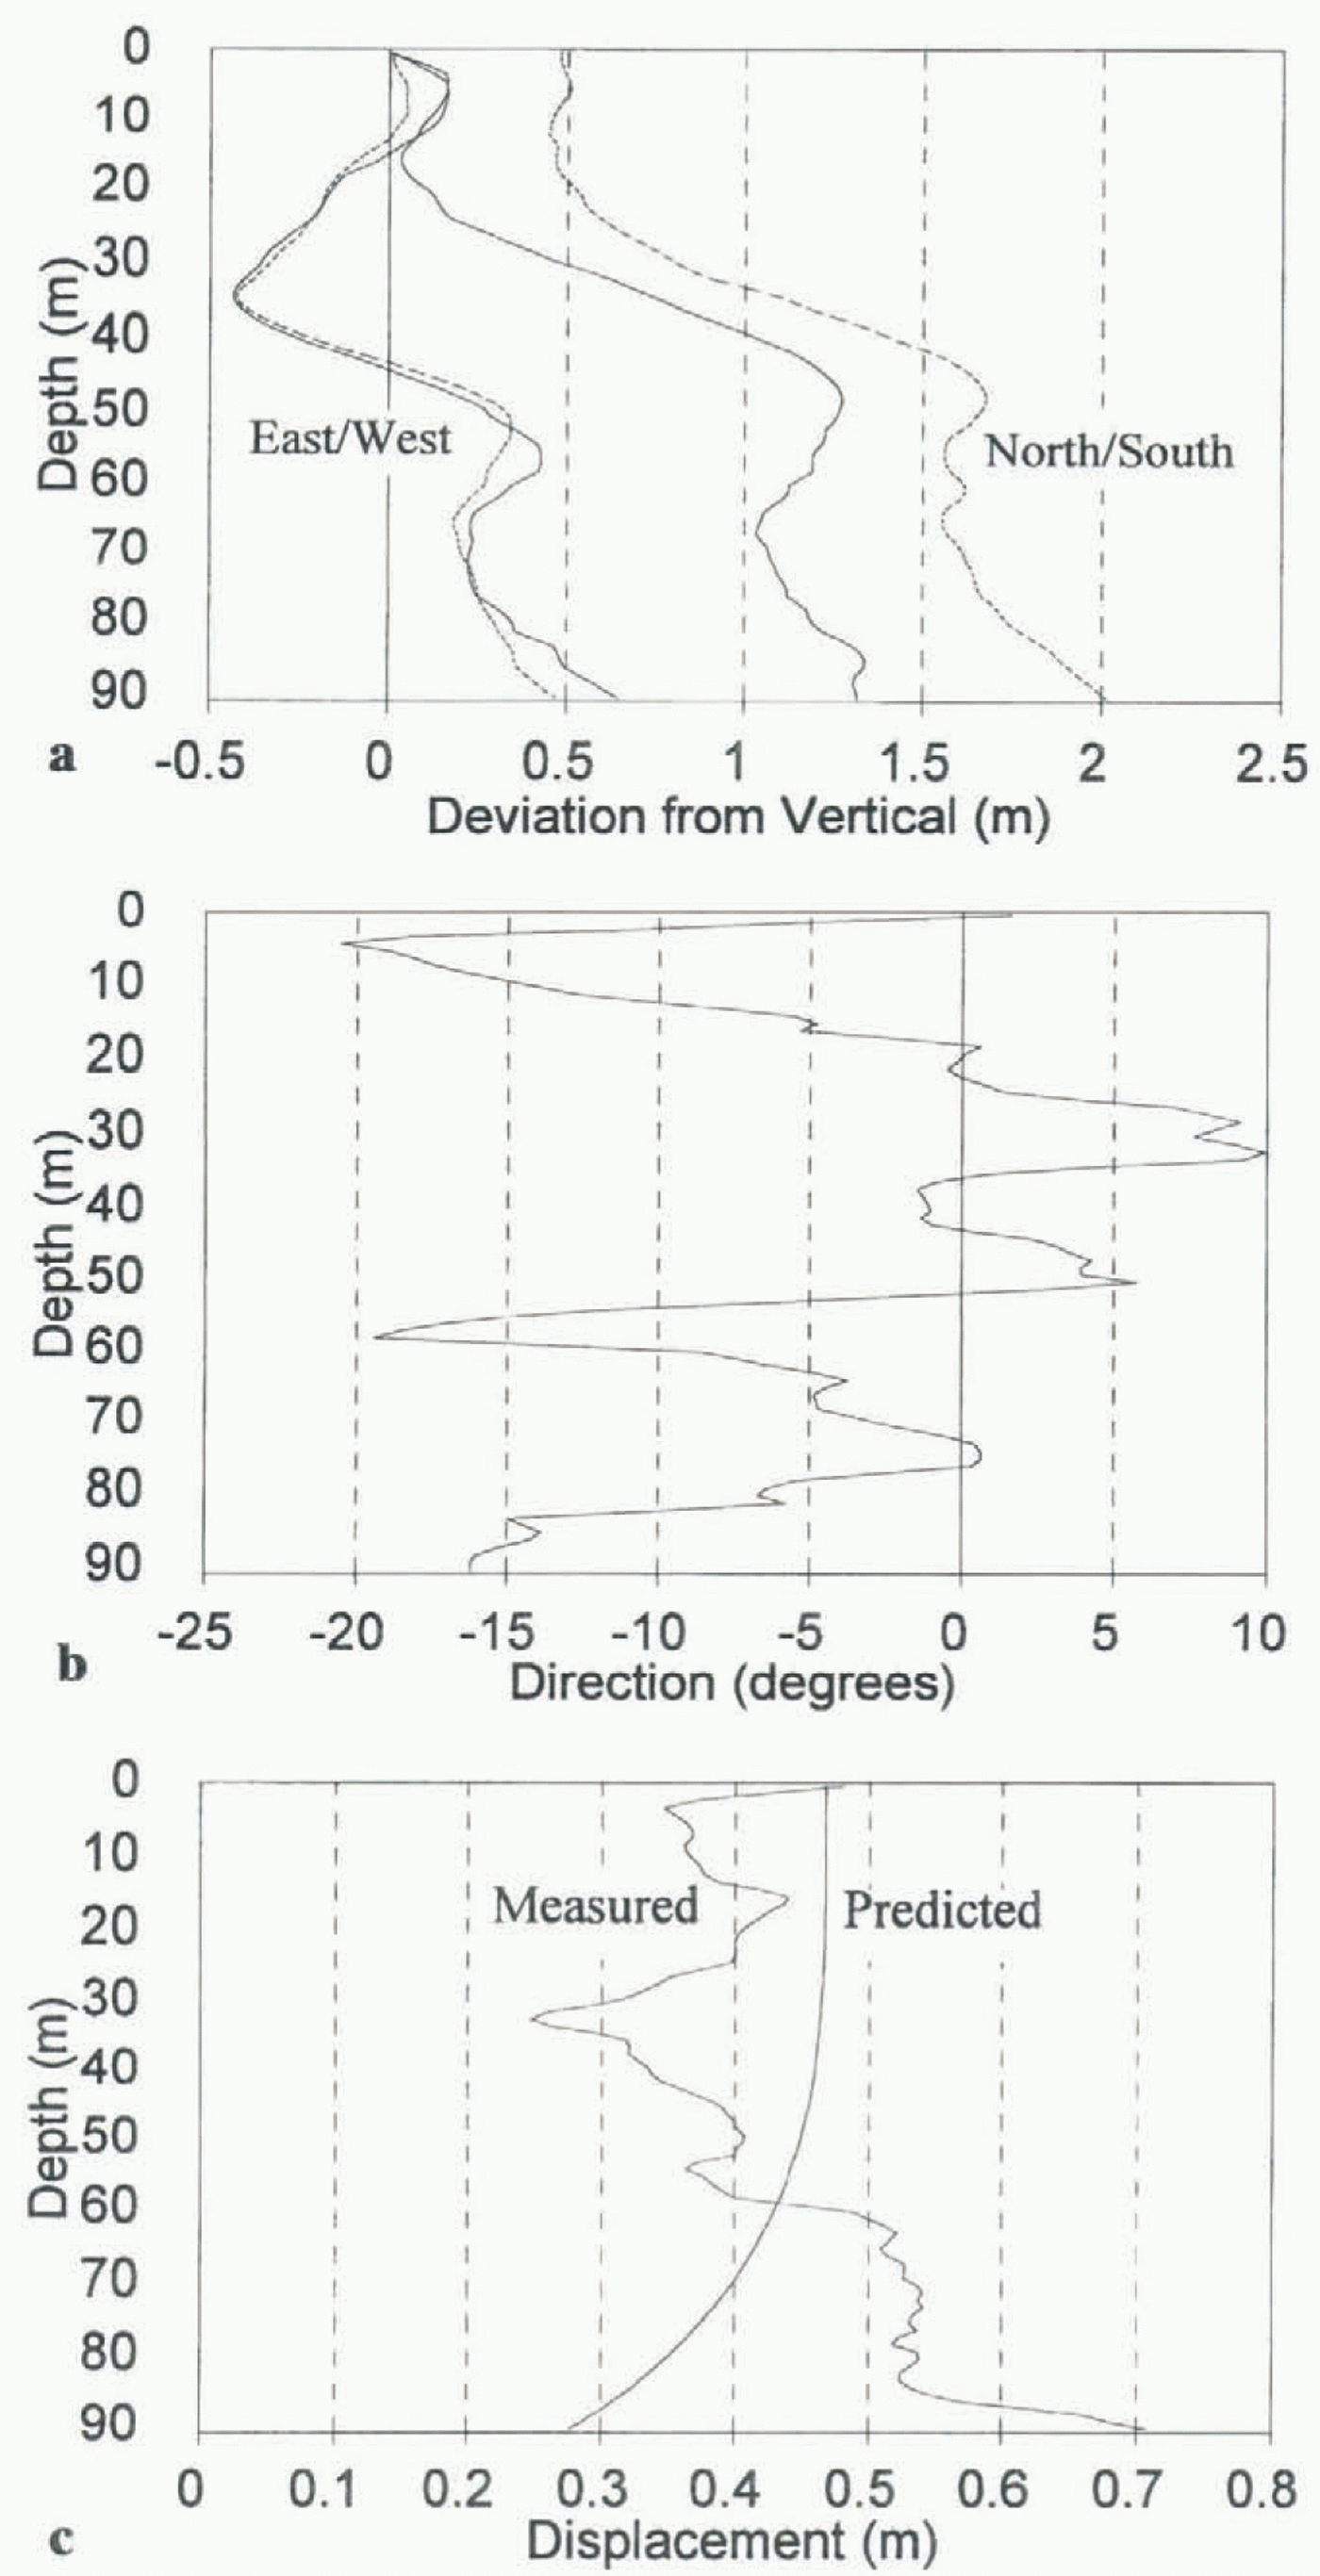
(a) Mean profiles of borehole 95 / 15 on 5 and 23 August 1995. Solid lines show the original borehole profile, and dotted lines show the later profile, (b) Displacement direction of borehole 95 / 15 between 5 and 23 August 1995. 0° is pointing north, with positive and negative angles referring to displacements to the east and west of north, respectively, (c) Comparison of the measured displacement with depth of borehole 95 / 15 between 5 and 23 August 1995, and the pattern of ice deformation with depth predicted by Glen’s flow law.
fact that repeated measurements showed the same general profile, and that major changes in borehole orientation correlated well with borehole video observations (Copland and others, 1995). It was assumed that the non-verticality of the boreholes did not affect the deformation calculations as these were based on the changes in longitudinal borehole profiles between surveys, rather than the absolute profiles. The boreholes were probably not straight, because they were drilled manually. This meant that the tension on the drill could not be closely controlled, and that the drill tip occasionally rested on the base of a borehole during drilling. When this occurred, a change in borehole orientation most likely resulted from tilting of the drill stem.
It is important to know accurately the longitudinal shape of boreholes, as many measurements rely on a good knowledge of the location of englacial and subglacial sensors. For example, the measurement of subglacial resistivity (Brand and others, 1987) requires determination of the location of electrodes within adjacent boreholes. Models of subglacial hydrology (Hubbard and others, 1995) also require knowledge of the spatial distribution of water-pressure sensors at the base of boreholes.
Borehole re-profiling
Fourteen boreholes were re-profiled at least 2 weeks after the first profiling (figs 3 and 4). The amount and direction of ice deformation with depth was determined from the change in longitudinal shape of the boreholes, combined with survey data for the change in borehole top location.
All boreholes showed motion to the north (Figs 3b and 4b), which was expected given that the glacier surface generally slopes downwards in this direction. The patterns of borehole displacement with depth were not as consistent or easy to interpret, however. To provide general context for the results, the patterns of borehole displacement were compared with predictions of ice deformation from the one-dimensional form of Glen’s flow law. The values suggested by Paterson (1994) for a parabolic-shaped temperate glacier with a surface slope angle of 7° were used in the calculations. To account for the effects of basal sliding, a constant was added to the predicted deformation profile so that the tops of the measured and predicted deformation profiles matched. Using this technique, the measured displacement of borehole 95/2 matched reasonably well with that predicted by Glen’s flow law, and basal sliding accounted for approximately 60% of total motion Fig. 3c). In contrast, the measured displacement of borehole 95/15 deviated markedly from that predicted by Glen’s flow law (Fig. 4c). Borehole 95/15 appeared to show extrusion flow (Demorest, 1942; Streiff-Becker, 1953), as the base of the borehole was displaced more than the surface (Fig. 4c). However, Nye (1952) showed that extrusion flow is unlikely to occur, as rapidly moving ice at the base of a glacier should carry the layers above at an equal speed. When combined with ice deformation, the total velocity should always increase towards the surface of a glacier (although Hooke and others (1987) argued that extrusion flow occurred at Storglaciären under unusual conditions such as bed decoupling). The proximity of boreholes 95/2 and 95/15 (Fig. 2) suggests that the extrusion flow tentatively suggested by borehole 95/15 was not real, but was probably a function of the measurement process, as discussed in more detail later.
The borehole deformation patterns identified by inclinometry
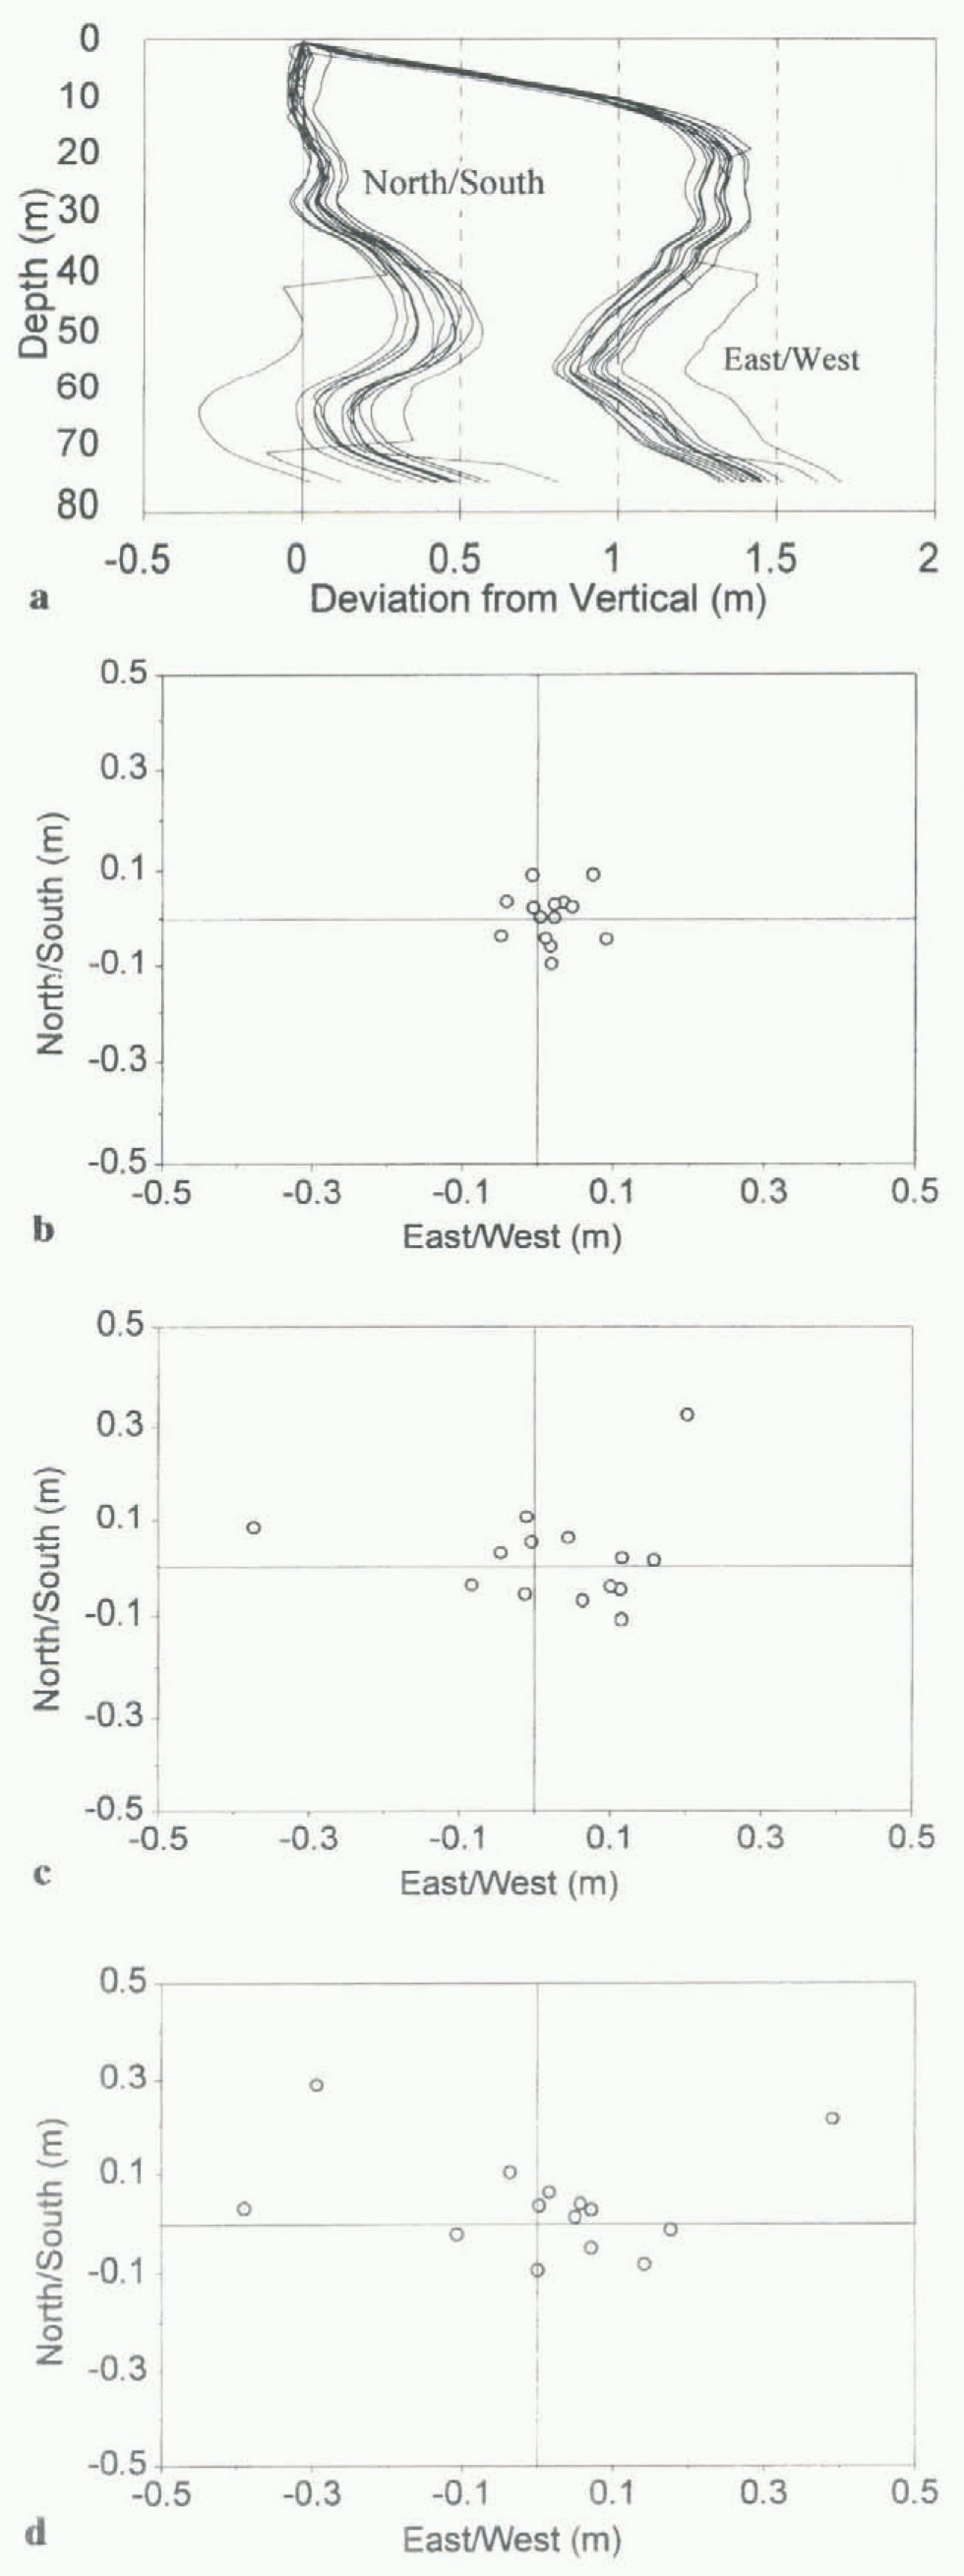
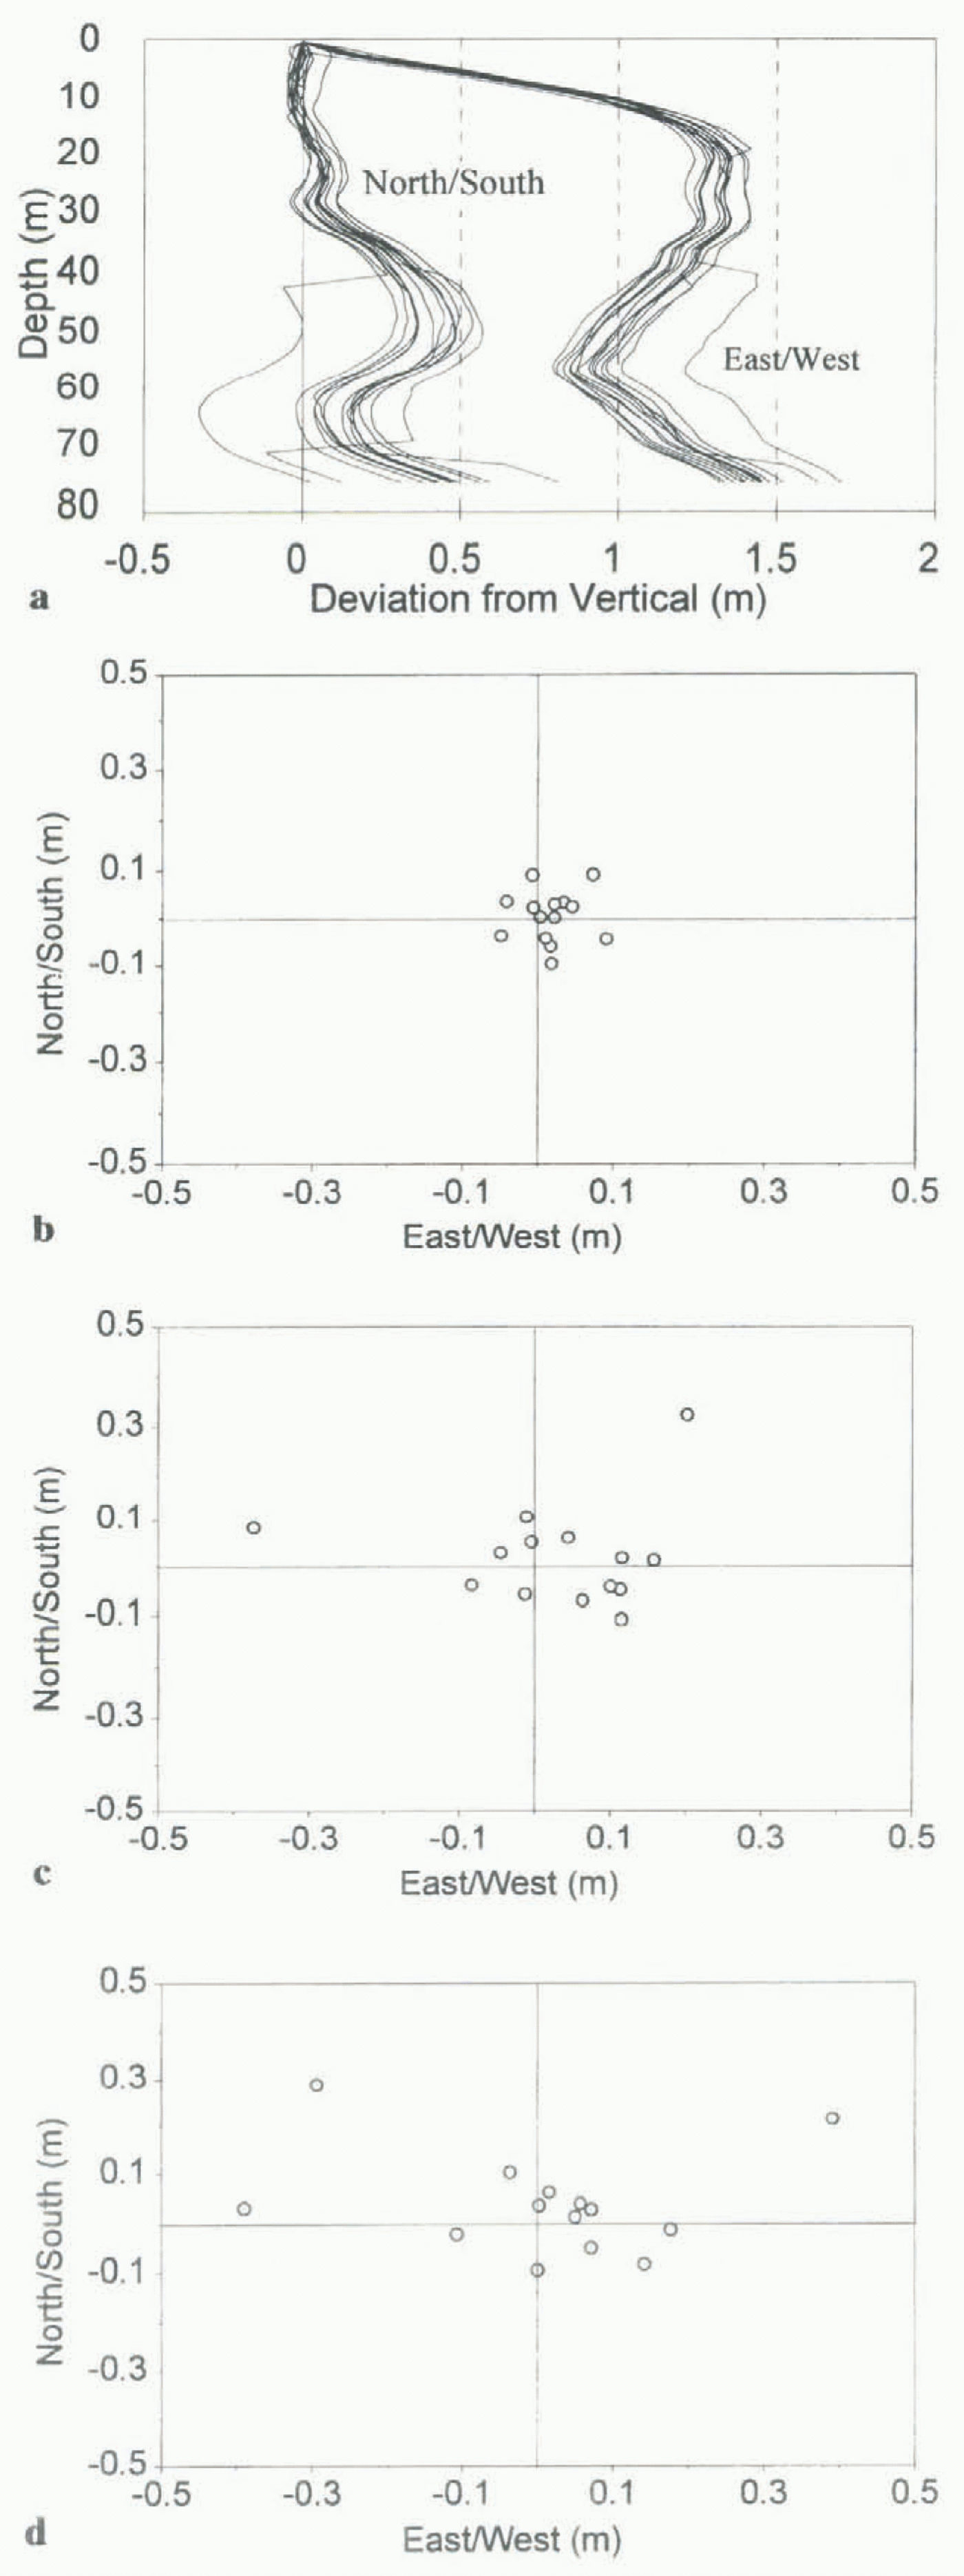
(a) The 14 profiles of borehole 95 / 25 used to check the accuracy and reproducibility to the inclinometry measurements. Note the marked increase in scatter of the measurements at locations where the borehole changes orientation. (b) Scatter of the measurement points around the arithmetic mean at one-third of the depth of borehole 95 / 25. (d) Scatter of the measurement points around the arithmetic mean at two-thirds of the depth of borehole 95 / 25. (d) Scatter of the measurement points around the arithmetic mean at the base of borehole 95 / 25.
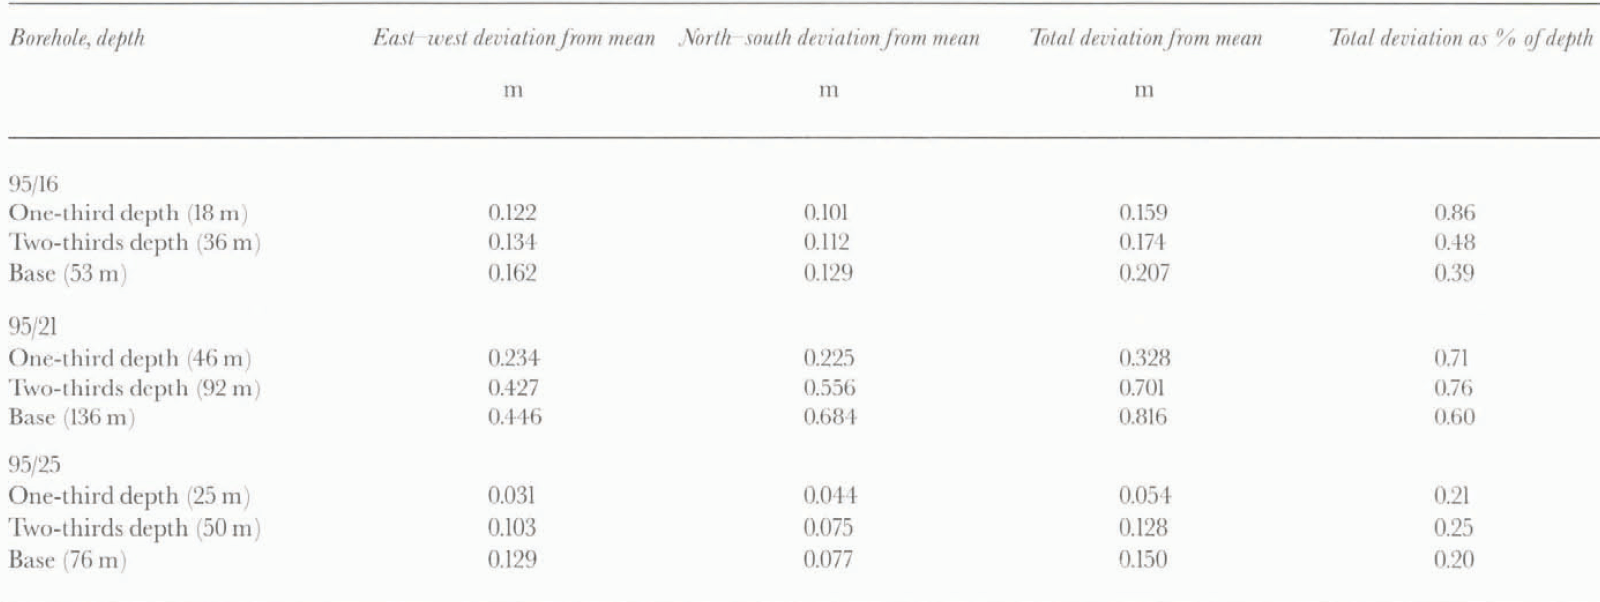
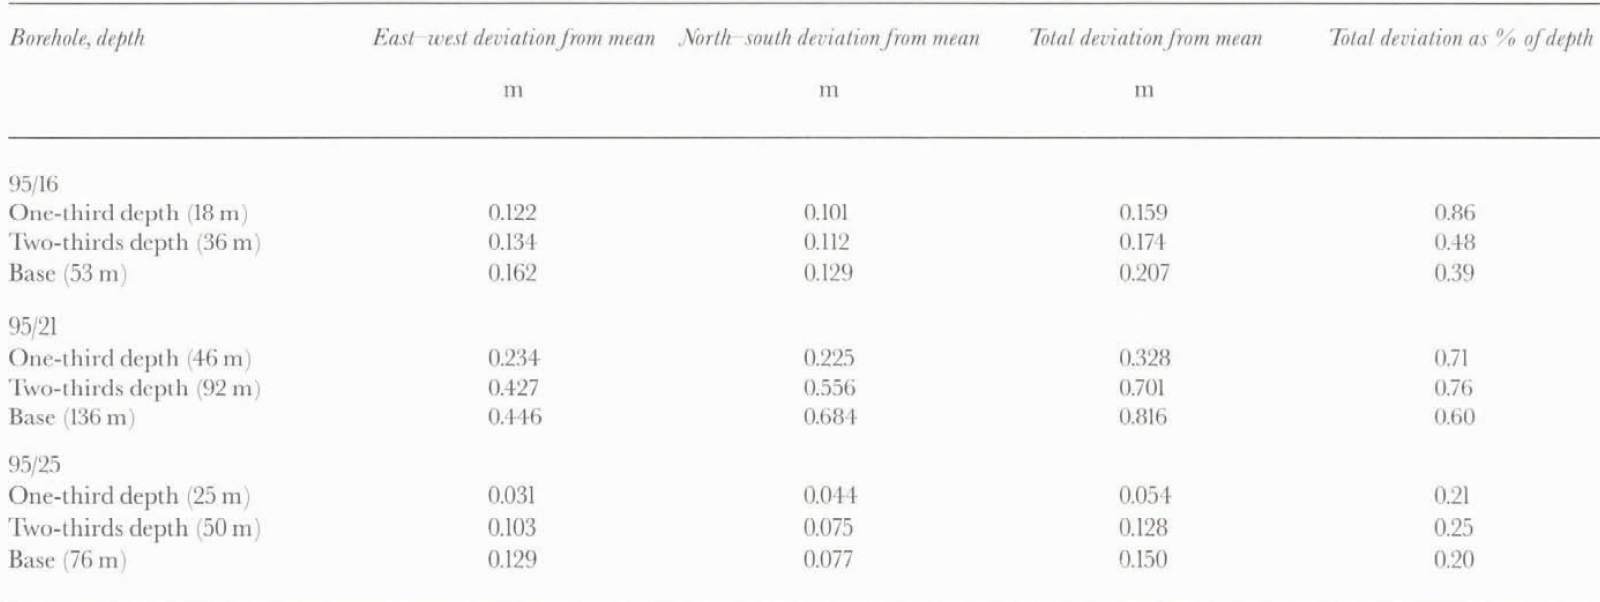
Average deviation of the inclinometry measurements from the mean profile in the boreholes in which repeat measurements were made. The mean profile was calculated as a simple arithmetic mean of all 14 repeat measurements. The north–south and east–west components of the total deviation are provided, together with the average deviations expressed as a percentage of the measurement depth
in the other boreholes were also valuable. As with boreholes 95/2 and 95/15, some boreholes showed the expected Glen-type flow pattern, others appeared to show extrusion flow, while others showed no consistent pattern of ice deformation with depth. Despite these variations, it was possible to estimate the relative importance of basal sliding and internal deformation by using Glen’s flow law to predict the component of the surface motion due to ice deformation. Differences between the predicted and measured surface motion were attributed to basal sliding. Using this technique, basal sliding accounted for an average of 75% of total surface motion in the measured boreholes. There were marked spatial variations in the basal sliding patterns, however, with boreholes near the glacier margin showing up to 99% basal sliding (e.g. 95/11, 95/13, 95/14; Fig. 2), while some boreholes near the glacier center appeared to show no basal sliding (e.g. 95/21, 95/22). The available evidence suggests that basal sliding does occur at the center of Haut Glacier d’Arolla, however, as variations in water pressure correlate with variations in surface motion (Nienow, 1995). For basal sliding to be important at the glacier renter, internal deformation would have to be substantially less than predicted by simple application of Glen’s flow law. Longitudinal and lateral stress gradients provide a likely explanation for this pattern as high friction at the margins of the glacier, and interactions with up-glacier and down-glacier areas, will affect the patterns of glacier motion at a particular point.
Repeat measurements
Although there has been some previous field testing of an analog inclinometer similar to the digital one used in this study (Blake and Clarke, 1992), there remains a need to extend testing to a wider range of borehole depths, widths and shapes to improve understanding of the accuracy and reproducibility of digital inclinometry measurements. To test the reliability of the measurements made at Haul Glacier d’Arolla, boreholes 95/16, 95/21 and 95/25 were surveyed 14 times each (7 times each in the up and down directions). It was assumed that there was no significant ice deformation during these surveys as each set of 14 repeal measurements was completed in less than 2 d. These boreholes were chosen as a representative sample across the section of the glacier under study, as 95/16 was 53 m deep and located towards the margin of the glacier, 95/25 was 76 in deep and closer to the center of the glacier, while 95/21 was 136 m deep and near the center of the glacier (Fig. 2).
The repeat measurements were first used to ascertain if the survey of a borehole was biased if the inclinometry measurements were made in the down or up direction. For each of the three boreholes, this invoked comparing the mean of the measurements taken in the down direction at each depth against the mean of the measurements taken in the up direction. The mean profiles usually differed slightly between the down and up directions (7.9 cm difference between up and down measurements at the base of borehole 95/16, 55.5 cm at the base of 95/21, and 4.7 cm at the base of 95/25), but there was no systematic bias in the results towards one particular azimuth. This demonstrated that construction of the borehole profiles from the mean of down and up measurements in the main surveys did not bias the results, and was an effective way to minimize small measurement errors.
Once it was known that the inclinometry measurements were not biased by being made in the down or up direction, the 14 profiles of each borehole were analyzed together. All three sets of repeat measurements showed similar characteristics for the three boreholes, so borehole 95/25 will be used here as a representative example. One of the more noticeable features of the repeat measurements, as demonstrated by borehole 95/25 (Fig. 5), was the increase in scatter of the borehole profiles with depth. In particular, the scatter tended to increase at locations where the borehole changed orientation (Fig. 5a). Using the arithmetic mean of all 14 profiles as a representative profile, the average deviation from the mean increased with depth in all three boreholes (Fig. 5b–d; Table 1). This was expected, given the additive way in which the borehole profiles were constructed, as the borehole profile at depth depended on the measurements above. The relative size of the scatter generally decreased with depth, however, when expressed as a percentage of measurement depth (table 1). There was slightly more scatter in the east–west than the north-south direction for boreholes 95/16 and 95/25, but in borehole 95/21 this trend was reversed and there was more scatter in the north–south direction than the east–west direction. This demonstrated that the inclinometer was not biased towards one particular azimuth. figure 5a also shows that the borehole profile appeared to shift suddenly sideways by up to 0.5 m on a few surveys. This probably resulted from the inclinometer not settling in the borehole before a measurement was taken, and was minimized in later surveys by waiting longer at each measurement location to enable the tilt sensors to settle. These “rogue” profiles were included in the analysis of the repeal measurements to provide testing of the entire range of possible inclinometry measurements, but were excluded from analysis in the main borehole surveys. The exclusion of these profiles did not greatly affect the results, however, as only one “rogue” profile was identified in the main surveys of the boreholes.
From these results it was apparent that the inclinometry measurements were not biased by being made in the up or down direction, and were not biased towards one particular azimuth. The question remains, therefore, why it was not possible to determine a consistent pattern of ice deformation with depth in the various boreholes. One possible reason is that the deformation patterns were real. This seems unlikely, however, given the close proximity of boreholes with different apparent deformation patterns. For example, it is physically very difficult to explain how borehole 95/2 could move faster at the glacier surface than at the glacier bed (Fig. 3c) when it is within 20 m of borehole 95/15 which shows greater deformation at the bed than at the surface (Fig. 4c). It is also difficult to provide a physically sensible explanation for extrusion flow, except under unusual conditions (Hooke and others, 1987).
The most likely explanation is that ice deformation over the study period was relatively low compared to the accuracy of the inclinometry measurements. The surface motion was approximately 1.6 cm d−1 close to the glacier margin, and 3.0 cm d−1 near the center of the glacier (personal communication from D. Mair and P. Nienow, 1996). Even if all of the surface motion was due to internal deformation (which is unlikely), the maximum motion over the period of a month was less than 1 m. Given that the average deviation of the repeat measurements from the mean was 0.5% of ice depth, the measurements were accurate to about 0.5 m at the base of a 100 m borehole. This is a similar accuracy level to the 0.2–0.3 m at which Blake and Clarke (1992) could locate the base of a 70 m deep borehole. A displacement of less than 1 m is therefore difficult to distinguish when the error range is approximately 0.5 m. Consequently, measurements made in cases where surface velocities are on the order of 2 m or less between surveys are unlikely to provide an accurate measure of the rates or patterns of ice deformation.
Conclusions
This study reports one of the first times that large numbers of boreholes have been repeatedly profiled in a short time period, and has shown that digital inclinometry can be used to determine, the basal location, depth and longitudinal shape of boreholes. The accuracy level of these measurements, approximately 0.5% of ice depth, is important to know for effective interpretation of a range of borehole-based measurements. This study has also shown that digital inclinometry allows the rapid profiling of many boreholes without spending significant amounts of time and money to case them.
It was difficult to determine conclusively patterns of ice deformation with depth at Haut Glacier d’Arolla over the period of a month, although an estimate of the relative importance of basal sliding and internal deformation was possible. Of the total surface motion of Haut Glacier d’Arolla during the study period, Glen’s flow law predicted that approximately 75% was due to basal sliding, and 25% due to internal deformation, although this was highly spatially variable, To enable effective determination of ice deformation patterns with depth at Haut Glacier d’Arolla it would be necessary to profile boreholes over a longer time period; the change in borehole profiles between surveys should then be much larger than the potential errors in the inclinometry measurements. As a first step towards doing this, cables were placed in several boreholes at the end of the 1995 field season before the boreholes froze shut over the winter. In summer 1996 it is hoped that these cables can be used to direct drilling, so that the 1995 boreholes will be reoccupied. Inclinometry profiling of these reoccupied boreholes should then provide information about the patterns of ice deformation across Haut Glacier d’Arolla over a year.
Alternatively, a study over a single field season on a glacier with relatively high rates of surface motion (>2 m between measurements) should allow effective determination of ice deformation patterns. The drilling of initially straight boreholes should also help minimize scatter in the inclinometry measurements caused by changes in borehole orientation. The problem with a study on a fast-moving glacier, however, is that uncased boreholes are likely to close due to ice deformation.
The measurement of ice deformation on the annual scale at Haut Glacier d’Arolla will provide better information on long-term, temporally averaged patterns of glacier motion than measurements made over a few weeks. It can also improve the accuracy of short-term (sub-daily) estimates of basal sliding inferred from short-term measurements of surface velocity, by better constraining the form of Glen’s flow law. For applications such as predicting landform evolution (Harbor, 1992), the analysis of long-term patterns of glacier motion is probably most relevant. This is because the complexity and interaction of many different processes makes it extremely difficult, if not impossible, to formulate equations that are able to predict short-term variations in glacier motion over a range of glaciological conditions. In contrast, sliding and flow laws formulated to represent steady-state conditions are likely to enable at least longer-term predictions.
Acknowledgements
This research was funded by U.S. National Science Foundation grants OPP-9321350 and OPP-94963450, and the Canadian Natural Sciences and Engineering Research Council. The field assistance of B. Hubbard, P. Nienow, D. Mair, S. Cross, D. Gaselee, C. Pyle and all other 1995 Arolla Glaciology Project members is greatly appreciated.