INTRODUCTION
The Cantabrian Sea is a region strongly affected by fishing activities. In particular, trawling is the main human activity in terms of landings, number of vessels, number of jobs, etc. (Punzón et al., Reference Punzón, Pereda, Villamor and Gancedo1999; Punzón & Gancedo, Reference Punzón and Gancedo2000). At the same time, trawling is also one of the most damaging fishing activities affecting benthic habitats, and its disturbance on structural and vulnerable habitats has been widely described in the literature (North Sea, Barents Sea and Celtic Sea, e.g. de Groot, Reference De Groot1972, Reference De Groot1984; Fonteyne, Reference Fonteyne, Kaiser and de Groot2000). However, on the northern coast of Spain the information remains scarce. According to ICES (2005), it is essential to develop indicators and metrics at a regional scale that are suitable for assessing fishing impacts.
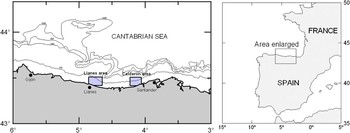
The continental shelf of the Cantabrian Sea is narrow and its benthic communities follow a patchy distribution which is highly dependent on depth and substrate type (Serrano et al., Reference Serrano, Sánchez and García-Castrillo2006). Along the inner shelf, in the vicinity of Llanes and Calderón (Figure 1), rocky outcrops predominate, and only small areas of fine sediments are accessible to trawlers. Due to high biodiversity of the coastal and inner shelf, and its role as a nursery ground for several commercial species, bottom trawling in the Cantabrian Sea is forbidden by Spanish legislation at depths shallower than 100 m. Nevertheless, illegal trawling operations are common. To prevent illegal trawling, artificial reefs (concrete blocks) have been deployed on some of these shallow, soft grounds by local fishery authorities (a description of the regulatory framework is available in Revenga et al., Reference Revenga, Fernández, González, Santaella, Jensen, Collins and Lockwood2000).
Study area showing the position of reefs.

Effects of disturbances in nature are often assessed by using ‘BACI’ approach, i.e. Before–After versus Control–Impact (Underwood, Reference Underwood1992). In the Cantabrian Sea this approach is difficult to apply, since all soft grounds are affected by an important fishing pressure, making it very difficult to find suitable control areas. In addition, this fishing pressure started before the first bottom-trawl survey was carried out in the area (the historical dataset used in this paper began to be gathered in 1983 by the Instituto Español de Oceanografía, IEO), and before the main technical innovations of the fleet were implemented. Hence, there are no before-disturbance data available.
In this paper, the establishment of artificial reefs has been used as an alternative approach in understanding the recovery of fish and invertebrate populations after trawl exclusion. Two areas which have been closed to trawling and in which artificial reefs had been installed, were chosen for the current study. The two zones are separated by 40 nautical miles and located in the central part of the Cantabrian Sea inner shelf: Llanes and Calderón. The reefs were deployed in Llanes in 1993 and in Calderón in 2003. Both areas are homogeneous in depth and substrate type, so during this 10 year period the Llanes area could act as a control site while the Calderón area as an impacted site.
Previous studies in the area have been focused on the effects of trawl exclusion on sensitive groups, such as elasmobranchs (Rodríguez-Cabello et al., Reference Rodríguez-Cabello, Sánchez, Serrano and Olaso2008). In the present study we analyse the changes produced on benthic and demersal communities in terms of temporal shifts in a set of indicators after the anti-trawl reefs deployment. This paper aims to test the effectiveness of this measure, hypothesizing an increase in biomass of sensitive species, and in community, size-based and trophic indicators with trawling exclusion (Pipitone et al., Reference Pipitone, Badalamenti, D'Anna and Patti2000). The average weight, maximum length, percentage of large fish and trophic level were expected to increase as a result of trawl exclusion, since fishing results in fewer bigger individuals and fewer larger species, usually belonging to high trophic levels (Trenkel & Rochet, Reference Trenkel and Rochet2003).
MATERIALS AND METHODS
In the Cantabrian Sea, IEO bottom survey series started in 1983. These surveys are based on a random stratified sampling, with 30-minute hauls at a speed of 3.0 knots, using the baca 44/60 gear (Sánchez, Reference Sánchez1993). The survey methodology has been standardized, but the sampling effort has been improved yearly, by adding new hauls obtained from geological surveys, information from fishing skippers, etc. In recent years, the number of hauls has been constant (~125) and since 1992, non-commercial invertebrate species have also been identified.
The two study areas (Figure 1) were: (i) Llanes, where artificial reefs were deployed in 1993; and (ii) Calderón, where reefs were placed in 2003. In both areas, the artificial reefs consist of groups of concrete blocks with a separation of 130 m between blocks and 2 km between reefs or groups of blocks. The surface area occupied by the blocks was less than 2% of the whole area in both sites. Blocks were of the protection type, not the alveolar type used to increase production (Revenga et al., Reference Revenga, Fernández, González, Santaella, Jensen, Collins and Lockwood2000).
In the survey series one haul per year has been performed at each reef placement area, since 1988 in Llanes and 1998 in Calderón. Both hauls have been taken annually (in October) at a depth of 80–85 m. After reef deployment in 1993 (Llanes) and 2003 (Calderón) hauls were performed in the same sites as before reef settlement (sandy areas free of devices for monitoring purpose).
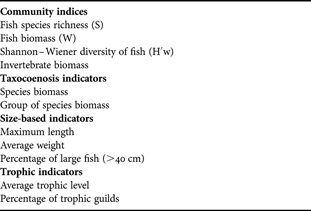
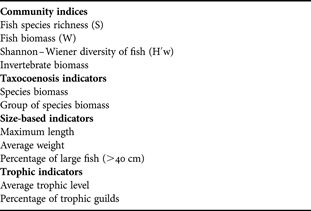
To evaluate the effects of reef deployment on benthic and demersal communities, a set of variables (indicators and metrics) was selected based on available literature (Table 1). These include ecological indices, sensitive species abundance, trophic and size-based indicators, and commercial species abundance (ICES, 2005; Shin et al., Reference Shin, Rochet, Jennings, Field and Gislason2005; Greenstreet & Rogers, Reference Greenstreet and Rogers2006). The proportion of large fish was obtained considering the number of individuals larger than 40 cm (ICES, 2005). Trophic levels of fish species were obtained from FishBase (Froese & Pauly, Reference Froese and Pauly2007).
Set of indicators used in the analysis.
The variations of indicators throughout the series have been analysed comparing groups of years (periods). Such periods have been determined by cluster analysis using the Bray–Curtis similarity index on log-transformed demersal and benthic fish species biomass matrix. The distance matrix was processed using the UPGMA algorithm. SIMPER analyses were also run to identify the species responsible for the major intra-group similarities and inter-group dissimilarities in the dendrogram. The same procedure was applied to invertebrate species in the Calderón area. The Llanes invertebrate data were not used since available data were confined to one year prior to reef construction.
In addition to the between periods comparison (Before–After), we investigated between-area differences during the period 1998–2002, when trawling was excluded from Llanes but not from Calderón (Control–Impact).
Significant differences in the mean values of the indices between groups of years-hauls (Before–After or Control–Impact) were tested using a one-way ANOVA (F) or a Student's t-test (t), under normality and homoscedasticity conditions, or the non-parametric alternatives (Kruskal–Wallis one-way ANOVA on ranks (H) or Mann–Whitney test (T)) when these conditions were not met. Given the low sample sizes of the comparisons performed, non-parametric bootstrapping methods (using 1000 iterations and the lowest sample size available in each comparison) were used to confirm the significance of the results.
RESULTS
Effects on fish community structure
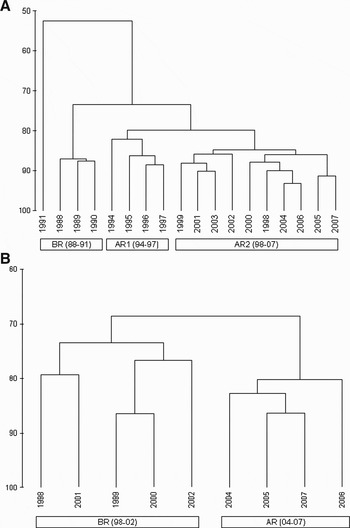
The cluster analysis clearly shows the existence of different periods which are strongly related to reef construction. Llanes, where reefs where placed first, shows three periods (Figure 2A): before the reefs (1988–1991: BR), after the reefs (1994–1997: AR1) and a second after-reef period (1998–2007: AR2). In the Calderón area, there was also a clear difference between the years before and after the reef construction (Figure 2B). The response in both areas was similar, except for the existence of a second ‘after reef’ period in Llanes, which may be due to its longer existence.
Cluster analysis for fish species. (A) Llanes area (BR, before reefs; AR1, after reefs period 1; AR2, after reefs period 2); (B) Calderón area (BR, before reefs; AR, after reefs).

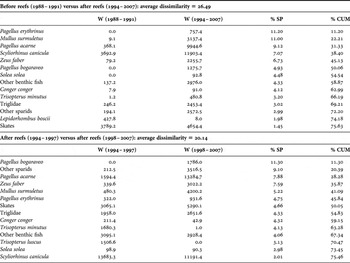
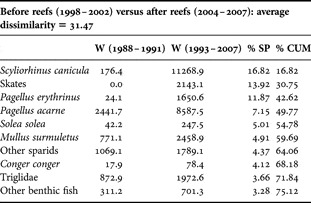
The SIMPER analysis showed that sparids, red mullet, catsharks and John Dory were the main species responsible for the differences found between the BR and the AR1 periods, and also between the AR1 and AR2 periods in the Llanes area (Table 2). All these species increased their biomass along the different periods. The pattern was similar in Calderón. Surprisingly, in this latter area, skates (Rajidae) were absent prior to trawl exclusion, but reached average values of more than 2 kg/ha in the after reef period (Table 3).
Fish species contributing 75% of cumulative dissimilarity between groups resulting from the cluster analysis in the Llanes area. W, average biomass (g/ha) in the cluster group; % SP, individual species contribution to total dissimilarity; % CUM, cumulative percentage of species contributions.

Fish species contributing 75% of cumulative dissimilarity between groups resulting from the cluster analysis in the Calderón area. W, average biomass (g/ha) in the cluster group; % SP, individual species contribution to total dissimilarity; % CUM, cumulative percentage of species contributions.

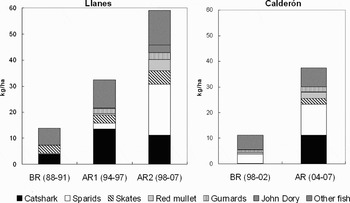
As regards changes in fish biomass, the increase of sparids, catsharks, John Dory, other benthic fish (mainly great weever and dragonet) and gurnards in Llanes (Table 2; Figure 3) was also noteworthy. The biomass of sparids increased mainly 4 years after reef construction, between periods AR1 and AR2. For instance, Pagellus bogaraveo was only caught in the area in the AR2 period, and catch rates of P. acarne increased from 1.6 kg/ha during the AR1 period to 13.3 kg/ha in AR2 one (Table 2). Skates, red mullets and gurnards responded in the same way. A different pattern was observed for catsharks, which also increased in biomass after the reefs were deployed, but subsequently decreased during the AR2 period (Figure 3). Conger eel (Conger conger, most of them juveniles in the size-range of 27–60 cm) responded as catsharks did.
Catch composition in biomass of fish species in the periods obtained in the cluster analysis for both areas (BR, before reefs; AR, after reefs).

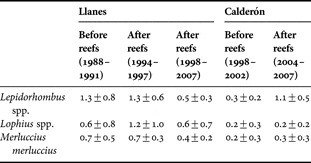
The fish species referred to above showed clear increases after reef deployment. On the contrary, the main fishery target species (hake, anglerfish and megrim) showed a progressive decrease in abundance in both areas during the study period (Table 4).
Mean biomass (kg/ha±SD) of the three main fish commercial species in both areas, for the periods defined by cluster.

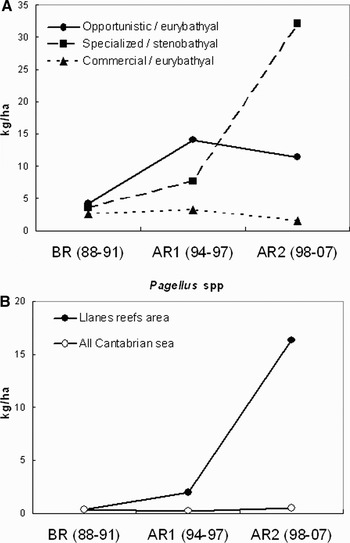
In summary, three types of responses (combining dissimilarity and biomass results) were shown for the oldest reefs (Llanes area) (Figure 4A):
1) an increase in AR1 followed by a slight decrease in AR2 (mainly catshark and conger eel);
2) a slight increase in biomass from BR to AR1, and a remarkable one between AR1 and AR2 (mainly for Sparidae, red mullet and John Dory). Figure 4B shows the increasing response of more abundant sea breams (Pagellus spp.) in the reef area in comparison with the stable pattern show in the Cantabrian Sea as a whole (obtained from the same survey's database); and
3) a progressive decrease in abundance (hake, anglerfish and megrim).
(A) Different types of fish response to trawl exclusion in the Llanes area; (B) comparison of average biomass by periods of the three Pagellus species (P. acarne, P. erythrinus and P. bogaraveo) in the Llanes area and in the totality of the Cantabrian Sea. BR, before reefs; AR1, after reefs period 1; AR2, after reefs period 2.

Effects on fish community indices
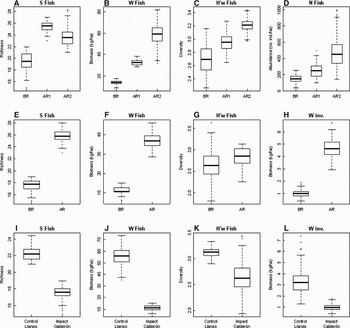
The most remarkable differences between periods were in biomass and richness indices (Figure 5, df = 17 for Llanes and df = 7 for Calderón in all comparisons). When fish biomass shifts were analysed along the series, differences between periods were highly significant in all pairs of periods (Llanes: F = 13.30, P < 0.01; Calderón: t =−6.35, P < 0.01), with a progressive increase with time (Figure 5B, F).
Between-periods differences in community indices. Upper row—Llanes: fish richness (A), fish biomass (B), fish diversity in biomass (C) and fish density (D). Middle row—Calderón: fish richness (E), fish biomass (F), fish diversity in biomass (G) and invertebrate biomass (H). Lower row—Control–Impact comparison Llanes versus Calderón (1998–2003): (I) number of fish species per haul, (J) fish biomass, (K) average fish diversity, (L) invertebrate biomass. Biomasses in kg/ha. Median, inter-quartile ranges (box) and 1.5 times inter-quartile range (whiskers) of the bootstrap 1000 iterations. Points outside whiskers correspond to outliers. BR, before reefs; AR, after reefs.

In Llanes, differences in mean species richness between periods were significant (F = 5.59, P = 0.01) between BR and AR1, but not between AR1 and AR2 (Figure 5A). In Calderón, fish species richness was significantly lower (t = –6.57, P < 0.01) before reef deployment than after (Figure 5E). Non-significant increases were found in fish diversity both in Llanes (Figure 5C; H = 5.4, P = 0.07) and Calderón (Figure 5G; t = –0.62, P = 0.55), and in the number of individuals, also in Llanes (Figure 5D; F = 2.39, P = 0.12), and Calderón (not shown; t = –0.59, P = 0.57).
The Control–Impact approach was carried out during the period 1998–2002, since in these years trawling activities were excluded from Llanes but not from Calderón. Mean values of fish species richness (Figure 5I) and fish biomass (Figure 5J) were significantly higher (t = 4.39, P < 0.01; T = 40.0, P < 0.01, df = 9) in the control area (Llanes) than in the impact area (Calderón). However, no significant differences were found regarding fish diversity (t = 1.72, P = 0.12, df = 9), though mean values were higher in Llanes (Figure 5K).
Effects on size-based indicators
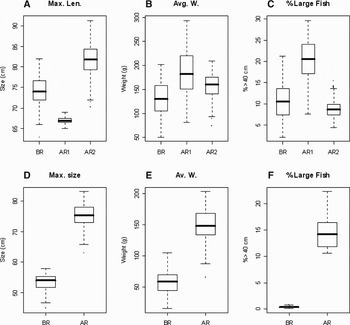
We found significant differences (F = 6.80, P < 0.01, df = 17) in maximum size between AR1 and AR2 in Llanes (Figure 6A) and between the BR and AR periods in Calderón (t = –4.49, P < 0.01, df = 7) (Figure 6D). Nevertheless, average fish weight did not show a pattern in accordance to reef deployment, since there were no significant differences between periods (Figure 6B, E) (Llanes: H = 0.89, P = 0.64; Calderón: t =−2.74, P = 0.029). A different pattern between both areas were found regarding the percentage of large fish (>40 cm), since this indicator did not show response in Llanes, but a clear response in the Calderón area, where the before-reef fish community was composed mainly of specimens smaller than 40 cm, while after the construction of reefs a significant increase in large fish proportion occurred. Inter-period differences in the percentage of large fish were not significant in Llanes (H = 3.86, P = 0.14; Figure 6C) but significant in Calderón (F = 30.0, P = 0.01; Figure 6F).
Between-periods differences in size-based indicators for both areas. Upper row—Llanes: maximum size (A), average weight (B), percentage (in numbers) of fish larger than 40 cm (C); bottom row—Calderón: maximum size (D), average weight (E), percentage (in numbers) of fish larger than 40 cm (F). Median, inter-quartile ranges (box) and 1.5 times inter-quartile range (whiskers) of the 1000 bootstrap iterations. BR, before reefs; AR, after reefs.

Effects on trophic indicators
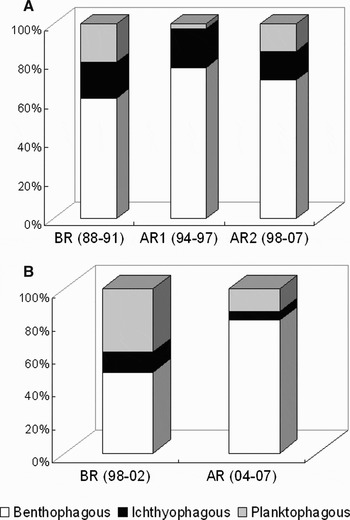
In concordance with previous results, the biomass of the three trophic guilds increased significantly with reef construction, but a different response among guilds could be detected analysing percentages. In both areas, an increase in the percentage of benthophagous fish occurred after reef placement, together with a decrease in planktophagous fish, and no clear changes in ichthyophagous fish (Figure 7A, B). In Llanes, the second after-reef period (AR2) was defined by a return to before-reef values, with a decrease in the percentage of benthophagous fish (to intermediate values between BR and AR1) and an increase in planktophagous ones (Figure 7A).
Fish trophic guild composition in the periods defined by the cluster analysis. (A) Llanes (BR, before reefs; AR1, after reefs period 1; AR2, after reefs period 2); (B) Calderón (BR, before reefs; AR, after reefs).

The average trophic level of the different fish species did not show any clear relation to reef deployment in neither of the areas (figure not shown), intra-period differences being non-significant (Llanes: H = 4.71, P = 0.09; Calderón: t = 0.66, P = 0.53).
Effects on invertebrate indices
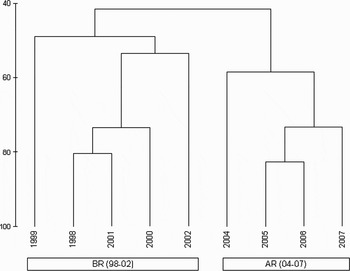
Benthic invertebrates (only in Calderón) showed similar cluster pattern as the fish species, i.e. before and after reef deployment patterns (Figure 8).
Cluster analysis for invertebrate species in the Calderón area (BR, before reefs; AR, after reefs).

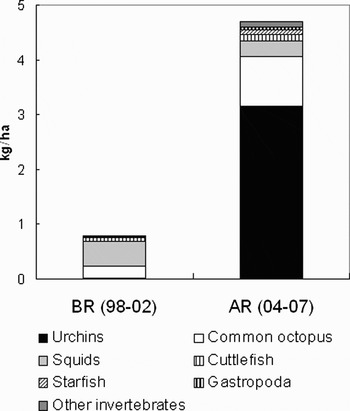
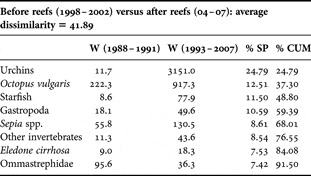
The biomass of most invertebrate species increased considerably after trawl exclusion. Almost 25% of the dissimilarity between before and after reef periods were due to sea urchins (mainly Echinus acutus), as is shown in Table 5. Abundance/biomass of echinoderms increased from an average of 0.01 kg/ha before reef construction to 3.1 kg/ha after their establishment (Table 5; Figure 9). Starfish also benefited from trawl exclusion. Molluscan biomass also increased, specifically that of cephalopods and gastropods. Regarding cephalopods, commercial benthic species like Octopus vulgaris (5-fold increase) and Sepia spp. increased, in contrast with more pelagic ommastrephid squids (Ilex coindetti and Todaropsis eblanae) or Loligo spp., that showed no differences between periods.
Catch composition in biomass of invertebrate species in the periods obtained in the cluster analysis in the Calderón area (BR, before reefs; AR, after reefs).

Invertebrate species contributing 90% of cumulative dissimilarity between groups resulting from the cluster analysis in the Calderón area. W, average biomass (g/ha) in the cluster group; % SP, individual species contribution to total dissimilarity; % CUM, cumulative percentage of species contributions.

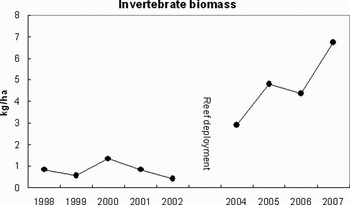
After-reef deployment an increase in invertebrate biomass occurred in Calderón (Figure 10). This was also clear when comparing periods (Figure 5H), after deployment of reefs, mean values being significantly higher than before reef deployment (t = –4.81, P < 0.01, df = 7).
Evolution of invertebrate biomass (kg/ha) in the Calderón area before and after reef deployment.

During the period 1998–2002, mean invertebrate biomass was 1.0 kg/ha in the impact area (affected by illegal trawling operations), and 3.2 kg/ha in the control area (Figure 5L), although this difference was not significant (t = 1.76, P = 0.15, df = 9).
DISCUSSION
In this study several community parameters indicate a response by fish and invertebrate communities to anti-trawling reef deployment. The most evident results were that trawl exclusion led to a noteworthy increase in both fish and invertebrate biomass. The results obtained from the area where reefs were placed earlier, with a longer after-exclusion period, show the existence of two post-reef periods. The first one, of 4 years in Llanes, was characterized by a significant increase in some indicators, mainly biomass-related. This can be defined as ‘recovery phase’. After this period, the same indicators increased again significantly, during a new period that could be defined as a ‘consolidation phase’. In Calderón, the ecosystem was still in the ‘recovery phase’, due to the short time elapsed since trawl exclusion.
Between-period trends and differences in indicators followed the direction anticipated by previous studies (Greenstreet & Rogers, Reference Greenstreet and Rogers2006). Those periods were also in agreement with previous studies describing how changes related with artificial reef maturity and production are not immediate, and a lag before significant reef production and consequently, fishery enhancement can be expected (Leitao et al., Reference Leitao, Santos and Monteiro2007). Hueckel & Buckley (Reference Hueckel and Buckley1987) found that as an artificial reef ages, food resources and predator populations associated with the reef also increase.
Most of the fish species inhabiting reef areas augment their biomass, but there are differences in the pattern of shifts. We have found 3 types of responses:
(1) a progressive increase with time. One of the dominant groups, sea breams (Sparidae), showed a slight increase from the impact phase to the recovery one, but the most remarkable increase in biomass occurred between the recovery and the consolidation phases. One sparid in particular, Pagellus bogaraveo, which had practically disappeared from soft grounds in the Cantabrian Sea, did not appear in the Llanes reefs until the consolidation phase. Such progressive increase was also shown by red mullet, John Dory, gurnards and skates;
(2) an increase in the recovery phase, with a stabilization or a slight decrease in the consolidation phase. This is the pattern followed by catshark and conger eel; and
(3) the species not affected by trawl exclusion. The main fishery target species (hake, anglerfish, and megrim) have shown a progressive decrease in abundance during the whole period considered (decreases also shown by their respective stocks in the entire shelf area, outside the reef areas).
Group 1 consisted of characteristic inner shelf (stenobathyal) species, whereas groups 2 and 3 were formed mainly by eurybathyal species. Therefore, the species which were strongly related with the protected habitat, and hence with a low tendency to move to nearby areas responded to reef deployment with a progressive increase. Santos & Monteiro (Reference Santos and Monteiro2007) attributed differences between reef and impacted areas to benthic and nekto-benthic fish (P. acarne, P. erythrinus and Mullus surmuletus, among others). On the other hand, species moving out of the area (spillover effect) showed a limited increase in their biomass (groups 2 and 3).
These patterns, however do not agree with the evolution of catshark, which despite being a philopatric species (Rodríguez-Cabello et al., Reference Rodríguez-Cabello, Sánchez and Olaso2007), highly related with the same protected areas, was included in group 2. Nevertheless, the recovery phase was characterized by changes in the community, and by a species succession that was favourable to opportunistic and generalist species such as catshark (Serrano et al., Reference Serrano, Velasco, Olaso and Sánchez2003). Later, when the community was fully structured, more specialized species (sparids) dominated, and could have controlled the increase in catshark populations by competition. In a different way, the biomass increase of conger eel may have been limited by a density-dependent effect, since this species needs holes and crevices for refuge, and the availability of these microenvironments among the reefs might have been limited. The progressive decrease found in commercial species (hake, megrim and anglerfish) may be strongly related with the activities of artisanal fisheries (gillnets and longlines), for which legal fishing activities did not stop with reef construction. Also, Herrera et al. (Reference Herrera, Espino, Garrido and Haroun2002) described a dramatic reduction in recruits and juveniles of some commercial fish species after reef deployment as a consequence of the increased abundance of predators. Besides, the habitat characteristics of the reef areas are not optimal (too shallow and too sandy) for the populations of hake, megrim and anglerfish that normally live on muddy bottoms of the middle and outer shelves (Sánchez et al., Reference Sánchez, Pérez and Landa1998, Reference Sánchez, Blanco and Gancedo2002; Sánchez & Serrano, Reference Sánchez and Serrano2003).
Another noteworthy result of this study is the massive recovery of invertebrate biomass after trawl exclusion, and specifically that of sea urchins. This fact has been described in an inverse way (a decrease as a consequence of trawl disturbance) by Jennings et al. (Reference Jennings, Pinnegar, Polunin and Warr2001). A higher abundance of sea urchins was an expected consequence of trawling exclusion as these animals can suffer 10 to 50% mortality in the path tread by the trawls (Lindeboom & de Groot, Reference Lindeboom and de Groot1998). A similar impact was described for starfish (Kaiser, Reference Kaiser1996), a group that also increased in biomass with trawl exclusion in our study. The enhancement of common octopus populations after reef construction is of great economic importance, since it is a very valuable species. Our results seem to indicate that while benthic cephalopods (octopuses and cuttlefish) benefited from trawl exclusion, pelagic ones, such as squids, did not probably due to the limited relationship of these animals with the reef area.
Biomass, and to a lesser extent species richness and maximum length and percentage of large fish, were sensitive to trawl exclusion, but not density, diversity and average trophic level. Species richness showed a significant increase with trawl exclusion. In the case of Llanes, after an increase in the recovery phase, the average number of species decreased during the consolidation phase. This is in agreement with the Intermediate Disturbance Hypothesis (Connell, Reference Connell1978), according to which increases in richness and diversity indices occur in intermediate levels of disturbance, as a consequence of opportunistic competitive species. Nevertheless, richness is a metric that has some problems as a management tool, as for example the different taxonomic precision of rare or difficult taxa achieved between years. This can be made extensive to diversity, which showed no significant changes with trawl exclusion in our study.
Size-based indicators are being widely used in fishing-impact studies (ICES, 2005; Shin et al., Reference Shin, Rochet, Jennings, Field and Gislason2005). The average weight, maximum length and percentage of large fish are expected to decrease as a result of fishing since both bigger individuals and larger species are being removed (Trenkel & Rochet, Reference Trenkel and Rochet2003). In our study, differences between areas have been detected, since size-based indicators have shown a better response to trawl exclusion in the Calderón area. This may be a consequence of pre-closure conditions, since in this area the percentage of large fish was very low, i.e. the fish fauna of Calderón consisted of small fish. Those differences could be attributable to fishing impacts, since other temporal analyses of the effects of fishing and climate variation (Blanchard et al., Reference Blanchard, Dulvy, Jennings, Ellis, Pinnegar, Tidd and Kell2005) suggest that fishing generally has had a stronger effect on size-structure than changes in temperature. However, more detailed studies on the effects of trawl-exclusion/reef-settlement on size-based indicators are needed, as superimposed effects may occur: reserves may act as nursery areas, hence increasing the percentage of smaller fish, and, on the contrary, increases in predator biomass may produce decreases in juvenile abundance.
Regarding the effects of trawl exclusion on the ratio of trophic guilds, a clear increase in the proportion of benthophagous fish was found. This increase implied a decrease of planktophagous fish and ichthyophagous fish remaining stable. The proportion of piscivores is expected to decrease under fishing impact, since they are often the preferred targets of commercial fisheries (Trenkel & Rochet, Reference Trenkel and Rochet2003). However, as shown here, the main commercial species followed the decreasing trend of their corresponding stocks in the area. The species that benefited most from trawl exclusion were primarily benthophagous: sea breams, red mullets and catsharks.
The effect of the inclusion of hard substrata (reefs) in a soft substratum should be considered. Several studies have reported that this change increases habitat heterogeneity, boundary effects, and obviously favours the settlement of hard bottom species. Moreno (Reference Moreno2002) stated that most reef-dwelling species are habitat-specific. The increase in sparids in comparison with the more limited increase in other sedimentary ground-dwelling species such as catshark may be related to the affinity of sea breams to the new rocky habitats. Nevertheless, we assume that the low percentage of concrete block coverage in relation to sediment and the long distance between modules imply that the habitat heterogeneity and boundary effects are only relevant at a microscale level and not detectable by our methodology. However, in particular cases a clear relationship was evident, such as for the common octopus. This species uses hard substrata as shelter and needs cavities and crevices to spawn (Katsanevakis & Verriopoulos, Reference Katsanevakis and Verriopoulos2004), so its increase in our results is likely to be related with provision of hard substrata by deploying the concrete blocks on the sandy bottoms.
It has also been described that artificial reef structures provide a hard substratum for the settlement of benthic prey, contributing to the creation of new feeding areas, and hence increasing the trophic efficiency of formerly less productive sandy bottoms (Bombace, Reference Bombace1989). The benefit of hard substrata to sparids could thus be partly trophic, since they have been found to feed on hard substrate species (Leitao et al., Reference Leitao, Santos and Monteiro2007). However, sea bream stomach content analysis in both areas (Olaso & Velasco, unpublished data) did not show an increase in diet width or in the importance of hard substrata prey after reef construction. Thereby, our results point out that increases in populations may have a partly trophic cause, but are probably more related with the increase in complexity and maturity of the after-reef community (as a consequence of trawl exclusion, and, to some extent, of the inclusion of extra hard substrata), which would render a more diverse and better quality of food. Lloret & Planes (Reference Lloret and Planes2003) described how protected areas could be offering an increased production for white sea bream, since post-spawners were in better conditions within the protected areas of the reserve than in adjacent unprotected areas.
The present study provides evidence of the benefits of trawl exclusion on demersal and benthic communities. Of the set of metrics and indicators suitable to be used in the Cantabrian Sea's inner shelf ecosystem, some of them seem to be rather informative of the changes and processes derived from trawl exclusion. Hence, those indicators are good candidates to be used in the assessment of trawling impact in the inner shelf. On the other hand, the values obtained after several years of trawl exclusion could be considered as reference points in the future assessment of impact activities in these areas.
ACKNOWLEDGEMENTS
This study was made possible by the invaluable work of the participants in the north of Spain bottom trawl surveys and the crew(s) of the RV ‘Cornide de Saavedra’. The authors also appreciate the advice and help provided by colleagues attending the ICES Working Group on Fish Ecology 2008 (WGFE 08).