Implications
The results of this study demonstrate that adopting a crossbreeding policy on hill flocks using Swaledale (SW), Cheviot (CH), Lleyn or Texel sires to produce high output replacement ewes has no detrimental effects for ewe longevity compared with keeping purebred Blackface ewes. When a second hill breed sire such as SW or CH is used to produce the crossbred ewes, longevity can be improved. The net result is that lamb output over 5 years can be up to 22% higher from the crossbred ewes. Therefore, crossbreeding offers significant potential to improve the profitability of hill sheep farming and should be considered more widely than at present.
Introduction
The hill sheep sector is a major contributor to lamb production in Europe, with more than 90% of the 65.8 million breeding ewes in the European Union – 25 kept within less favoured areas (European Commission, 2006). However, the physical performance of hill flocks, in terms of conception rate, average litter size, lamb growth rate and lamb carcass conformation, are often inferior to those of other sectors of the industry (Dawson and Carson, Reference Dawson and Carson2002; Carson et al., Reference Carson, Dawson, Irwin and Kilpatrick2004). Improvements in both production efficiency and market returns are essential, if the hill sheep sector is to remain viable.
Ewe breed has been shown to influence lamb output of both hill (Carson et al., Reference Carson, Irwin and Kilpatrick2001) and lowland (Carson et al., Reference Carson, Dawson, Irwin and Kilpatrick2004) flocks through its effects on litter size, lamb birth weight, milk production and lamb mortality. The hill sheep sector of United Kingdom is dominated by purebred genotypes, with the Scottish Blackface (BF) being the most common (Pollott and Stone, Reference Pollott and Stone2006). Use of crossbred ewes in hill flocks is uncommon; however reports comparing purebred and crossbred ewes under hill conditions have consistently demonstrated higher lamb output from crossbred ewes (Donald et al., Reference Donald, Read and Russell1963; Al-Nakib et al., Reference Al-Nakib, Bateman, Findlay, Smith and Thompson1997). In a concurrent study, replicated across six commercial hill flocks, Annett et al. (Reference Annett, Carson, Dawson, Irwin and Kilpatrick2010) demonstrated that retaining crossbred replacements from Scottish BF dams sired by Swaledale (SW), Lleyn (LL) or Texel (T) sires increased weaned lamb output/ewe mated by more than 21% compared with purebred Scottish BF due to their greater prolificacy and heavier lamb weights at weaning.
To date, there have been no reports on the lifetime performance of crossbred ewes under hill conditions. Longevity is a major issue in hill flocks, where the annual replacement rate can exceed 20% (Department of Agriculture and Rural Development, 2009), so it is inappropriate to evaluate crossbred ewes based on their annual performance alone. Retaining crossbred ewes sired by lowland-type breeds, which have been selected under less harsh conditions, may result in reduced hardiness and longevity when compared with the traditional hill breed types (Hohenboken and Clarke, Reference Hohenboken and Clarke1981). On the other hand, heterosis for survival and ‘fitness’ traits may be expressed in crossbred ewes (Fogarty et al., Reference Fogarty, Dickerson and Young1984; Simm et al., Reference Simm, Conington and Bishop1994) which could benefit their longevity and lifetime performance.
Consequently, the aims of this study were to investigate longevity and lifetime lamb output of purebred Scottish BF ewes compared with a range of crossbred genotypes in a hill environment.
Material and methods
Animals
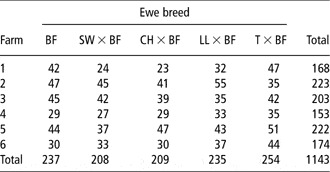
This study was carried out on six hill farms in Northern Ireland over a 5-year period between October 2003 and September 2008. Details of the animals used are outlined in a concurrent study (Annett et al., Reference Annett, Carson, Dawson, Irwin and Kilpatrick2010). In brief, on each of the six farms, 200 purebred Lanark-type Scottish BF ewes were mated with BF, SW, North Country Cheviot (CH), LL and T rams over a 3-year period (October 2001 to 2003). The female progeny from each of these matings – Scottish BF, SW × BF (SW × BF), North Country CH × BF (CH × BF), LL × BF (LL × BF) and T × BF (T × BF) – were retained for further breeding, which commenced when the ewes were approximately 1.5 years old. Details of the numbers of ewes per farm of each breed are shown in Table 1. Over a 5-year period, the crossbred ewes were allocated each year to single sire mating groups, balanced for ewe breed, live weight, body condition score (BCS) and age. In years 1 and 2 (2003 to 2004) ewes were joined with T, Dorset and LL rams while in years 3 to 5 (2005 to 2007) T, Dorset, LL and Suffolk rams were used. All of the rams were from UK sire reference schemes and represented the top 25% of recorded sires for each breed. The rams were all unrelated and were purchased at local pedigree sales by each of the six producers.
Numbers of ewes per farm at the beginning of the study

BF = Scottish Blackface; SW × BF = Swaledale × Blackface; CH × BF = Cheviot × Blackface; LL × BF = Lleyn × Blackface; T × BF = Texel × Blackface.
Measurements
Ewe live weight (to the nearest 0.5 kg) and BCS (Russel et al., Reference Russel, Doney and Gunn1969) were recorded 1 week before mating, 6 weeks pre-lambing, 6 weeks post-lambing and at weaning. The permanent incisors of all ewes were assessed pre-mating for bite position, looseness, wear and general condition. Bite position was scored in relation to the anterior edge of the dental pad on a scale of 1 to 5, with 3.5 being the edge of the dental pad and lower scores being behind it (Duckworth et al., Reference Duckworth, Hill, Benzie, Dalgarno and Robinson1962). Looseness and wear were each scored on a 4-point scale with 1 indicating firm and unworn, respectively. Pregnancy status was determined by ultrasound scanning between day 70 and 100 of pregnancy and ewes determined to be carrying at least one foetus were considered productive. Ewes that were barren as hoggets (i.e. following their first mating at 1.5 years old) were retained on-farm for breeding the following year; however barren ewes >2 years old were culled from the flock. Lambs were tagged at birth and the tag number was recorded alongside the dam tag number, date of birth, sex and birth weight (to the nearest 0.1 kg) of the lamb. Lambs were weighed again (to the nearest 0.5 kg) at approximately 6 weeks of age and at weaning. When ewes were culled, the date and reason for culling were recorded as follows: barren (non-productive), teeth condition (excessive tooth loss, looseness or wear), udder problems (mastitis in one or both quarters, pendulous udders, large teats, etc.), vaginal prolapse, abortion, poor body condition (BCS at mating <1.5), feet problems (persistent foot rot and/or lameness resulting in poor locomotion), severe parturition difficulties and maternal instinct (poor mothering ability, leaves lambs).
Statistical analysis
All data were analysed using GenStat (2009). Binary data (proportion of ewes alive and productive at each mating, ewe dentition, mortality and culling rates, reasons for culling) were analysed using generalised linear models, assuming a binomial distribution with a logit-link function, with fitted fixed effects for farm + year of birth + ewe breed. Where ewe breed effects were significant, the t-probabilities of all pairwise comparisons were used to test for significant differences between breeds.
Lifetime lamb output was determined in two stages. First, within each age group, lamb output of ewes was determined as the product of the proportion of ewes alive and productive, and the mean productivity per ewe lambed within that age group. The latter was determined in a concurrent study (Annett et al., Reference Annett, Carson, Dawson, Irwin and Kilpatrick2010) using linear mixed models with fixed effects for farm + year of birth + days to weaning + lamb sire breed + age + ewe breed + farm × ewe breed + age × ewe breed, and random effects for ewe id × age + ewe breed × sire of ewe. Second, lamb output was then cumulated across all preceding age groups. Where overall effects were significant (P < 0.05), pairs of means were compared using the least significant difference (LSD).
Breed effects on ewe longevity were first investigated using Log-rank, Wilcoxon, Tarone–Ware and Peto–Peto tests to compare survivability across breeds. Having established a significant relationship, the hazard ratio (with 95% CI) was estimated for each ewe breed and compared with the pure BF using a Cox proportional hazards model. To determine the production factors that influence ewe survival, stepwise logistic-binomial regression analyses were carried out. Fixed effects that showed a close association (P < 0.05) with survival were included in a generalised linear mixed model with a binomial distribution and the fixed effects were re-examined using a Wald statistic. Factors with an associated probability less than 0.05 were included in the final models. For each model, odds ratios were computed with their associated 95% CI.
To display the effects of production factors on longevity, generalised linear mixed models were carried out using the same fitted fixed effects as described before. From the resultant fitted models, predictions of survival probability were formed from the estimated parameters in the model and these were presented graphically.
Results
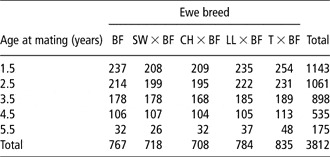
In total, 3812 breeding records from 1143 ewes were investigated across the six farms. A breakdown of these records by age and breed is presented in Table 2.
Total number of ewes alive at mating (subdivided by age and breed)

BF = Scottish Blackface; SW × BF = Swaledale × Blackface; CH × BF = Cheviot × Blackface; LL × BF = Lleyn × Blackface; T × BF = Texel × Blackface.
Longevity
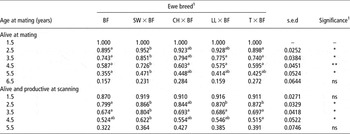
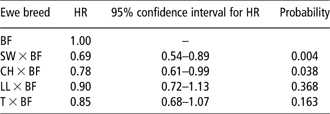
A higher proportion of SW × BF ewes survived to their second mating compared with BF and T × BF (P < 0.05; Table 3). Survival to the third mating was higher for SW × BF than BF, LL × BF and T × BF (P < 0.05), and the proportion of SW × BF surviving to their 4th mating was higher than all other ewe breeds (P < 0.01). While a greater proportion of SW × BF survived to their 5th mating compared with BF (P < 0.05), breed effects on the proportions of ewes surviving were no longer evident at the sixth mating. Similar trends were observed for the proportions of ewes that were both alive and productive at scanning. Survival analysis revealed that, in comparison with the pure BF, the probability of a hazard event (i.e. the disappearance of a ewe from the study) at any time was significantly lower with SW × BF (−0.31, P = 0.004) and CH × BF (−0.22, P = 0.038) ewes only (Table 4).
Effects of age and breed on the proportions of live and productive ewes relative to those joined with a ram at 1.5 years old

BF = Scottish Blackface; SW × BF = Swaledale × Blackface; CH × BF = Cheviot × Blackface; LL × BF = Lleyn × Blackface; T × BF = Texel × Blackface.
Means within rows sharing a common character in their superscript are not significantly different (P > 0.05).
1Probability level denoted by asterisk: * (P < 0.05), ** (P < 0.01), *** (P < 0.001) or ns (non-significant).
Survival analysis for pure BF ewes and their crosses

BF = Scottish Blackface; SW × BF = Swaledale × Blackface; CH × BF = Cheviot × Blackface; LL × BF = Lleyn × Blackface; T × BF = Texel × Blackface; HR = hazard ratio.
Mortality and culling
As a result of their improved survivability, the proportion of SW × BF ewes remaining at the end of the study was higher (P < 0.01) than BF and LL × BF (Table 5). Of those that were removed, the proportion of ewes culled was lower with SW × BF than any other ewe breed (P < 0.001). There were no breed effects on ewe mortality rate or the timing of mortality, although there was a tendency for lower mortality rates with CH × BF compared with BF (P = 0.06).
Effects of ewe breed on mortality and culling ratesFootnote 1

BF = Scottish Blackface; SW × BF = Swaledale × Blackface; CH × BF = Cheviot × Blackface; LL × BF = Lleyn × Blackface; T × BF = Texel × Blackface.
Means within columns sharing a common character in their superscript are not significantly different (P > 0.05).
1 See Table 3 for overall effects on survivability and details of statistical abbreviations.
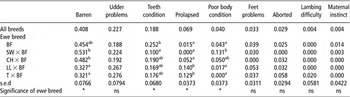
The primary reasons for culling ewes are listed in Table 6. Proportionately, 0.090 ewes culled had no reason for culling recorded and were excluded from this analysis. The majority of ewes were culled due to barrenness (0.408); although the proportions of LL × BF and T × BF culled as barren were lower than either SW × BF or CH × BF (P < 0.05). Udder problems were the second most common reason for culling (0.227) but no breed effects were observed. A higher (P < 0.05) proportion of BF ewes were culled for poor teeth condition compared with SW × BF, although fewer (P < 0.05) BF, SW × BF and CH × BF ewes were culled due to vaginal prolapse compared with LL × BF and T × BF. Ewes were also culled due to poor body condition, feet problems, abortions, severe lambing difficulties and poor maternal instinct; however the incidence of culling for these reasons was low (<0.040) and did not vary significantly between breeds.
Comparison of the main reasons for culling ewesFootnote 1

BF = Scottish Blackface; SW × BF = Swaledale × Blackface; CH × BF = Cheviot × Blackface; LL × BF = Lleyn × Blackface; T × BF = Texel × Blackface.
Means within columns sharing a common character in their superscript are not significantly different (P > 0.05).
1 See Table 3 for overall effects on survivability and details of statistical abbreviations.
Dentition
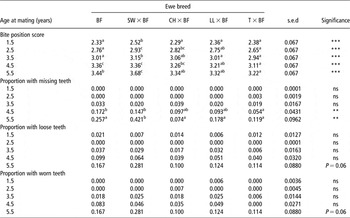
For ewes aged up to 3.5 years old, the mean bite position score of SW × BF ewes was consistently higher (P < 0.001) than BF and T × BF, indicating a higher incidence and severity of overshoot in the SW × BF (Table 7). With ewes aged 4.5 and 5.5 years old, mean bite score of T × BF was lower (P < 0.001) than BF, SW × BF and CH × BF. The incidence of missing (0.026), loose (0.024) and worn (0.018) teeth were low in ewes aged 3.5 years or less. In 4.5-year-old ewes, the incidence of tooth loss was higher (P < 0.01) in BF and SW × BF compared with T × BF, and in 5.5-year-old ewes was higher (P < 0.01) in SW × BF than any other breed. Breed effects on looseness and wear were not evident at any stage, although the incidence of both tended (P < 0.06) to be higher for SW × BF than CH × BF within 5.5-year-old ewes.
Teeth condition in pure BF ewes and their crossesFootnote 1

BF = Scottish Blackface; SW × BF = Swaledale × Blackface; CH × BF = Cheviot × Blackface; LL × BF = Lleyn × Blackface; T × BF = Texel × Blackface.
Means within rows sharing a common character in their superscript are not significantly different (P > 0.05).
1 See Table 3 for overall effects on survivability and details of statistical abbreviations.
Factors affecting survival
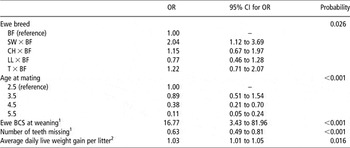
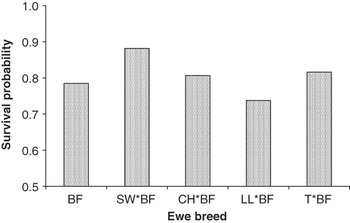
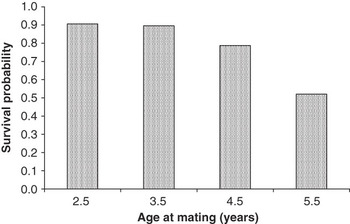
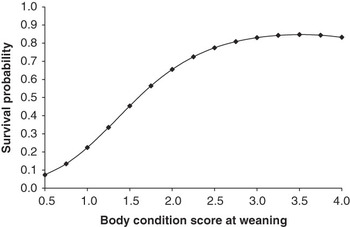
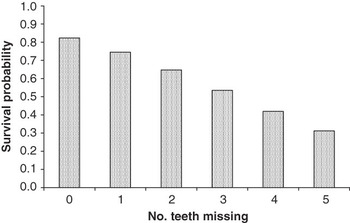
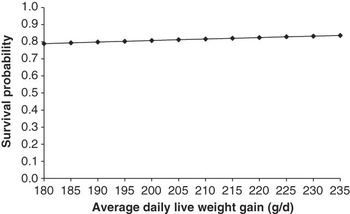
In the multiple-regression models (Table 8), factors affecting the chances of survival to the next mating were found to be ewe breed (P < 0.05), age at mating (P < 0.001), BCS at weaning (P < 0.001), number of missing teeth (P < 0.001) and average daily live weight gain per litter (P < 0.05). Probability of surviving to the next mating was highest for SW × BF (0.881) and lowest for LL × BF (0.738; Figure 1). Age had little effect on survival probability in ewes aged 3.5 years or less (>0.900) but was 0.521 in 5.5-year-old ewes (Figure 2). The probability that ewes in good body condition at weaning (2.5 or above) would survive to the next mating was high (>0.750), but declined rapidly when BCS fell below 2.0 (Figure 3). Increasing incidence of tooth loss resulted in a linear decrease in survival probability, from 0.823 in ewes having a full compliment of teeth, to 0.312 in ewes with five missing teeth (Figure 4). A linear increase in survival probability was observed as average daily live weight gain per litter increased from 180 to 235 g/day although these effects were small (0.788 v. 0.837; Figure 5).
Factors attributing to ewes surviving until the next mating

BF = Scottish Blackface; SW × BF = Swaledale × Blackface; CH × BF = Cheviot × Blackface; LL × BF = Lleyn × Blackface; T × BF = Texel × Blackface; BCS = body condition score.
1OR assumes a one unit increase in the level of factor.
2OR assumes a five unit increase in the level of factor.
Fitted effects of breed on ewe survival.

Fitted effects of age at mating on ewe survival.

Fitted effects of body condition score at weaning on ewe survival.

Fitted effects of the number of missing teeth on ewe survival.

Fitted effects of average daily live weight gain per litter on ewe survival.

Lifetime lamb output
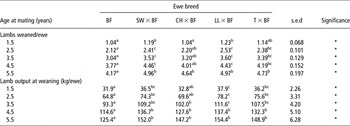
When cumulated across preceding parities, the total number of lambs weaned by LL × BF and SW × BF and the total weight of lambs weaned by LL × BF, T × BF and SW × BF ewes were consistently higher (P < 0.05) than BF throughout the study (Table 9). With the exception of 1.5-year-old ewes, the cumulative number of lambs weaned by T × BF was also higher than BF. BF and CH × BF reared a similar number of lambs up to 4.5 years old but total lambs reared by 5.5-year-old ewes were significantly higher (P < 0.05) for CH × BF. The total weight of lambs reared by CH × BF was consistently higher (P < 0.05) than BF from 3.5 years old and above. Over five mating seasons, the total number and the total weight of lambs weaned was similar for all the crossbred ewe types studied.
Effects of ewe breed and age at mating on cumulative lamb output at weaningFootnote 1

BF = Scottish Blackface; SW × BF = Swaledale × Blackface; CH × BF = Cheviot × Blackface; LL × BF = Lleyn × Blackface; T × BF = Texel × Blackface.
Means within rows sharing a common character in their superscript are not significantly different (P > 0.05).
1 See Table 3 for overall effects on survivability and details of statistical abbreviations.
Discussion
To date, few studies comparing the performance of hill sheep breeds and their crosses have been undertaken under hill conditions (Donald et al., Reference Donald, Read and Russell1963; Al-Nakib et al., Reference Al-Nakib, Findlay and Smith1986 and Reference Al-Nakib, Bateman, Findlay, Smith and Thompson1997; Carson et al., Reference Carson, Irwin and Kilpatrick2001). We believe this is the first study to examine the longevity and lifetime lamb output of crossbred hill ewes, which is surprising considering that replacement costs typically make up around 27% total variable costs of hill sheep flocks (DARD, 2009).
Breed effects on ewe longevity have been reported previously for lowland breed ewes (Vesely and Peters, Reference Vesely and Peters1974; Hohenboken and Clarke, Reference Hohenboken and Clarke1981; Hanrahan, Reference Hanrahan2007) and became evident from as early as the second mating (3.5 years old). Overall, crossbred ewes sired by SW and CH rams had better longevity than purebred BF due to their lower culling rate and lower mortality rate, respectively. In practice, these breed differences in longevity translate into average replacement rates of approximately 24%, 25% and 27% for SW × BF, CH × BF and BF ewes, respectively. While it has been claimed that the SW breed is more adaptable to surviving in wet environments than other hill breeds (Steane, Reference Steane1983), we believe this is the first published evidence to support a claim for greater longevity with this breed. Hohenboken and Clarke (Reference Hohenboken and Clarke1981) compared four crossbred genotypes on hill pastures and noted that ewes sired by North Country CH sires had better longevity than those sired by lowland breed (Romney, Finnsheep) sires. These observations suggest that hill breeds in general may carry ‘fitness’ genes for improved hardiness and survivability under harsh environments, making them more suitable than lowland breed types as crossing sires to improve longevity.
Studies in high output sheep systems have demonstrated that increasing prolificacy can impact negatively on the longevity of ewes. Over an 18-year period, Hanrahan (Reference Hanrahan2007) found that the replacement rate of prolific Belclare × ewes were on average 2% higher than Suffolk × ewes. In a further comparison of four crossbred genotypes, Hohenboken and Clarke (Reference Hohenboken and Clarke1981) noted that prolific Finnsheep × ewes had difficulties adapting to hill conditions. However, within the current study, longevity of the most prolific LL × BF ewes was similar to BF, while SW × BF ewes had superior longevity to the BF due to their lower culling rate. Overall, the potential for reduced biological fitness in the more prolific breed types was generally offset by fewer ewes being culled due to infertility. No direct relationship between litter size and longevity was observed, possibly because the increase in lamb output of the crossbred ewes was achieved mainly through an increased twinning rate. The incidence of triplet births was below 3%, which compares with 10% to 20% of ewes in high output lowland flocks (Hanrahan, Reference Hanrahan1994 and Reference Hanrahan2004), so the small number of triplet-bearing ewes could easily be preferentially managed. A positive relationship between ewe longevity and the average daily live weight gain of her lambs was observed (Figure 5) which could be an indirect effect of litter size, although the overall impact on longevity was small. Selection of crossing sire breed to produce prolific females for hill flocks may be important. SW × BF ewes tended to remain in the flock longer than LL × BF even though both breeds had similar levels of prolificacy (Annett et al., Reference Annett, Carson, Dawson, Irwin and Kilpatrick2010). Therefore, ewes sired by prolific hill breed types such as SW may be more appropriate for hill flocks than those sired by prolific lowland breeds.
Ewe mortality (0.335) rather than culling (0.256) was the main reason for ewes being removed from the flock, which contrasts with reports from lowland flocks (McGloughlin and Curran, Reference McGloughlin and Curran1969; Hanrahan, Reference Hanrahan2007). The peak in ewe mortality between weaning and mating is unexpected considering that ewes are under the least metabolic stress during this time. This mortality rate may, however, be inflated by ewes straying while grazing the more extensive and less favourable hill areas after weaning, although it is impossible to quantify this loss. Breeds effects on culling rates and the reasons for culling have been reported in lowland-breed ewes (Norman and Hohenboken, Reference Norman and Hohenboken1979; Hanrahan, Reference Hanrahan2007). In agreement with McGloughlin and Curran (Reference McGloughlin and Curran1969), the primary reason for culling was due to infertility (0.408) and was followed by udder abnormalities (0.227), poor teeth condition (0.188), vaginal prolapse (0.069) and poor body condition (0.040). The relative rate of culling due to infertility was lower in LL × BF and T × BF compared with CH × BF and mirrors their higher prolificacy (Annett et al., Reference Annett, Carson, Dawson, Irwin and Kilpatrick2010). Waterhouse et al. (Reference Waterhouse, Logue and Roger1992) reported increased survival in BF ewes treated with Fecundin® (Glaxo Animal Health, UK) to boost prolificacy. While these authors suggested that increased longevity could be due to more intense management of multiple bearing ewes, it is inevitable that fewer treated ewes were culled for failing to conceive.
Teeth condition was an important culling criterion in this study, in agreement with Sykes et al. (Reference Sykes, Field and Gunn1974), although the incidence of tooth loss and wear were uncommon (<5%) in ewes under 4.5 years old. Irrespective of age, there was a linear decline in longevity as the number of missing teeth increased (Figure 4) although no attempt has been made to establish, if this was due primarily to culling policy or a higher mortality risk from a decreased ability to forage. It is worth noting however that the higher proportion of ‘broken-mouthed’ 4.5 and 5.5 ewes had no effect on the average growth rates of their lambs, reported in a concurrent study (Annett et al., Reference Annett, Carson, Dawson, Irwin and Kilpatrick2010), which contrasts with a 50 g/day reduction in lamb growth rate of broken mouthed ewes reported by Sykes et al. (Reference Sykes, Field and Gunn1974). However, the older ewes had lower BCSs and experienced greater loss of live weight and body condition during late pregnancy and early lactation (Annett et al., Reference Annett, Carson, Dawson, Irwin and Kilpatrick2010), which suggests that milk production was maintained at the expense of body fat and protein mobilisation. Teeth looseness and wear were not influenced by ewe breed, in contrast to Carson et al. (Reference Carson, Irwin and Kilpatrick2001) who reported greater teeth wear in CH than BF ewes. SW × BF ewes had consistently higher bite scores, indicating a greater incidence of overshoot. While we believe this is the first study to report a breed effect on bite score, there was no evidence that this had a negative effect on ewe or lamb performance. Despite their higher incidence of overshoot and tooth loss, if would appear that SW × BF had sufficient sound teeth remaining to be deemed suitable for further breeding, in the absence of other physical disorders. These observations raise many questions about the relevance of following a strict culling policy for teeth condition.
A policy of culling ewes that were in poor body condition and unlikely to sustain a further pregnancy was common across all the farms involved in this study. Consequently, a significant decline in the probability of survival for ewes in poor body condition (<2.0) at weaning is not surprising (Figure 3). A significant relationship between longevity and age of the ewe was observed, independent of age effects on teeth condition and BCS (Figure 2). This relationship is likely to reflect the increased risk of udder problems, metabolic disorders and other health issues in older ewes. There was no evidence of a breed effect on culling due to udder problems, despite significant variation in prolificacy and lamb output of the breeds studied. This contrasts with Hanrahan (Reference Hanrahan2007) who reported a higher rate of culling for udder problems with prolific Belclare × ewes. Vaginal prolapsing is commonly reported in sheep flocks during the peri-parturient period but typically affects <1% ewes (Low and Sutherland, Reference Low and Sutherland1987). Culling ewes following prolapse has been recommended as they are more likely to prolapse again in the future (Litherland et al., Reference Litherland, Lambert, Knight, Cook and McDougal2000). In this study, 7% of all ewes were culled due to prolapse, but the relative rate of culling was higher in LL × BF and T × BF compared to the hill breed crosses. Factors predisposing ewes to prolapse are poorly understood, although anecdotal evidence points to increased abdominal pressure in ewes carrying multiple foetuses, consuming poor quality forages and in excessive body condition. Although the majority of prolapse cases were in ewes carrying multiples, in agreement with Hanrahan (Reference Hanrahan2007), breed effects on litter size do not fully explain the higher incidence of prolapse in LL × BF and T × BF. It should be noted that 12/19 ewes culled due to prolapse were from a single farm, which may indicate either a higher prevalence on this farm or a higher priority in culling affected ewes.
Cumulative lamb output over 5 years was higher for all the crossbred ewe types compared with the Blackface, both in terms of the number and the weight of lambs reared. To our knowledge this is the first study to report on the lifetime output of crossbred hill ewes, although several studies have reported increased lamb output from crossbred ewes on an annual basis (Donald et al., Reference Donald, Read and Russell1963; Al-Nakib et al., Reference Al-Nakib, Findlay and Smith1986 and Reference Al-Nakib, Bateman, Findlay, Smith and Thompson1997; Gunn, Reference Gunn1986). The higher lifetime output of the crossbreds relative to BF mirrors their higher annual weaning rate (1.42 v 1.31 lambs weaned per ewe lambed; Annett et al., Reference Annett, Carson, Dawson, Irwin and Kilpatrick2010) with the exception of CH × BF, which had similar weaning rates to BF but superior longevity. Across all breeds, variation in lifetime output of individual ewes was attributable mainly to differences in their annual weaning rate (0.606), in agreement with Hohenboken and Clarke (Reference Hohenboken and Clarke1981) and Casas et al. (Reference Casas, Freking and Leymaster2005), followed by differences in longevity (0.273) and lamb growth rate (0.121). Overall, there were no significant differences in 5-year lamb output between any of the crossbred genotypes studied, although the total number and total weight of lambs reared were numerically highest for LL × BF.
Acknowledgements
The authors wish to express their sincere thanks to the following hill sheep producers for their help and hard work in undertaking this study: Mr Ian Buchanan, Mr Richard Duffin, Mr Maurice McHenry, Mr Seamus Maginn, Mr Stephen Montgomery and Mr Samuel Wharry. The authors are also grateful to the Department of Agriculture and Rural Development for Northern Ireland (DARDNI) and Agrisearch who provided funding for this project.