I. INTRODUCTION
Chip attachment by silver sintering, which is often referred to as the low-temperature joining technique (LTJT), has been extensively studied and used as an alternative to solder or epoxy for the fabrication of power electronic devices and modules. The excellent physical properties of silver, such as high melting point, high thermal and electric conductivity, and high ductility, make sintered silver a promising die-attach material that can work in excess of 250 °C, which is significantly higher than the working temperatures of most traditional solder-based or epoxy-based materials.Reference Lu, Calata, Zhang and Bai1–Reference Knoerr and Schletz6 The sintered silver joint in chip attachments also shows higher thermal reliability than traditional solders.Reference Knoerr and Schletz6–Reference Knoerr, Kraft and Schletz9
A bond formed by sintering is significantly different from that formed by the solder reflow process. In the latter, the alloy starts out as spheres immersed in a flux. The flux serves to clean the surfaces to be bonded before the solder particles melt. The bond is established through the formation of intermetallic compounds in the alloy and takes place relatively quickly. The entire reflow process can be completed in a few minutes. Sintering, on the other hand, particularly solid state sintering as in the case of silver, is a slower process and depends on temperature-activated diffusion mechanisms. As a result, the attachment process of LTJT is different from solder reflow and involves a longer timescale. Additional process parameters such as drying time, drying temperature, and externally applied pressure need to be considered. Inappropriate process, especially at the drying stage before silver sintering, will increase defects (such as cracks, voids, and delamination) in the final sintered joints, and the defects can greatly decrease the performance of the sintered joints.
The drying process of nanosilver paste is to remove the solvent inside the paste before sintering. Usually, the drying takes place at temperatures below 200 °C. An inappropriate drying process can cause cracking in the paste and debonding at the interface between the paste and the chip layer, and such defects are irreversible. Therefore, the drying process of nanosilver paste in chip attachment plays an important role in the final bonding quality of the chip attachment. In this study, a model was developed to show the internal stresses in the nanosilver paste in chip attachment during the drying process, and the model provides a better understanding of the drying process of nanosilver LTJT. The insight offered by this modeling study can be used to develop new paste formulations that enable pressure-free, low-temperature sintering of the die-attach material to significantly lower the cost of implementing the LTJT in manufacturing.
II. MODELING AND ALGORITHM
A. Composition of nanosilver paste
The model of the paste consists of two parts: the solid part (silver particles, organic binders) and the liquid part (solvents). During the drying, the liquid part decreases by evaporation and the solid part remains constant, because the solid silver particles cannot be 100% dense, and, in fact, pores are generated during drying. Figure 1 shows a schematic of the evolution of paste composition during drying.
Schematic of composition evolution of nanosilver paste during drying process.

At the initial stage, the total volume, total mass, and density of a unit cell of the paste are V 0, m 0, and ρ0, respectively. The solid part has a volume of  $V_{\rm{S}}^0$ and mass of
 $m_{\rm{S}}^0$, and the solvent has a volume of
 $V_{\rm{L}}^0$, mass of
 $m_{\rm{L}}^0$, and density of ρL. Thus,
 $${V^0} = V_{\rm{S}}^0 + V_{\rm{L}}^0\quad ,$$
 $${m^0} = m_{\rm{S}}^0 + m_{\rm{L}}^0\quad ,$$
 $${{\rm{\rho }}^0} = {m^0}/{V^0}\quad .$$
At a given stage of drying, the solvent is partially evaporated and some pores are generated. The total volume and total mass of the unit cell are V and m, respectively. The volume  $V_{\rm{S}}^{\rm{0}}$ and mass
 $m_{\rm{S}}^{\rm{0}}$ of the solid part remain the same. The solvent now has a volume of
 ${V_{\rm{L}}}$ and mass of
 ${m_{\rm{L}}}$, and the pores have a total volume of
 ${V_{\rm{P}}}$ and mass of 0 (the pores are considered as vacuum). Thus,
 $$V = V_{\rm{S}}^0 + {V_{\rm{L}}} + {V_{\rm{P}}}\quad ,$$
 $$m = m_{\rm{S}}^0 + {m_{\rm{L}}}\quad ,$$
 $${{\rm{\rho }}_{\rm{L}}} = m_{\rm{L}}^0/V_{\rm{L}}^{\rm{0}} = {m_{\rm{L}}}/{V_{\rm{L}}}\quad ,$$
 $${V \over {{V^0}}} = {{V_{\rm{S}}^{\rm{0}} + {V_{\rm{L}}} + {V_{\rm{P}}}} \over {{V^0}}} = {{{V^0} - V_{\rm{L}}^{\rm{0}}} \over {{V^0}}} + {{{V_{\rm{L}}}} \over {{V^0}}} + {{{V_{\rm{P}}}} \over {{V^0}}}\quad .$$
The concentration of the solvent in a unit cell is  $c = {\textstyle{{{m_{\rm{L}}}} \over {{V^0}}}} = {\textstyle{{{m_{\rm{L}}} \cdot {{\rm{\rho }}^{\rm{0}}}} \over {{m^0}}}}$ (with the unit of kg/m3), and the normalized solvent mass is
 ${{\rm{\gamma }}_{\rm{S}}} = {\textstyle{c \over {{{\rm{\rho }}^0}}}} = {\textstyle{{{m_{\rm{L}}}} \over {{m^0}}}}$. The normalized solvent mass is a dimensionless parameter to express the solvent concentration.
The terms of Eq. (7) can be expressed as a function of the normalized solvent mass:
 $${{{V^0} - V_{\rm{L}}^{\rm{0}}} \over {{V^0}}} = 1 - {{m_{\rm{L}}^{\rm{0}}} \over {{{\rm{\rho }}_{\rm{L}}}}} \cdot {{{{\rm{\rho }}^0}} \over {{m^0}}} = 1 - {{{{\rm{\rho }}^0}} \over {{{\rm{\rho }}_{\rm{L}}}}} \cdot {\rm{\gamma }}_{\rm{S}}^{\rm{0}}\quad ,$$
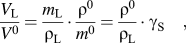 $${{{V_{\rm{L}}}} \over {{V^0}}} = {{{m_{\rm{L}}}} \over {{{\rm{\rho }}_{\rm{L}}}}} \cdot {{{{\rm{\rho }}^0}} \over {{m^0}}} = {{{{\rm{\rho }}^0}} \over {{{\rm{\rho }}_{\rm{L}}}}} \cdot {{\rm{\gamma }}_{\rm{S}}}\quad ,$$
where  $\gamma _{\rm{S}}^0 = {\textstyle{{m_{\rm{L}}^0} \over {{m^0}}}}$ is the initial normalized solvent mass.
An empirical formula for  ${\textstyle{{{V_{\rm{P}}}} \over {{V_0}}}}$ is appliedReference Mayor and Sereno10–Reference Perez and Calvelo12:
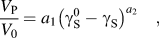 $${{{V_{\rm{P}}}} \over {{V_0}}} = {a_1}{\left( {\gamma _{\rm{S}}^{\rm{0}} - {\gamma _{\rm{S}}}} \right)^{{a_2}}}\quad ,$$
where a 1 and a 2 are model parameters.
Substitute Eqs. (8)–(10) into Eq. (7),
 $${V \over {{V^0}}} = 1 + {{{{\rm{\rho }}^0}} \over {{{\rm{\rho }}_{\rm{L}}}}} \cdot \left( {{{\rm{\gamma }}_{\rm{S}}} - {\rm{\gamma }}_{\rm{S}}^{\rm{0}}} \right) + {a_1} \cdot {\left( {{\rm{\gamma }}_{\rm{S}}^{\rm{0}} - {{\rm{\gamma }}_{\rm{S}}}} \right)^{{a_2}}}\quad .$$
The nanosilver paste (nanoTach®, type K) used in this study was provided by NBE Technologies, LLC, Blacksburg, VA. For the fresh paste, the initial density ρ0 is 4.0 g/cm3, and the density of the solvent ρL is 1.0 g/cm3.  ${\rm{\gamma }}_{\rm{S}}^{\rm{0}}$ is calculated to be 17%. Based on experience, the parameters a 1 and a 2 are set to 35 and 3, respectively.
Figure 2 shows the variation of volume (with or without pores) with normalized solvent mass. When the normalized solvent mass is high, few pores are generated in the volume and the volume change is almost proportional to the solvent loss. When the normalized solvent mass is low, pores become significant in the volume.
Relationship between volume ratio (V/V 0) and normalized solvent mass ( ${\gamma _{\rm{S}}}/\gamma _{\rm{S}}^0$).
The free strain is defined as follows:
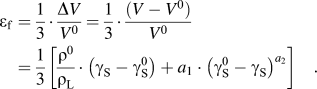 $${{\rm{\varepsilon }}_{\rm{f}}} = {1 \over 3} \cdot {{\Delta V} \over {{V^0}}} = {1 \over 3} \cdot {{\left( {V - {V^0}} \right)} \over {{V^0}}} = {1 \over 3}\left[ {{{{{\rm{\rho }}^0}} \over {{{\rm{\rho }}_{\rm{L}}}}} \cdot \left( {{{\rm{\gamma }}_{\rm{S}}} - {\rm{\gamma }}_{\rm{S}}^{\rm{0}}} \right) + {a_1} \cdot {{\left( {{\rm{\gamma }}_{\rm{S}}^{\rm{0}} - {{\rm{\gamma }}_{\rm{S}}}} \right)}^{{a_2}}}} \right]\quad .$$
So far, the volume change  $\left( {{\textstyle{V \over {{V^0}}}}} \right)$, porosity change
 $\left( {{\textstyle{{{V_{\rm{P}}}} \over {{V^0}}}}} \right)$, and free strain εf of the paste in a unit cell during drying can be expressed as a function of normalized solvent mass (γS).
B. Viscous model for stress analysis
Nanosilver paste is soft and viscous before it is sintered to metallic silver. Therefore, elastic or elastoplastic models are not adequate in describing the drying of nanosilver paste. A model with consideration of viscosity should be more appropriate. Here, a viscous model for stress analysis is applied.Reference Bordia and Scherer13–Reference Lu, Sutterlin and Gupta16
As shown in Fig. 3, the principal stresses and principal strains generated in a unit cell Cell(x, y, z) of the paste are (σx, σy, σz) and (εx, εy, εz), respectively. Assuming that the paste material is isotropic, we can express the constitutive stress–strain relationship as followsReference Scherer15,Reference Lu, Sutterlin and Gupta16 :
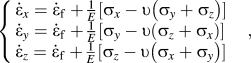 $$\left\{ \matrix{ {{{{\dot \varepsilon }}}_x} = {{{{\dot \varepsilon }}}_{\rm{f}}} + {1 \over E}[ {{{\rm{\sigma }}_x} - {\rm{\upsilon }}\left( {{{\rm{\sigma }}_y} + {{\rm{\sigma }}_z}} \right)} ] \hfill \cr {{{{\dot \varepsilon }}}_y} = {{{{\dot \varepsilon }}}_{\rm{f}}} + {1 \over E}[ {{{\rm{\sigma }}_y} - {\rm{\upsilon }}\left( {{{\rm{\sigma }}_z} + {{\rm{\sigma }}_x}} \right)} ] \hfill \cr {{{{\dot \varepsilon }}}_z} = {{{{\dot \varepsilon }}}_{\rm{f}}} + {1 \over E}[ {{{\rm{\sigma }}_z} - {\rm{\upsilon }}\left( {{{\rm{\sigma }}_x} + {{\rm{\sigma }}_y}} \right)} ] \hfill \cr} \right.\quad ,$$
where  ${\dot \varepsilon _i} = {\textstyle{{\partial {\varepsilon _i}} \over {\partial t}}}$, (i = x, y, z) is the rate of principal strain and
 ${{{\dot \varepsilon }}_{\rm{f}}}$ is the rate of free linear strain of the unconstrained paste. E and υ are the uniaxial viscosity and Poisson's ratio of the paste, respectively.
Schematic of (a) unit cell in at position (x, y, z) in paste and (b) principal stresses and principal strains generated in unit cell.
During the drying process, the paste was constrained on the x–y plane by the chip and substrate. The chip and substrate are both assumed to be rigid bodies undergoing no deformation. Therefore, for the paste, the rate of strain on the x–y plane is always zero; furthermore, the rate of strain in the z-direction is independent of location on the x–y plane at any given time. These can be expressed as Eq. (14):
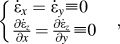 $$\left\{ \matrix{ {{{{\dot \varepsilon }}}_x} = {{{{\dot \varepsilon }}}_y} \equiv 0 \hfill \cr {{\partial {{{{\dot \varepsilon }}}_z}} \over {\partial x}} = {{\partial {{{{\dot \varepsilon }}}_z}} \over {\partial y}} \equiv 0 \hfill \cr} \right.\quad ,$$
Combining Eqs. (13) and (14), we can express the principal stresses as functions of  ${{{\dot \varepsilon }}_f}$ and
 ${{{\dot \varepsilon }}_z}$:
 $${{\rm{\sigma }}_x} = {{\rm{\sigma }}_y} = {E \over {(1 - 2{\rm{\upsilon }})(1 + {\rm{\upsilon }})}}\left[ {{\rm{\upsilon }}{{{{\dot \varepsilon }}}_z} - (1 + {\rm{\upsilon }}){{{{\dot \varepsilon }}}_{\rm{f}}}} \right]\quad ,$$
 $${{\rm{\sigma }}_z} = {E \over {(1 - 2{\rm{\upsilon }})(1 + {\rm{\upsilon }})}}\left[ {(1 - {\rm{\upsilon }}){{{{\dot \varepsilon }}}_z} - (1 + {\rm{\upsilon }}){{{{\dot \varepsilon }}}_{\rm{f}}}} \right]\quad .$$
From here on, we express σx (or σy) and σz as x–y in-plane internal stress and vertical internal stress, respectively.
Figure 4 shows the load condition of the chip. P apply represents the external applied stress on the chip, and σz is the reaction stress of the paste along the z-direction.
Load condition of chip, showing external applied stress P apply and reaction stress of paste σz.
Because of the force equilibrium along the z-direction of the chip,
 $${\sum F _z} = - \int\!\!\!\int\limits_A {{{\rm{\sigma }}_z}} {\rm{d}}A - {P_{{\rm{apply}}}}\,A = 0\quad ,$$
where  $A$ is the area of the paste covered by the chip and substrate.
Substituting Eq. (17) into Eq. (18), we can derive:
 $${{{\dot \varepsilon }}_z} = {{\left[ {\int\!\!\!\int\limits_A {{E \over {(1 - 2{\rm{\upsilon }})}}{{{{\dot \varepsilon }}}_{\rm{f}}}} {\rm{d}}A - {P_{{\rm{apply}}}}A} \right]} \mathord{\left/ {\vphantom {{\left[ {\int\!\!\!\int\limits_A {{E \over {(1 - 2{\rm{\upsilon }})}}{{{\rm{\dot \varepsilon }}}_{\rm{f}}}} dA - {P_{{\rm{apply}}}}A} \right]} {\int\!\!\!\int\limits_A {{{E(1 - {\rm{\upsilon }})} \over {(1 - {\rm{\upsilon }} - 2{{\rm{\upsilon }}^2})}}} dA}}} \right. \kern-\nulldelimiterspace} {\int\!\!\!\int\limits_A {{{E(1 - {\rm{\upsilon }})} \over {(1 - {\rm{\upsilon }} - 2{{\rm{\upsilon }}^2})}}} {\rm{d}}A}}\quad .$$
By substituting Eq. (18) into Eqs. (15) and (16), we can express the principal stresses σx, σy, and σz as functions of the uniaxial viscosity (E), Poisson's ratio (υ), the free strain rate ( ${{{\dot \varepsilon }}_f}$), and the external applied pressure (
 ${P_{{\rm{apply}}}}$).
In principle, at any given time, if the values of E, υ,  ${{{\dot \varepsilon }}_f}$, and
 ${P_{{\rm{apply}}}}$ are known, the x–y in-plane internal stress (σx or σy) and vertical internal stress (σz) of the paste can be calculated.
1. Uniaxial viscosity (E)
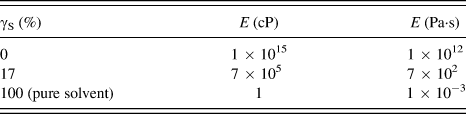
Viscosity is a material property of the paste. Practically, it is related to the normalized solvent mass. The higher the normalized solvent mass, the lower the viscosity. The viscosity of the undried paste is 700,000 cP, and it increases to as high as 1015 cP for a completely dried (but not sintered) paste. It is reasonable to assume that viscosity is a monotonically decreasing function of the normalized solvent mass. The relationship between the viscosity and normalized solvent mass of the paste is shown in Table I.
Relationship between viscosity E and normalized solvent mass γS.
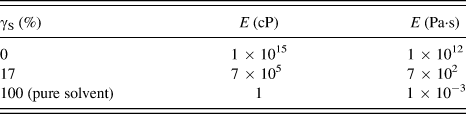
It is assumed there is a reciprocal relationship between viscosity and normalized solvent mass. The equation format is set as Eq. (19):
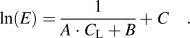 $$\ln (E) = {1 \over {A \cdot {C_{\rm{L}}} + B}} + C\quad .$$
By curve fitting, the parameters are determined to be: A = 0.1673, B = 0.02517, and C = −12.10.
Therefore, the viscosity can be described as a function of normalized solvent mass:
 $$E = \exp \left( {{1 \over {0.1673 \cdot {{\rm{\gamma }}_{\rm{S}}} + 0.02517}} - 12.10} \right)\quad .$$
2. Poisson's ratio (υ)
The viscous Poisson's ratio is related to volume fraction of liquid and porosity. Unfortunately, at the moment we do not have a way to get the functional form of the relationship for the paste material in study. For most engineering materials, Poisson's ratio varies from 0.3 to 0.4. In this model, a constant value of Poisson's ratio of 0.35 is used to simplify the analysis.
3. Free strain rate ( ${{{\dot \varepsilon }}_{\rm{f}}}$)

As shown in Eq. (12), the free strain is a function of normalized solvent mass. Taking the derivative of the free strain with respect to time, we obtain:
 $${{{\dot \varepsilon }}_{\rm{f}}} = {{\partial {{\rm{\varepsilon }}_{\rm{f}}}} \over {\partial t}} = {1 \over 3}\left[ {{{{{\rm{\rho }}^{\rm{0}}}} \over {{{\rm{\rho }}_{\rm{L}}}}} - {a_1} \cdot {a_2}{{\left( {{\rm{\gamma }}_{\rm{S}}^{\rm{0}} - {{\rm{\gamma }}_{\rm{S}}}} \right)}^{{a_2} - 1}}} \right]{{\partial {{\rm{\gamma }}_{\rm{S}}}} \over {\partial t}}\quad .$$
Therefore, the free strain rate is a function of the normalized solvent mass ( ${{\rm{\gamma }}_{\rm{S}}}$) and the rate of change of the normalized solvent mass
 $\left( {{\textstyle{{\partial {\gamma _S}} \over {\partial t}}}} \right)$.
4. External applied pressure (${P_{{\rm{apply}}}}$)

The external applied pressure is controlled manually in the drying process.
Since the internal stresses of the paste are related to the normalized solvent mass and rate of change of normalized solvent mass, the internal stresses at a given location of the paste can be calculated if γS and  ${\textstyle{{\partial {{\rm{\gamma }}_{\rm{S}}}} \over {\partial t}}}$ at that location can be determined during the paste drying process.
The x–y in-plane internal stress is the reason for paste cracking, and the vertical internal stress is the reason for chip-paste debonding. The analysis of evolution of internal stress during the paste drying process can provide a guideline to optimize the drying process by changing the drying process parameters.
C. Kinetics of solvent movement in paste
Figure 5 shows the “sandwich” structure of the paste between the chip and the substrate. Because the top surface and bottom surface of the paste are covered by the chip and substrate, respectively, the solvent can escape only from the edges. Since no solvent can escape along the z-direction and the thickness of the paste is much smaller than the length or width, the movement of solvent along the z-direction can be ignored. Therefore, the solvent movement in the paste can be simplified to a two-dimensional problem.
Solvent liquid only leaves from edges of paste deposited between chip and substrate.
There are two possible transport mechanisms for solvent to move inside a drying paste: fluid flow and diffusion.Reference Scherer17 Fluid flow obeys Darcy's law, which requires the liquid phase to be interconnected and is driven by capillary pressureReference Bramhall18,Reference Van Brakel19 ; diffusion follows Fick's law, and the driving force is the concentration gradient.Reference Bažant and Najjar20–Reference Sakata23 During the drying of nanosilver paste bond-line, the capillary pressure gradient developed along the bond-line edges—the driving force for fluid flow—is negated by the resistance of a large area of the viscous paste trapped between the two plates. Therefore, according to Scherer,Reference Scherer17the liquid flow in the nanosilver bond-line by Darcy's law is neglected. Thus, the constrained-film configuration of the silver paste makes solvent diffusion as the predominant transport mechanism for the drying process. For diffusional solvent movement,Reference Bažant and Najjar20–Reference Sakata23 we have:
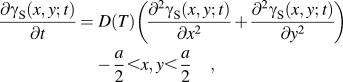 $$\!{{\partial {{\rm{\gamma }}_{\rm{S}}}(x,y;t)} \over {\partial t}} =\; D(T)\left( {{{{\partial ^2}{{\rm{\gamma }}_{\rm{S}}}(x,y;t)} \over {\partial {x^2}}} + {{{\partial ^2}{{\rm{\gamma }}_{\rm{S}}}(x,y;t)} \over {\partial {y^2}}}} \right) - {a \over 2} \lt x,y \lt {a \over 2}\quad ,$$
where  ${{\rm{\gamma }}_{\rm{S}}}(x,y;t)$ is the normalized solvent mass and
 $D(T)$ is the diffusivity of solvent in the paste.
 ${{\rm{\gamma }}_{\rm{S}}}(x,y;t)$ is a function of position coordinates (x, y) and time (
 $t$).
 $D(T)$ is a function of temperature (
 $T$).
In the vicinity of room temperature,  $D(T)$ can be given by the following expression based on the experimental data of ethanolReference Li and Ong24:
 $$D(T) = 3.80 \times {10^{ - 11}}T - 1.02 \times {10^{ - 8}}\quad .$$
In Eq. (23), T is in the unit K and D is in the unit m2/s.
The initial and boundary conditions of solvent movement can be described below:
 $${\rm{At}}\;t = 0, - {a \over 2} \le x,y \le {a \over 2}:{{\rm{\gamma }}_{\rm{S}}} = {\rm{\gamma }}_{\rm{S}}^{\rm{0}}\quad ,$$
 $${\rm{At}}\;t > 0,{\left. {D(T){{\partial {{\rm{\gamma }}_{\rm{S}}}} \over {\partial x}}} \right|_{x = \pm {a \over 2}}} = {\left. {D(T){{\partial {{\rm{\gamma }}_{\rm{S}}}} \over {\partial y}}} \right|_{y = \pm {a \over 2}}} = - J/{{\rm{\rho }}^0}\quad$$
where J is the mass flux of solvent at the edges of the paste, and ρ0 is the initial density of the paste, as mentioned before. J is a function of temperature (T) and normalized solvent mass (γS). An empirical equation for J was used:
 $$J = {a_3} \cdot \exp \left( { - {{{a_4}} \over T}} \right) \cdot {{\rm{\gamma }}_{\rm{S}}}\quad ,$$
where a 3 and a 4 are fitting parameters.
The rate of weight loss β of the solvent in the paste can be described by
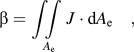 $${\rm{\beta }} = \int\!\!\!\int\limits_{{A_{\rm{e}}}} {J \cdot {\rm{d}}{A_{\rm{e}}}} \quad ,$$
where A e is the surface area of the paste through which the solvent can escape.
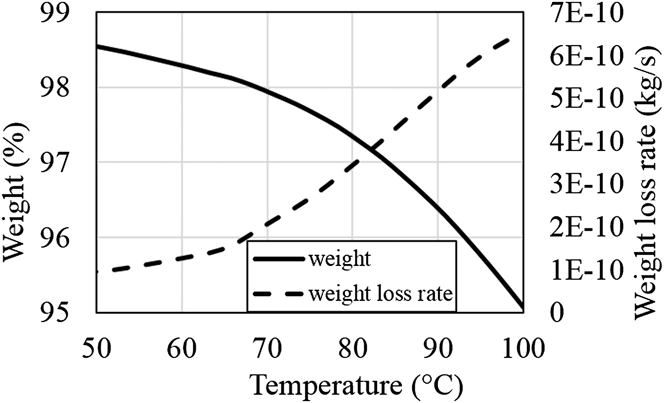
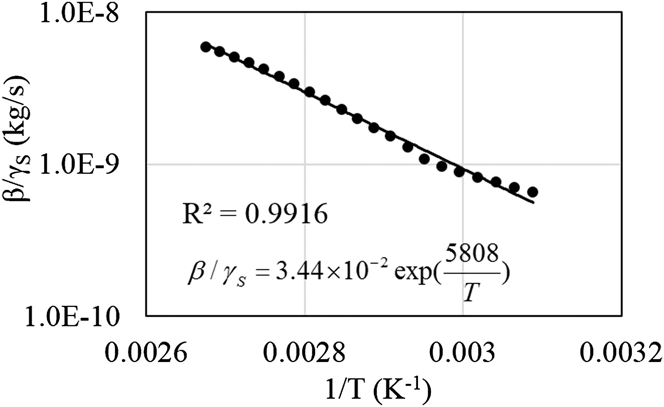
β can be obtained from thermogravimetric analysis (TGA). A nanosilver paste sample (5 mg) was heated in air from 50 to 100 °C at a rate of 5 °C/min. Figure 6 shows the TGA results and Fig. 7 shows the fitting curve to determine fitting parameters in Eq. (26).
TGA plot of nanosilver paste under early drying condition at heating rate of 5 °C/min.
Curve fitting for the rate of weight loss of solvent in the paste.
The surface area through which the solvent can escape is approximately 5 mm2, and the mass flux can be determined as
 $$J = 6880 \times \exp \left( { - {{5808} \over T}} \right) \times {{\rm{\gamma }}_{\rm{S}}}\;{\rm{[unit\!:}}\;{\rm{kg/(s}} \cdot {{\rm{m}}^{\rm{2}}}{\rm{)]}}\quad {\rm{.}}$$
From Eqs. (22–25), normalized solvent mass (γS) and the rate of change of the normalized solvent mass  $\left( {{\textstyle{{\partial {{\rm{\gamma }}_{\rm{S}}}} \over {\partial t}}}} \right)$ at any location in the paste can be calculated at any given time. Therefore, the evolution of internal stress in the paste can be determined.
D. Algorithm and flow chart for stress evolution during drying
Equations (22)–(25) need to be solved to obtain the normalized solvent mass. Analytical solutions for these equations are difficult to obtain, especially when the temperature changes with time, affecting the change of diffusivity and mass flux rate of the solvent. Therefore, numerical simulation is a practical approach to solve Eqs. (22)–(25) for the normalized solvent mass. Furthermore, the entire internal stress evolution in the paste during the drying process can be simulated by solving Eqs. (15) and (16).
In numerical simulation, the structure of the paste is divided into small grids. As shown in Fig. 8(a), paste layer with the length of a is divided into small grids. If the size of the grids is small enough, the material properties (E, γS) and mechanical behaviors (σ,  ${{\dot \varepsilon }}$) can be considered uniform within each grid. The location of each grid can be expressed as Cell(i, j). Similarly, a period of time can be divided into many small increment steps dt, so that the properties and behaviors of the paste do not change within each step.
Meshing of paste structure for numerical simulation.
All the differential equations are rewritten in the finite difference format. For example,
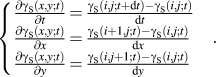 $$\left\{ \matrix{ {{\partial {{\rm{\gamma }}_{\rm{S}}}(x,y;t)} \over {\partial t}} = {{{{\rm{\gamma }}_{\rm{S}}}(i,j;t + {\rm{d}}t) - {{\rm{\gamma }}_{\rm{S}}}(i,j;t)} \over {{\rm{d}}t}} \hfill \cr {{\partial {{\rm{\gamma }}_{\rm{S}}}(x,y;t)} \over {\partial x}} = {{{{\rm{\gamma }}_{\rm{S}}}(i + 1,j;t) - {{\rm{\gamma }}_{\rm{S}}}(i,j;t)} \over {{\rm{d}}x}} \hfill \cr {{\partial {{\rm{\gamma }}_{\rm{S}}}(x,y;t)} \over {\partial y}} = {{{{\rm{\gamma }}_{\rm{S}}}(i,j + 1;t) - {{\rm{\gamma }}_{\rm{S}}}(i,j;t)} \over {{\rm{d}}y}} \hfill \cr} \right.\quad .$$
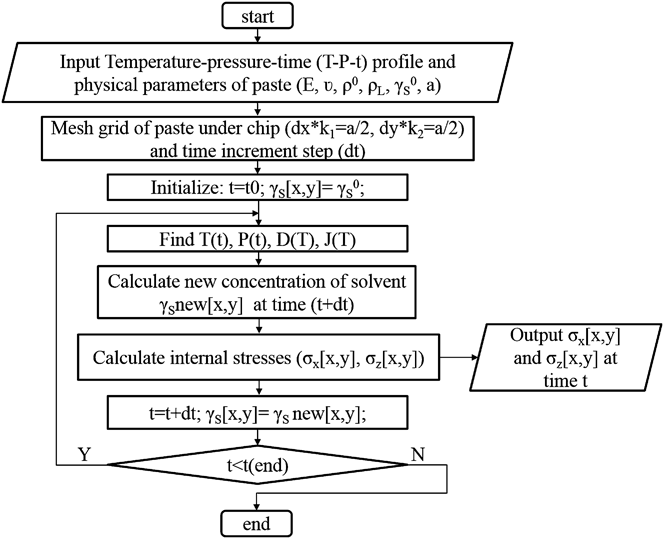
The flow chart of internal stress outputs with different drying profile inputs is shown in Fig. 9, consisting of the following steps: (i) the physical parameters of the paste and the drying profile are input into the program; (ii) the paste structure is meshed to small grids according to the input parameters, and the time increment step is also determined; (iii) set initial time point to start the simulation; (iv) at a given time, find the temperature and external pressure according to the drying profile and the corresponding physical parameters of the paste; (v) calculate the change of normalized solvent mass within a time increment step; (vi) calculate the internal stress at that time; (vii) set new time point as time increases; and (viii) go back to step (iv) before time ends. The algorithm is realized via a C++ code.
Flow chart of internal stress evolution output with different drying profile file inputs.
Because the failure criterion of the paste is related to the normalized solvent mass and is hard to be accurately determined, the model does not consider paste failure during the drying process. The parameters used in the calculations are obtained from the literature or empirical curve fitting as approximation. However, the trend of the internal stress evolution can provide a guidance for failure analysis of the paste.
III. EXPERIMENT VERIFICATION
A. Weight loss profile of nanosilver paste
The weight loss profile of nanosilver paste in a chip attachment can be simulated using the model presented above. By monitoring the normalized solvent mass in the paste, the weight percentage of the paste can be calculated by Eq. (30):
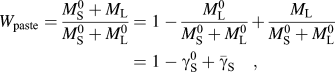 $${W_{{\rm{paste}}}} = {{M_{\rm{S}}^{\rm{0}} + {M_{\rm{L}}}} \over {M_{\rm{S}}^0 + M_{\rm{L}}^0}} = 1 - {{M_{\rm{L}}^{\rm{0}}} \over {M_{\rm{S}}^{\rm{0}} + M_{\rm{L}}^{\rm{0}}}} + {{{M_{\rm{L}}}} \over {M_{\rm{S}}^{\rm{0}} + M_{\rm{L}}^{\rm{0}}}} = 1 - {\rm{\gamma }}_{\rm{S}}^{\rm{0}} + {{{\bar \gamma }}_{\rm{S}}}\quad ,$$
where W paste is the weight percentage of the paste;  ${{{\bar \gamma }}_{\rm{S}}}$ is the average normalized solvent mass in the paste;
 $M_{\rm{S}}^{\rm{0}}$ and
 $M_{\rm{L}}^{\rm{0}}$ are the initial total masses of the solid part and liquid part of the paste, respectively; and
 ${M_{\rm{L}}}$ is the mass of the liquid part of the paste during drying.
In the simulation, the area of the paste between the chip and the substrate was 5 × 5 mm2. A quarter of the structure was meshed to 625 (25 × 25) grids, and each grid had a length of 0.1 mm.
In the experiment, the weight loss of the nanosilver paste between the chip and the substrate was characterized by using a thermogravimetric analyzer (TGA, model STA 449 C Jupiter®, Netzsch-Gerätebau GmbH, Selb, Germany). Samples for TGA were prepared as follows. The nanosilver paste was applied to an alumina substrate by stencil printing. The wet print thickness was 50 µm. Then, the paste layer was covered by an alumina chip. The area of the paste between alumina substrate and chip was 5 × 5 mm2.
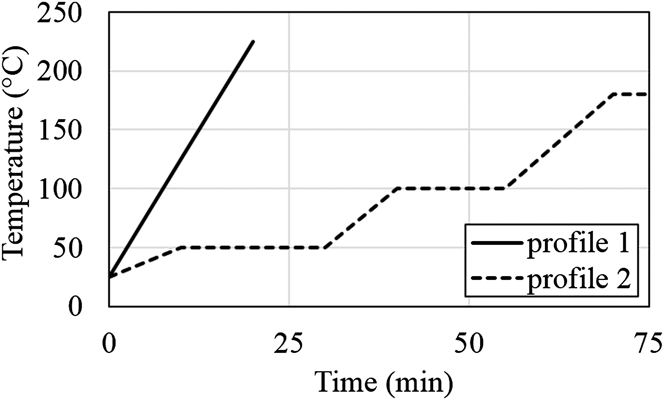
The samples were heated according to either a constant-rate or a ramp-soak temperature profile, as shown in Fig. 10. Profile 1 is a constant rate heating from 25 to 225 °C at the heating rate of 10 °C/min and profile 2 is a ramp-soak combined heating from 25 to 180 °C, the real drying profile in the nanosilver LTJT process.
Heating profiles for weight loss measurements. Profile 1 is constant ramp rate heating and profile 2 is ramp-soak combined heating.
Figures 11 and 12 show the weight loss profiles of the paste between the chip and the substrate according to constant ramp rate heating (profile 1) and ramp-soak combined heating (profile 2), respectively. In each figure, the experimental data are compared with the simulation results.
Experimental and simulated weight loss profiles for nanosilver paste in chip attachment with 5 mm chip length according to heating profile 1 (constant heating rate).
Experimental and simulated weight loss profiles for nanosilver paste in chip attachment with 5 mm chip length according to heating profile 2 (ramp-soak heating).
Figure 11 shows that the experimental and simulated weight losses are small at temperatures below 100 °C, but dramatic between 100 and 180 °C. Figure 12 shows that both the experimental and simulated weight losses are insignificant in the first 35 min (under 90 °C). Both the experimental and simulated weight loss rates gradually decrease at the 100 °C soaking stage, but increase again as the temperature goes up. Both Figs. 12 and 13 show that the simulation results are in good agreement with the experiment results.
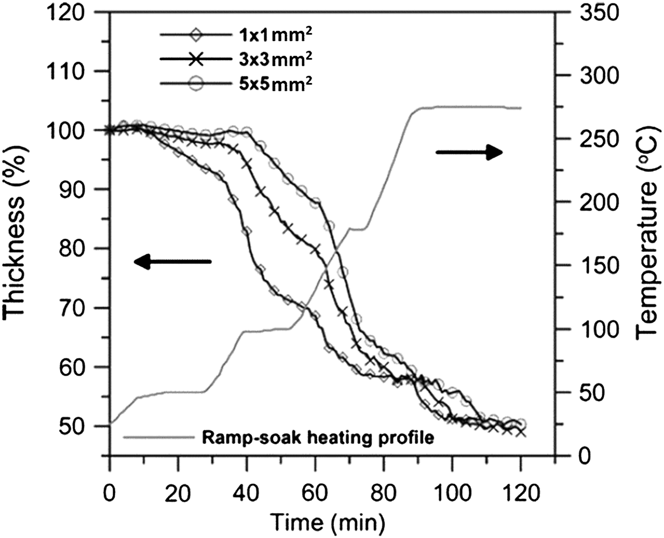
Experimental results of thickness shrinkage of nanosilver paste in 1 × 1 mm2, 3 × 3 mm2, and 5 × 5 mm2 chip attachments with heating profile 2 (ramp-soak heating).
B. Shrinkage profile of nanosilver paste
The thickness percentage of the paste can be expressed by
 $${P_{\rm{h}}} = \left( {1 - {{\rm{\varepsilon }}_z}} \right) \times 100\% = \left( {1 - \int_0^t {{{{{\dot \varepsilon }}}_z}} {\rm{d}}t} \right) \times 100\% \quad ,$$
where P h is the thickness percentage, and  ${{\rm{\varepsilon }}_z}$ and
 ${{{\dot \varepsilon }}_z}$ are the strain and strain rate of the paste along the z-direction, respectively. According to Eq. (31), the thickness percentage of the paste can be simulated during heating by monitoring the vertical strain rate.
In the model, the strain rate along the z-direction  ${{{\dot \varepsilon }}_z}$ is related to the distribution of viscosity (E), free strain rate (
 ${{{\dot \varepsilon }}_{\rm{f}}}$), and external applied pressure (
 ${P_{{\rm{apply}}}}$). Furthermore, the viscosity and free strain rate are functions of the normalized solvent mass (γS). Therefore, a comparison of the experimental and simulation results of paste shrinkage can be used to validate the model.
Figure 13 shows the experimental results of the shrinkage of the nanosilver paste in 1 × 1 mm2, 3 × 3 mm2, and 5 × 5 mm2 chip attachments during the ramp-soak combined heating,Reference Wang, Zhao, Chen, Lu, Ngo and Luo25 and Fig. 14 presents the simulation results of paste shrinkage with the same configuration of chip size and heating profile. Both the experimental and the simulation results show the same trend for each sample: the shrinkage is small in the first 40 min of heating (below 100 °C) and then increases during the 100 °C soaking. The shrinkage rate further increases with increasing temperature, and within 60–85 min, the thickness drops to 55–60% of the initial thickness, and the shrinkage rate decreases. The experimental data show further shrinkage as the temperature reaches 275 °C, the result of sintering densification, not solvent removal. Because the mechanism of sintering densification is not included in the model, the further shrinkage of paste is not shown in the numerical simulation.
Simulation results of thickness shrinkage of nanosilver paste in 1 × 1 mm2, 3 × 3 mm2, and 5 × 5 mm2 chip attachments with heating profile 2 (ramp-soak heating).
The following conclusions can be drawn from the comparison:
(i) Both the experimental and the simulation result indicate that the thickness change rate decreases with increasing size of chip attachment.
(ii) Both the experimental and the simulation result show that the final thickness after drying (at 180 °C) increases with increasing size of chip attachment.
(iii) The simulation shows the same trend as the experiment below 180 °C, indicating that the model can predict the paste drying process reasonably well.
C. Stress evolution of nanosilver paste in chip attachment
There are two different types of defects of nanosilver paste bondline in a chip attachment: cracks in the paste and delamination at the interface between the paste layer and the chip. Cracks are generated by the x–y in-plane internal stresses σx and σy, and delamination is caused by the vertical internal stress σz. Through the analysis of internal stresses, it is possible to determine the evolution of internal stresses distribution in the nanosilver paste between the chip and the substrate during the heating process. Though accurate failure criterion of cracking or debonding is not known yet, the evolution of stress distribution will help analyze and predict the possible locations at which the paste will crack or debond.
The drying of the nanosilver paste between the 10 × 10 mm2 chip and substrate at 180 °C was simulated. Only a quarter of the paste was considered for the simulation because of symmetry. In the simulation, the quarter of paste was meshed to 50 × 50 grids, each 0.1 × 0.1 mm2 in area. The evolution of the x–y in-plane and vertical internal stresses was monitored. The results are shown in Fig. 15 and Fig. 16. At the beginning of drying, the internal stresses at all locations are low. Because corners and edges are the locations at which the solvent can easily escape and deformation tends to occur, high stresses are generated first close to these locations. Then the high stresses are shifting to the center while the gradient of the normalized solvent mass at the center increases because of diffusion. The internal stresses of the paste will finally relax to zero as all the paste is completely dried (no more change of strain) according to the viscous model.
Distribution of vertical internal stress of nanosilver paste between 10 × 10 mm2 chip and substrate at 180 °C drying under zero external pressure for (a) 0 min, (b) 20 min, (c) 40 min, (d) 60 min, (e) 80 min, and (f) 100 min. For reason of symmetry, only a quarter of the paste is considered in the simulation. In each figure, the left bottom corner is the center of the chip and the right top corner is the corner of the chip.
Distribution of x–y in-plane internal stress of nanosilver paste between 10 × 10 mm2 chip and substrate at 180 °C drying under zero external pressure for (a) 0 min, (b) 20 min, (c) 40 min, (d) 60 min, (e) 80 min, and (f) 100 min. For reason of symmetry, only a quarter of the paste is considered in the simulation. In each figure, the left bottom corner is the center of the chip and the right top corner is the corner of the chip.
Because the values of some of the model parameters used to calculate the internal stresses are only approximate, the simulated values of internal stresses are not very accurate. But the trend of stress evolution is correct and should provide some guidance to the stress analysis of the paste.
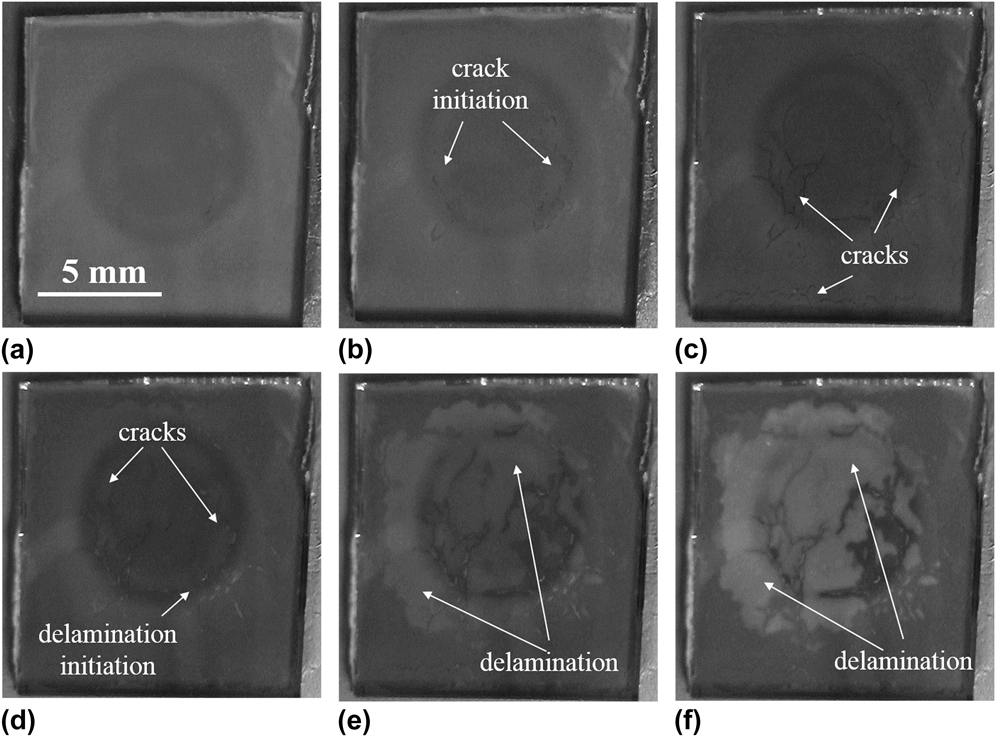
The defect formation in the paste layer under a 10 × 10 mm2 glass chip during 180 °C drying is shown in Fig. 17. Cracks are initially generated at the locations between a chip edge and the center and then move to the center. Delamination also starts at the locations between a chip edge and the center, and the final delamination area covers most of the central area under the chip. These observations are in agreement with the predicted evolution of in-plane and vertical internal stresses.
Nanosilver paste under a glass chip showing defect formation during 180 °C drying. (a)–(f) are observations from beginning to end of drying.
D. Effect of external pressure during chip attachment drying
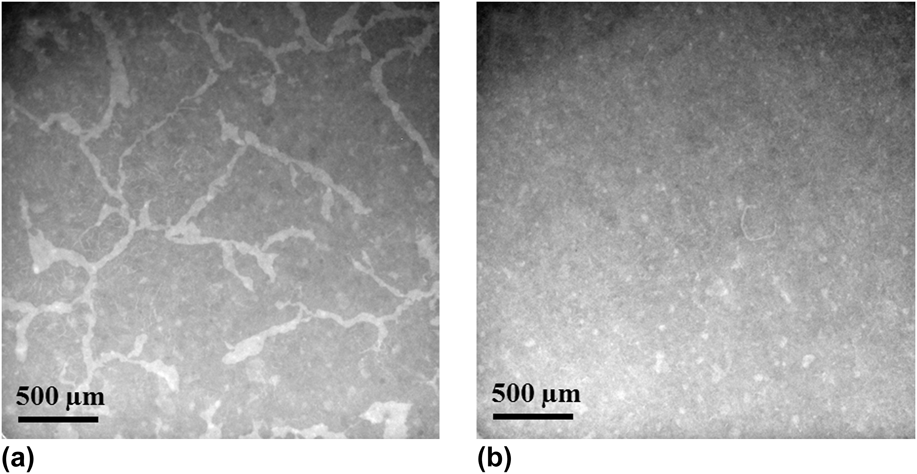
The experimental results of external pressure effect on bonding quality have already been reported in our previous study, indicating that external pressure helps to eliminate the defects in the joint layers in chip attachments,Reference Xiao, Calata, Ngo, Ibitayo and Lu26 as shown in Fig. 18. Based on the model, the evolution of the x–y in-plain internal stress and the vertical internal stress of the nanosilver paste drying under 3 MPa external pressure are shown in Figs. 19 and 20, respectively.
X-ray transmission images of (a) a sintered sample dried with zero external pressure at 180 °C and (b) a sintered sample dried with 3 MPa external pressure at 180 °C. The lighter areas in the images indicate the presence of voids and cracks.
Distribution of vertical internal stress of nanosilver paste between 10 × 10 mm2 chip and substrate at 180 °C drying under 3 MPa external pressure for (a) 0 min, (b) 20 min, (c) 40 min, (d) 60 min, (e) 80 min, and (f) 100 min. For reason of symmetry, only a quarter of the paste is considered in the simulation. In each figure, the left bottom corner is the center of the chip and the right top corner is the corner of the chip.
Distribution of x–y in-plane internal stress of nanosilver paste between 10 × 10 mm2 chip and substrate at 180 °C drying under 3 MPa external pressure for (a) 0 min, (b) 20 min, (c) 40 min, (d) 60 min, (e) 80 min, and (f) 100 min. For reason of symmetry, only a quarter of the paste is considered in the simulation. In each figure, the left bottom corner is the center of the chip and the right top corner is the corner of the chip.
During 180 °C drying, the x–y in-plane internal stress and the vertical internal stress are both lower with an external pressure of 3 MPa (as shown in Figs. 19 and 20) than with zero external pressure (as shown in Figs. 15 and 16) at the same drying time. The analysis also indicates that the internal stresses of the nanosilver paste between the chip and the substrate decrease with increasing external applied pressure during drying. At any given location, a lower vertical internal stress implies a lower possibility of debonding in the paste, and a lower x–y in-plane internal stress implies a lower possibility of crack formation in the paste, both leading to higher bonding quality.
IV. CONCLUSION
A model based on diffusion theory and viscous mechanics was developed to determine the evolution of stress and strain of the nanosilver paste in a chip attachment during the drying process. A numerical simulation algorithm of the model was realized by the C++ programming language. The program allows the determination of the evolution of solvent concentration, stress, and strain at any given drying conditions. Several nanosilver paste behaviors such as weight loss, shrinkage, and the evolution of internal stresses in the paste layer during drying were demonstrated by numerical simulation, and the results were in good agreement with experiments. The model can provide an analytical understanding of the drying behavior of nanosilver paste in chip attachment. The insight offered by this modeling study can be used to develop new paste formulations that enable pressure-free, low-temperature sintering of the die-attach material to significantly lower the cost of implementing the LTJT in manufacturing.
ACKNOWLEDGMENT
The work was supported primarily by the National Science Foundation under Award Number CBET-1048621.