Introduction
Despite the nocturnal origin of both mammals and primates, the nocturnal components of our retina (rods, rod bipolar cells, AII amacrine cells, and ganglion cells) and the nocturnal visual system in general have been relatively neglected by anatomists, electrophysiologists, and ophthalmologists (Daw et al., Reference Daw, Jensen and Brunken1990; Bloomfield & Dacheux, Reference Bloomfield and Dacheux2001). Over many years, this laboratory has amassed a comprehensive description of the retina of the capuchin monkey Cebus apella, a Platyrrhini species increasingly popular for behavioral (e.g., Brosnan & de Waal, Reference Brosnan and de Waal2003; Moura & Lee, Reference Moura and Lee2004) and electrophysiological studies (Gattass et al., Reference Gattass, Souza and Rosa1987; Rosa & Gattass, Reference Rosa and Gattass1988; Fiorani et al., Reference Fiorani, Gattass, Rosa and Sousa1989; Silveira et al., Reference Silveira, Lee, Yamada, Kremers, Hunt, Martin and Gomes1999; Lee et al., Reference Lee, Silveira, Yamada, Hunt, Kremers, Martin, Troy and da Silva Filho2000; Diogo et al., Reference Diogo, Soares, Koulakov, Albright and Gattass2003; Jansen et al., Reference Jansen, Lima and Gattass2004; Lima et al., Reference Lima, Fiorani and Gattass2004). To date, the morphology and distribution of ganglion cells (Silveira et al., Reference Silveira, Picanço-Diniz, Sampaio and Oswaldo-Cruz1989, Reference Silveira, Yamada, Perry and Picanço-Diniz1994, Reference Silveira, Lee, Yamada, Kremers, Hunt, Martin and Gomes1999; Lima et al., Reference Lima, Silveira and Perry1996; Yamada et al., Reference Yamada, Silveira and Perry1996a,Reference Yamada, Silveira, Gomes and Leeb, Reference Yamada, Silveira, Perry and Franco2001), bipolar cells (Silveira et al., Reference Silveira, Lee, Yamada, Kremers and Hunt1998), horizontal cells (dos Reis et al., Reference Dos Reis, Carvalho, Saito and Silveira2002), rods, and cones (Andrade-da-Costa & Hokoç, Reference Andrade-da-Costa and Hokoç2000; Franco et al., Reference Franco, Finlay, Silveira, Yamada and Crowley2000; Silveira et al., Reference Silveira, Yamada, Franco and Finlay2001; Finlay et al., Reference Finlay, Franco, Yamada, Crowley, Parsons, Muniz and Silveira2008) have been extensively characterized. This study adds rod bipolar cells to the catalog. Questions of particular interest are the differences in organization of rod pathways in diurnal versus nocturnal primates and the scaling of various retinal cell classes in primate eyes of varying sizes (Finlay et al., Reference Finlay, Silveira, Reichenbach and Kremers2005, Reference Finlay, Franco, Yamada, Crowley, Parsons, Muniz and Silveira2008).
Immunocytochemistry serves to differentiate bipolar cells from other retinal neurons and bipolar cell subpopulations well. Barnstable et al. (Reference Barnstable, Akagawa, Hofstein and Horn1983) first described bipolar cells in the retina of the mouse by fractionating antibodies raised to general retinal tissue. Onoda and Fujita (Reference Onoda and Fujita1987) identified a subpopulation of bipolar cells in the retina of frog using an antibody against rabbit olfactory bulb (Mab115A0), which later proved to work in mammals as well (mouse, rabbit, cat, and monkey; Onoda, Reference Onoda1988). Wood et al. (Reference Wood, Hart, Mazzei, Girard and Kuo1988) identified protein kinase C (PKC) to be a probable marker of bipolar cells, further confirmed by Greferath et al. (Reference Greferath, Grünert and Wässle1990) both in vivo and in vitro. The efficacy of PKC immunocytochemistry to selectively label bipolar cells was soon replicated in rat, rabbit, cat, chicken, and primates (Grünert & Martin, Reference Grünert and Martin1991; Osborne et al., Reference Osborne, Broyden, Barnett and Morris1991; Young & Vaney, Reference Young and Vaney1991; Zhang & Yeh, Reference Zhang and Yeh1991; Grünert et al., Reference Grünert, Martin and Wässle1994; Koulen et al., Reference Koulen, Brandstatter, Kroger, Enz, Bormann and Wässle1997; Caminos et al., Reference Caminos, Velasco, Aijón and Lara1999; Pinzón-Duarte et al., Reference Pinzón-Duarte, Kohler, Arango-Gonzalez and Guenther2000).
In the present study, the retinal bipolar cells of the capuchin monkey were identified, and their density distribution was estimated using the anti-PKCα antibody as a cellular marker. Then, the results were compared with similar data available in the literature for other primates.
Materials and methods
Animals
Seven retinae were studied, one from each of seven capuchin monkeys C. apella donated from the Primate National Center (CENP, Ananindeua, PA, Brazil). All experimental procedures obeyed the ethical guidelines of the ARVO (The Association for Research in Vision and Ophthalmology, Rockville, MD) and of the SBNeC (Brazilian Society for Neuroscience and Behavior, São Paulo, SP, Brazil).
The animals were deeply anesthetized by 1 ml/kg intramuscular injection of a 3:1 mixture of ketamine cloridrate solution (Parke-Davis, São Paulo, Brazil) and di-hydrotiazine cloridrate solution (Bayer, Porto Alegre, Brazil). They were perfused intracardially with 0.9% phosphate-buffered saline (PBS) solution, followed by 4% paraformaldehyde in 0.1 m phosphate buffer (pH 7.2). Eyes were removed and hemisected at the junction of the sclera and cornea, and one eyecup from each animal was dissected to remove the retina still attached to the choroid. The retina and choroid were kept free floating in fixative for a period of 3 h at room temperature and afterward stored in PBS at 4°C.
Tissue preparation
One of the seven retinae was sectioned perpendicular to the vitreal surface to obtain vertical sections depicting all retinal layers. The retina was immersed in 30% sucrose solution and frozen in Tissue-TeK OCT 4583 embedding medium (Sakura Finetechnical, Tokyo, Japan). Then, 20-μm-thick sections were obtained using a Jung CM 3000 cryostat (Leica, Wetzlar, Germany). The sections were collected onto gelatin-coated slices and stored at −20°C for further immunocytochemistry.
All the other six retinae were flat mounted, immersed in 30% sucrose solution, and frozen in Tissue-TeK OCT 4583 embedding medium. Then, 50-μm-thick serial slices were cut parallel to the vitreal surface using a sliding microtome to obtain horizontal sections. Most of the inner nuclear layer where the labeled cell bodies were counted (see below) remained in a single section, but some regions of it were located in additional sections. These slices were stored separately in 0.1 m phosphate buffer solution.
Retinal maps
Contours of flat-mounted whole retinae were drawn before they were sectioned using an Opemus 6 Standard photographic enlarger (Meopta, Prerov, Czech Republic). After histology, contours of flat-mounted retinal horizontal sections were drawn in the same way. These drawings were scanned, and the resulting images processed by the Scion Image software for Windows (Scion Corporation, Frederick, MD) to estimate retinal area before and after histology and to account for tissue shrinkage during processing. Overall shrinkage was negligible, and no corrections were applied.
In addition, for each retinal horizontal section, the limits of the inner nuclear layer were plotted using the microscope xy coordinates to allow for integration of counts performed in successive sections.
Immunocytochemistry
Vertical and horizontal retinal sections were processed in the same way. They were incubated with antibody anti-PKCα (Sigma Chemical, St. Louis, MO) prepared in rabbit, in the concentration of 1:100, and diluted in the proportion of 1:3000 in PBS + Triton 0.25%, by a period of 24 h for vertical sections and 48 h for horizontal sections. After incubation with the primary antibody, the tissue was again incubated with an anti-rabbit-IgG-biotinylated secondary antibody (Sigma Chemical) in the dilution of 1:200 in PBS + Triton 0.25% for 24 h. Immunoreactivity was visualized by first incubating the retina with the avidin–biotin–peroxidase complex (ABC Vectastain Standard Kit; Vector Laboratories, Burlingame, CA) for 1 h, in the dilution of 1:100 in PBS + Triton 0.25%, and then reacting for 10 min either with the DAB (3,3′-diaminobenzidine tetrahydrochloride) Chromogen System (Sigma) in the concentration of 5 mg/ml with 0.01% peroxide of hydrogen in Tris buffer pH 7.6 or with the SG Chromogen (Vector Laboratories) diluted in PBS.
Quantitative analysis
PKCα-labeled bipolar cells were counted in horizontal sections using a binocular microscope (Eclipse E600; Nikon Corporation, Tokyo, Japan) equipped with ×100 oil immersion objective and ×10 eyepieces with a 10 × 10 counting grid. The counting area was 9604 μm2. Cell counts of labeled cell bodies were performed along the vertical (dorsal–ventral direction) and horizontal (nasal–temporal direction) meridians. Four additional counting meridians were situated from the vertical and horizontal meridians in intervals of 30 deg. Counts were made at 1-mm regular intervals beginning from the fovea. To avoid double counting of cells, the stereological technique of excluding those cells intersecting two designated borders of the counting grid was employed. The density of rod bipolar cells was expressed in cells per square millimeter, and these points were used to draw isodensity lines on the retinal representation. The area of each ring defined by the isodensity contours was determined, and the cellular density in the ring taken as the average of the two bounding isodensity contours. Cell number was integrated over all isodensity rings to produce total cell number.
Results
Morphology of immunoreactive cells
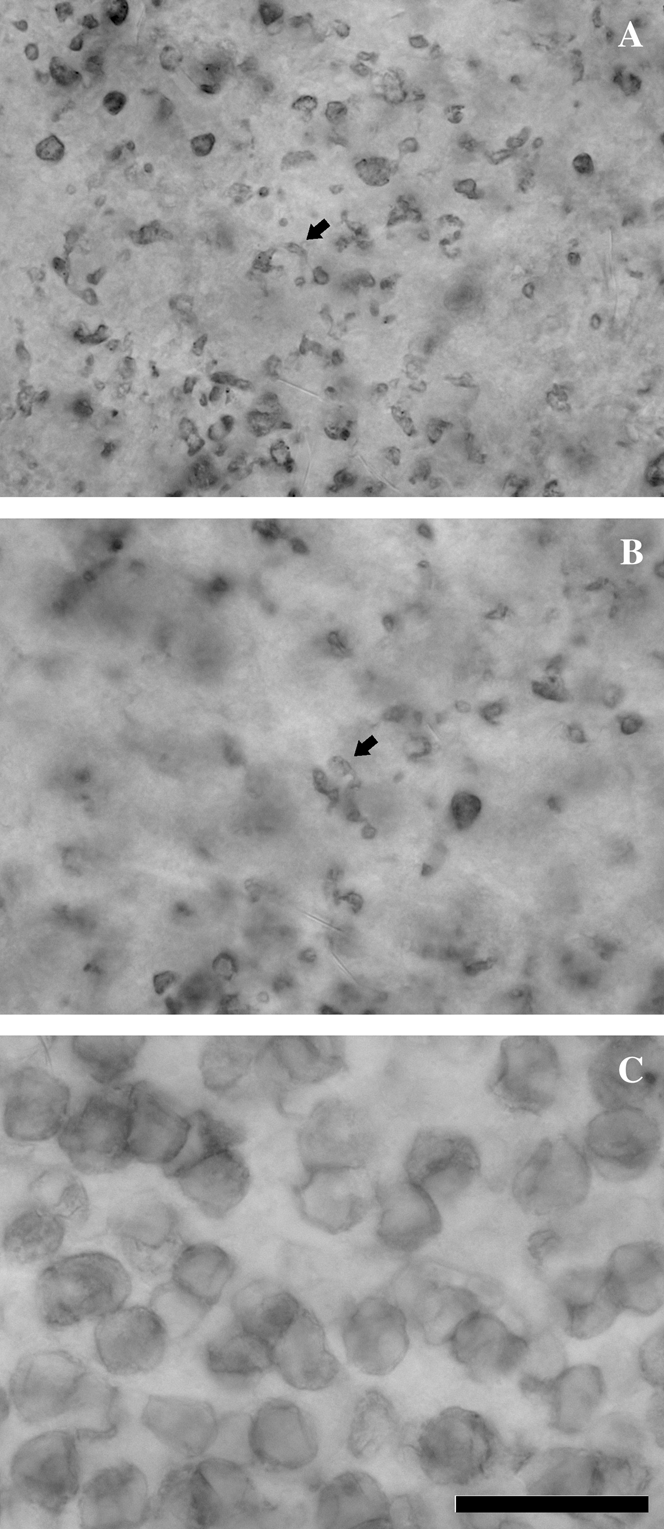
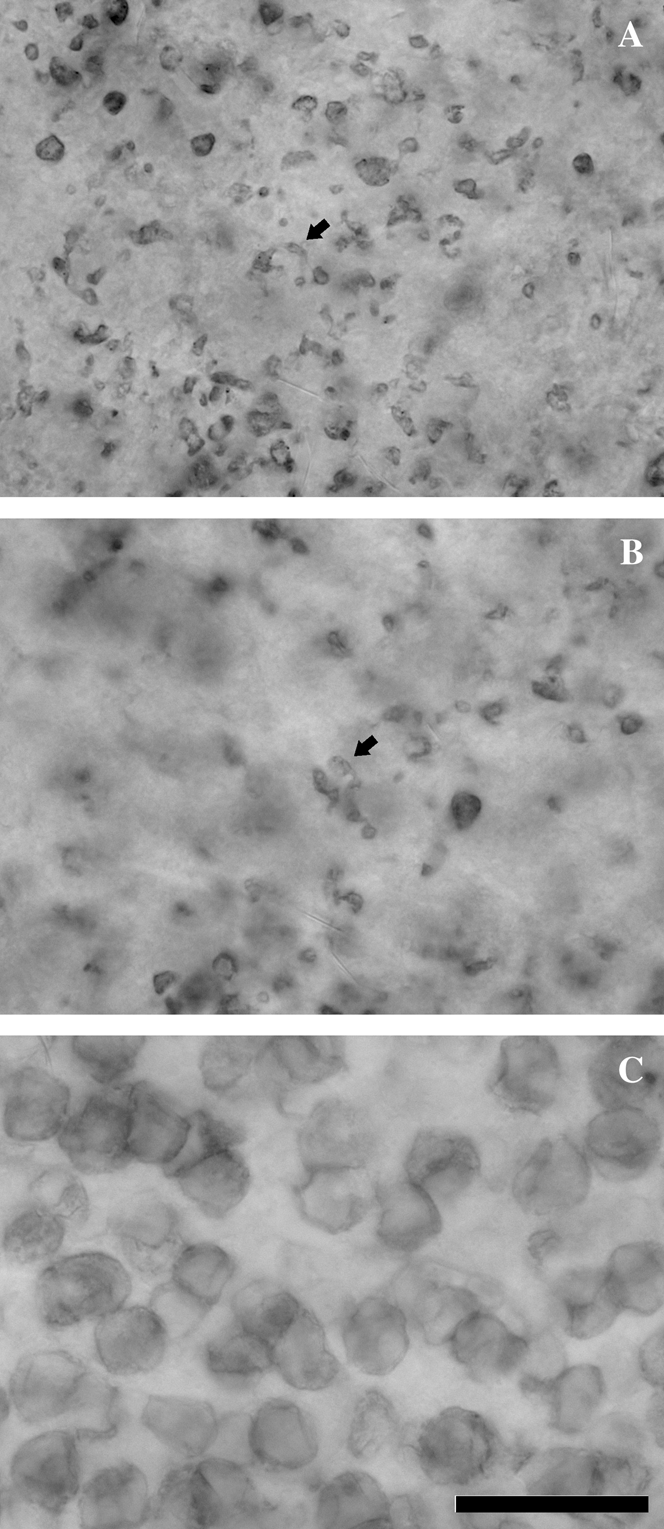
The rod bipolar cells of the C. apella retina were well labeled by visualizing the alpha isoform of protein kinase C (PKCα). In vertical sections, their morphology was very much like that of rod bipolar cells in the macaque monkey retina as demonstrated by the Golgi technique (Polyak, Reference Polyak1941; Boycott & Dowling, Reference Boycott and Dowling1969) and immunohistochemistry (Grünert & Martin, Reference Grünert and Martin1991; Grünert et al., Reference Grünert, Martin and Wässle1994). PKCα immunoreactivity strongly labeled cell bodies, dendritic branches, and axon terminals of rod bipolar cells (Figs. 1 and 2). The anti-PKCα-immunoreactive axon terminals of rod bipolar cells branch at the bottom of the inner plexiform layer sublayer “b,” in the innermost portion of the inner plexiform layer, near to the ganglion cell layer border. Anti-PKCα immunoreactivity also labeled cell bodies, dendritic trees, and axon terminals of a much less numerous class of cone bipolar cells, whose axon terminals branch in the top portion of the sublayer “b,” near to the border between sublayers “a” and “b.” These less numerous cells were presumptively identified as DB4 cone bipolar cells as previously described in the macaque monkey retina with similar techniques by Grünert et al. (Reference Grünert, Martin and Wässle1994). To correctly identify rod bipolar cells for counting, the presence of a ramifying axon that could be identified with rod bipolar cell axon morphology was thus required (see below).
Vertical sections of a capuchin monkey retina stained with anti-PKCα immunocytochemistry. (A) Anti-PKCα immunoreactivity strongly labeled cell bodies, dendritic processes, and axon terminals of rod bipolar cells (arrows). The anti-PKCα-immunoreactive axon terminals of rod bipolar cells branch at the bottom of the sublayer “b,” in the innermost portion of the IPL, near to the GCL border. They form a band of heavy staining that runs parallel to the limit between the IPL and the GCL. (B) Anti-PKCα immunoreactivity also labeled cell bodies, dendritic trees, and axon terminals of a much less numerous class of cone bipolar cells (arrow), whose axon terminals branch in the top portion of the sublayer “b,” near to the border between sublayers “a” and “b.” They form another band of heavy staining that is separated from the band of rod bipolar cell axon terminals by a less stained light band (the only staining in this light band is due to the perpendicular ascending processes of rod bipolar cells). These less numerous cells were presumptively identified as DB4 cone bipolar cells as previously described in the macaque monkey retina with similar techniques by Grünert et al. (Reference Grünert, Martin and Wässle1994). Labels for (A) and (B): OPL, outer plexiform layer; INL, inner nuclear layer; IPL, inner plexiform layer; GCL, ganglion cell layer; a, INL sublayer “a”; b, INL sublayer “b”. Scale bar = 25 μm.

Horizontal sections of a capuchin monkey retina stained with anti-PKCα immunocytochemistry. The photomicrographs were taken from the same patch of the retinal periphery at three levels of focus. (A) Focus at the innermost portion of the inner plexiform layer, near to the ganglion cell layer border. The axon terminals of rod bipolar cells branch at this level (arrow points to one of them). They exhibit a conspicuous morphology very often originating bulbous appendices. (B) Focus at an intermediate level of the inner plexiform layer. At this level, many dark puncta are seen and can be followed to rod bipolar cell axon terminals at a more inner level of the inner plexiform layer as in (A) or to rod bipolar cell somata at the inner nuclear layer as in (C). However, among these descending axons, there are some axon terminals (arrow points to one of them) originated from axons that can be traced to the inner nuclear layer somata. We presume that they are axon terminals of the DB4 cone bipolar cells as the one illustrated in Fig. 1B. (C) Focus at the level of the inner nuclear layer. The vast majority of these cell bodies originate axons that branch in innermost level of the inner plexiform layer and were identified as rod bipolar cell somata. Scale bar = 25 μm.
Density of rod bipolar cells
All horizontal sections of each retina (total of six retinae) were superimposed to determine their angular position, and all sections were counted, integrating over the sections to produce a single “flat mount” representation of each retina. Cell counting was performed for all available horizontal sections of the six retinae. The requirement of visualizing both a cell body and an axon terminal minimized the potential problem of double counting in the horizontal plane, so no stereological corrections were made for the horizontal-section dimension. In addition, we avoid counting in boundaries of two adjacent sections when both contained portions of the inner nuclear layer at some extent, preventing the necessity of adding values obtained from the same eccentricity in more than one section.
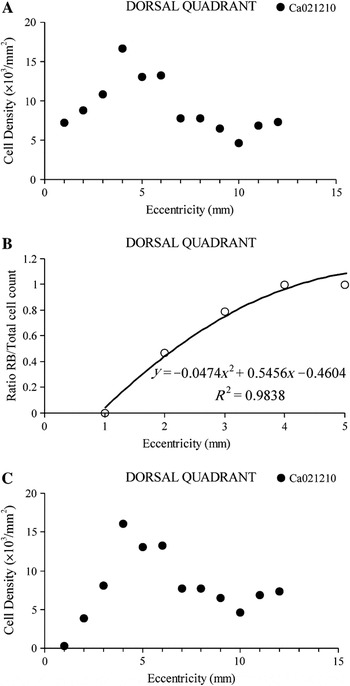
To account for the difference in the total number of labeled bipolar cells and the total number of rod bipolar cells, we corrected the total counts using the following procedure. First, we counted all anti-PKCα-labeled bipolar cell bodies at locations 1 mm apart across each retinal quadrant. The results were plotted as cell density as a function of retinal eccentricity, as illustrated for one capuchin monkey retina, dorsal quadrant (Fig. 3A). Second, we identified the labeled cells that were rod bipolar cells by tracing cell axons and axonal branches from the cell bodies down to the inner plexiform layer in retinal locations where the inner nuclear layer and the inner plexiform layer were preserved in the same horizontal section. The ratio of rod bipolar cells to the total number of labeled bipolar cells was plotted as a function of retinal eccentricity, and a second-order polynomial function was fitted to the data (Fig. 3B). Finally, rod bipolar cell density was obtained by multiplying total cell density values by the values of the polynomial function at each given eccentricity (Fig. 3C). The correction provided significant different values between the density of total labeled bipolar cells and the density of rod bipolar cells only in the central retinal region up to 4 mm of eccentricity.
The majority of capuchin monkey bipolar cells labeled with anti-PKCα immunocytochemistry were rod bipolar cells, although a small proportion of labeled cells were DB4 cone bipolar cells. To account for the difference in the total number of labeled bipolar cells and the total number of rod bipolar cells, we corrected the total counts using the following procedure. (A) First, we counted all anti-PKCα-labeled bipolar cell bodies at locations 1 mm apart and across each retinal quadrant. The results were plotted as cell density as a function of retinal eccentricity, as illustrated for the dorsal quadrant of one capuchin monkey retina. (B) Second, we identified the labeled cells that were rod bipolar cells by tracing cell axons and axonal branches from the cell bodies down to the inner plexiform layer in retinal locations where the inner nuclear layer and the inner plexiform layer were preserved in the same horizontal section. The ratio of rod bipolar cells to the total number of labeled bipolar cells was plotted as a function of retinal eccentricity, and a second-order polynomial function was fitted to the data. (C) Finally, rod bipolar cell density was obtained by multiplying total cell density values by the values of the polynomial function of (B) at each given eccentricity. The correction provided significant different values between the density of total labeled bipolar cells and the density of rod bipolar cells only in the central retinal region up to 4 mm of eccentricity.

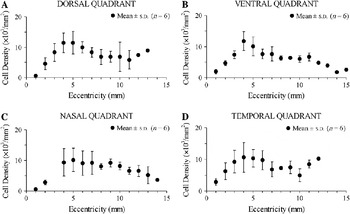
Over all the retinae, the density of rod bipolar cells increased from 500 to 2900 cells/mm2 at 1 mm from the fovea to reach a peak of 10,000–12,000 cells/mm2 at 4 mm of eccentricity (corresponding approximately to 5 deg from fovea) and then gradually decreased toward retinal periphery to values of 5000 cells/mm2 or less (Fig. 4). The number of rod bipolar cells per retina was 6,360,000 ± 387,433 (mean ± s.d., n = 6).
Average density of rod bipolar cells as a function of eccentricity for six capuchin monkey retinae. Rod bipolar cell density was estimated as described in Fig. 3 and presented as mean (circles) and s.d. (vertical lines) as a function of eccentricity. There were little or no differences between dorsal (A), ventral (B), nasal (C), and temporal (D) quadrants. Rod bipolar cell density rose from 500 to 2900 cells/mm2 at 1 mm from the fovea, reached a peak of 10,000–12,000 cells/mm2 at 4 mm of eccentricity, and then gradually decreased toward retinal periphery to values of 5000 cells/mm2 or less.

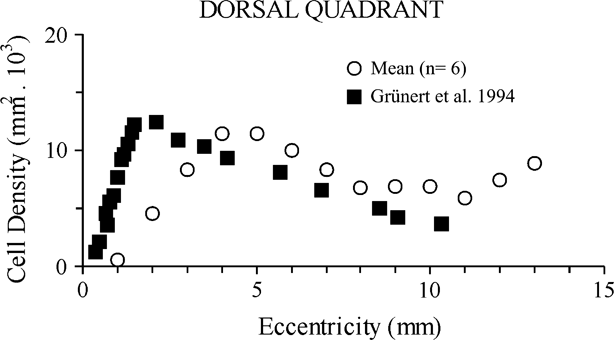
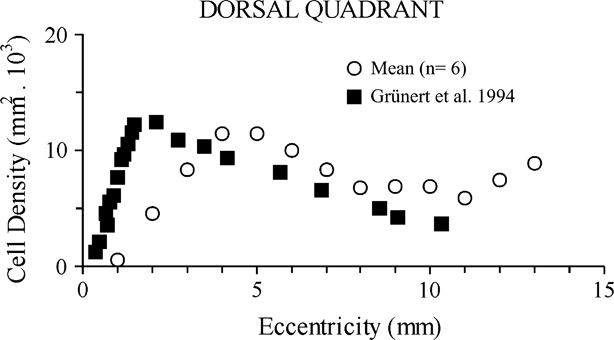
A comparison between the retinae of capuchin monkey and macaque monkey regarding rod bipolar cell density at different eccentricities is shown in Fig. 5 for the dorsal quadrant. Macaque monkey data were obtained from results published by Grünert et al. (Reference Grünert, Martin and Wässle1994; their fig. 14) and plotted together with capuchin monkey data collected in this work. Both data sets were corrected for the presence of anti-PKCα-positive cone bipolar cells. Capuchins and macaques had about the same rod bipolar cell density peaks, but in the macaque monkey retina, the density of rod bipolar cells peaked at a lower eccentricity (1–2 mm) in comparison with the capuchin monkey retina (4–5 mm). Rod bipolar cell density is higher in the macaque monkey retina in the central region up to 3 mm of eccentricity but then became lower than that in the capuchin monkey retina at more peripheral eccentricities.
Comparison between capuchin and macaque monkey retinas: rod bipolar cell density at different eccentricities across the dorsal quadrant. Macaque monkey data (filled squares) were obtained from the results published by Grünert et al. (Reference Grünert, Martin and Wässle1994; their fig. 14) and plotted together with capuchin monkey data (empty circles) collected in this work and showed in Fig. 4A. Rod bipolar cell density peaked with similar values in capuchins and macaques, but in macaques, the peak occurred at a lower eccentricity (1–2 mm) in comparison with capuchins (4–5 mm). Rod bipolar cell density is higher in the macaque monkey retina in the central region up to 3 mm of eccentricity but then became lower than that in the capuchin monkey retina at more peripheral eccentricities.
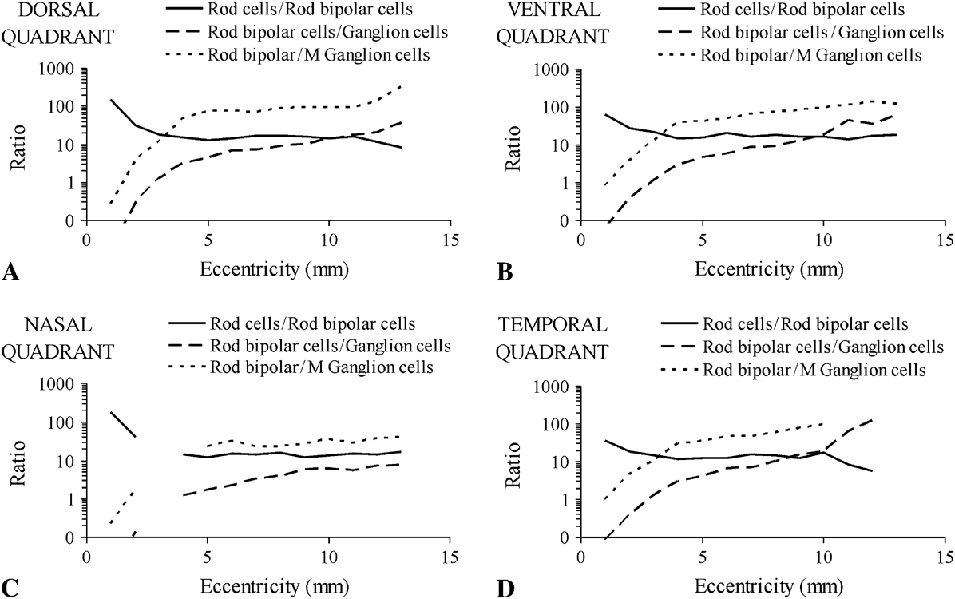
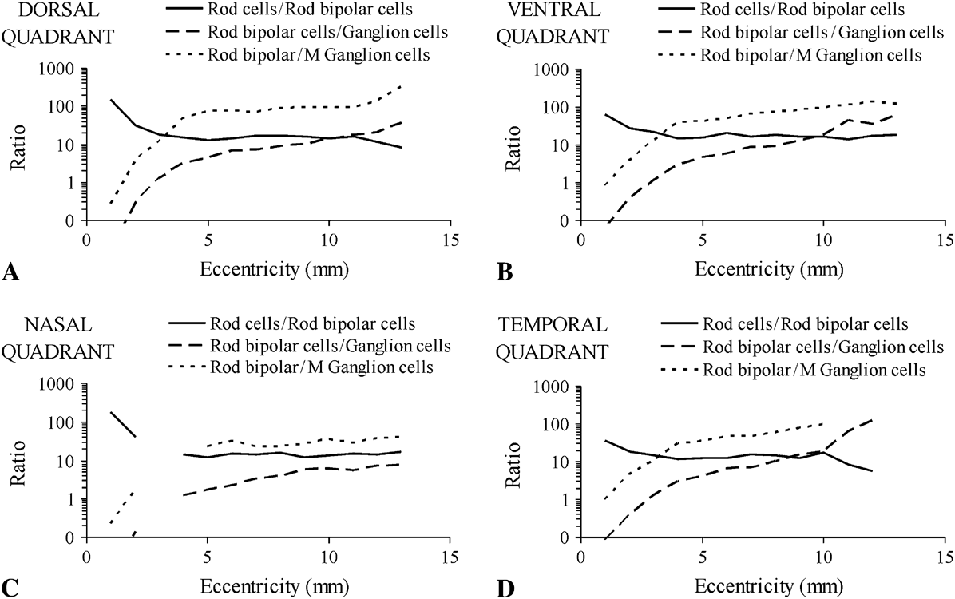
The convergence ratio of rod to rod bipolar cells and from rod bipolar cells to ganglion cells across the four retinal quadrants is shown in Fig. 6. Cell densities were mean values for six different retinae in each eccentricity as estimated for rod bipolar cells in this work, for rods by Finlay et al. (Reference Finlay, Franco, Yamada, Crowley, Parsons, Muniz and Silveira2008), for the total ganglion cell population by Silveira et al. (Reference Silveira, Picanço-Diniz, Sampaio and Oswaldo-Cruz1989), and for the M ganglion cells (ganglion cells that project to the magnocellular layers of the lateral geniculate nucleus, also called parasol ganglion cells) by Lima et al. (Reference Lima, Silveira and Perry1996). The convergence ratio of rod to rod bipolar cells remains between 10 and 20 along most of the retina, but there was a consistent increase in the central 1–2 mm of all quadrants. The convergence ratio of rod bipolar cells to ganglion cells or to M ganglion cells increased from the central region toward retinal periphery in all quadrants, reaching higher values in the temporal, dorsal, and ventral quadrants in comparison with the nasal quadrant. The convergence to M ganglion cells is about 5 (nasal quadrant) or 10 (other quadrants) times higher than that to the whole ganglion cell population, consistently with these cells representing about 10–20% of all ganglion cells (Silveira & Perry, 1991).
Convergence ratio of rod to rod bipolar cells and from rod bipolar cells to ganglion cells in the dorsal (A), ventral (B), nasal (C), and temporal (D) retinal quadrants. The convergence ratio of rod to rod bipolar cells (continuous lines) remains between 10 and 20 along most of the retina, but there was a consistent increase in the central 1–2 mm of all quadrants (see text for discussion). The convergence ratio of rod bipolar cells to ganglion cells (traced lines) or to M ganglion cells (ganglion cells that project to the magnocellular layers of the lateral geniculate nucleus, also called parasol ganglion cells) (dotted lines) increased from the central region toward retinal periphery in all quadrants, reaching higher values in the temporal, dorsal, and ventral quadrants in comparison with the nasal quadrant. The convergence to M ganglion cells is about 5 (nasal quadrant) or 10 (other quadrants) times higher than that to the whole ganglion cell population once these cells represent about 10–20% of all ganglion cells (Silveira & Perry, 1991). Cell densities were mean values obtained from six different retinae in each eccentricity. Sources: rod bipolar cell density, this work; rod density, Finlay et al. (Reference Finlay, Franco, Yamada, Crowley, Parsons, Muniz and Silveira2008); ganglion cell density, Silveira et al. (Reference Silveira, Picanço-Diniz, Sampaio and Oswaldo-Cruz1989); M ganglion cell density, Lima et al. (Reference Lima, Silveira and Perry1996).
Discussion
Immunoreactivity of rod bipolar cells
Protein kinase C is an important member of the cell signaling pathway utilizing second messenger proteins (Nishizuka, Reference Nishizuka1984). The specificity and sensitivity of neuronal labeling are related to the isoenzyme recognized by the antibody, to the region of nervous tissue studied, and to the species of animal investigated (Wood et al., Reference Wood, McCord and Osborne1997). Across species, more cells than rod bipolars can be labeled by anti-PKC reactions. For example, Negishi et al. (Reference Negishi, Kato and Teranishi1988) used a rat monoclonal antibody against PKC from bovine brain sold by Amersham Biosciences (Little Chalfont, Buckinghamshire, England) (clone MC5; RPN 536) to label dopaminergic neurons of mammals, batrachians, chelonians, and fish retinae, as well as the rod bipolar cells of mammals and fishes.
Kolb et al. (Reference Kolb, Zhang and Dekorver1993) used anti-PKCα, anti-PKCβ, and anti-PKCγ monoclonal antibody prepared in mouse (Seikagaku America, Rockville, MD) to label human retina. Anti-PKCα immunocytochemistry prominently labeled rod bipolar cells of human retina, but it also labeled S-cone bipolar cells. Later, S-cone bipolar cells of macaque monkey fovea were labeled using the same anti-PKC monoclonal antibody (Kolb & Zhang, Reference Kolb and Zhang1997).
Grünert and Martin (Reference Grünert and Martin1991) tested three different antibodies in Macaca retina. The first was the anti-PKC(α+β) monoclonal antibody (Amersham Biosciences). The second was the polyclonal antiserum against the L7 protein (Roche Institute of Molecular Biology, Nutley, NJ). The third was the monoclonal antibody MAb115A10 (Gunma University, Gunma, Japan). They showed that rod bipolar cells of Macaca are sensitive to all antibodies used. However, only the anti-PKC(α+β) monoclonal antibody showed enough specificity for a quantitative study of this cellular class. Grünert et al. (Reference Grünert, Martin and Wässle1994), studying different types of cone bipolar cells of Macaca, observed that the anti-PKCα monoclonal antibody (Seikagaku, Tokyo, Japan) marked rod bipolar cells the most strongly but also DB4 diffuse cone bipolar cells. They distinguished these two cell types by their pattern of axonal ramification.
At this work, the antibody against the alpha isoform of protein kinase C (Sigma) labeled rod bipolar cells of the C. apella retina with comparable specificity to that shown by Grünert et al. (Reference Grünert, Martin and Wässle1994). Thus, diffuse bipolar cells (DB4) are likely to have been included in the total counts of labeled bipolar cells. We used the Grünert et al. (Reference Grünert, Martin and Wässle1994) approach to check the rod bipolar identity by carefully observing their pattern of axonal ramification in such a way that we could correct the total counts and thus provide a better estimate of rod bipolar cell density (Fig. 3). However, we could not rule out some inflation due to the presence of S-cone bipolar cells among the labeled cells. Given Kolb’s analysis, it is possible that the inclusion of S-cone bipolar cells could have caused an overestimation of density values for rod bipolar cells by about 4–10% depending on retinal region if the S-cone bipolar cells were indeed labeled with the anti-PKCα antibody that we used.
Comparison of rod bipolar cell density between different primates
The higher primates Anthropoidea can be monochromats, dichromats, or trichromats, having one, two, or three types of cones, beyond rods (Jacobs, Reference Jacobs1998; Tan & Li, Reference Tan and Li1999; Lee et al., Reference Lee, Silveira, Yamada, Hunt, Kremers, Martin, Troy and da Silva Filho2000). The distribution of cones and rods in the retina of many Anthropoidea has already been described for humans, great apes, and catarrhine monkeys (Homo: Curcio et al., Reference Curcio, Sloan, Kalina and Hendrickson1990; Papio: Krebs & Krebs, Reference Krebs and Krebs1989; Macaca: Perry & Cowey, Reference Perry and Cowey1985; Krebs & Krebs, Reference Krebs and Krebs1989; Packer et al., Reference Packer, Hendrickson and Curcio1989; Wikler et al., Reference Wikler, Williams and Rakic1990; Cercopithecus: Perry & Cowey, Reference Perry and Cowey1985), for platyrrhine monkeys (Alouatta: Franco et al., Reference Franco, Finlay, Silveira, Yamada and Crowley2000; Aotus: Ogden, Reference Ogden1975; Wikler & Rakic, Reference Wikler and Rakic1990; Franco et al., Reference Franco, Finlay, Silveira, Yamada and Crowley2000; Cebus: Andrade-da-Costa & Hokoç, Reference Andrade-da-Costa and Hokoç2000; Franco et al., Reference Franco, Finlay, Silveira, Yamada and Crowley2000; Saimiri: Rolls & Cowey, Reference Rolls and Cowey1970; Franco et al., Reference Franco, Finlay, Silveira, Yamada and Crowley2000; Saguinus: Franco et al., Reference Franco, Finlay, Silveira, Yamada and Crowley2000; Callithrix: Troilo et al., Reference Troilo, Howland and Judge1993; Wilder et al., Reference Wilder, Grünert, Lee and Martin1996; Franco et al., Reference Franco, Finlay, Silveira, Yamada and Crowley2000), for the tarsier (Tarsius: Hendrickson et al., Reference Hendrickson, Djajadi, Nakamura, Possin and Sajuthi2000), and for prosimians (Galago: Wikler & Rakic, Reference Wikler and Rakic1990; Microcebus: Dkhissi-Benyahya et al., Reference Dkhissi-Benyahya, Szel, Degrip and Cooper2001). The photoreceptor topography of primates, excepting Tarsius (Silveira, Reference Silveira, Kaas and Collins2004), has been described as consisting of three basic patterns: two in diurnal primates and one in nocturnal primates. The two diurnal patterns are dependent on the size of the eye, both in Catarrhini and in Platyrrhini, with those primates with small eyes, as Callithrix and Saguinus, having a low proportion of rods regarding to cone, while primates with medium to big eyes, as in humans and many others Catarrhini, such as Macaca, and diverse Platyrrhini, such as Cebus, have an intermediate ratio of rod cells to cone cells (Silveira, Reference Silveira, Kaas and Collins2004).
More recently, however, looking over a larger range of primates, it has become clear that the number of rods scales up rapidly and regularly to tile the retinal surface evenly as the eye enlarges, while the number of cones and retinal ganglion cells increases much less. This differential scaling keeps the sensitivity function of rods and the acuity of cones roughly constant as the eye increases in size (Finlay et al., Reference Finlay, Silveira, Reichenbach and Kremers2005, Reference Finlay, Franco, Yamada, Crowley, Parsons, Muniz and Silveira2008). Therefore, there appears to be only one “type” of diurnal primate eye, with the different proportions of rods and cones predicted by an across-primate scaling pattern. Nocturnal primates as the Aotus and the Galago exhibit a high proportion of rod cells regarding to cone cells and lack a completely developed fovea (Silveira, Reference Silveira, Kaas and Collins2004). The pattern of scaling of rod bipolar cells with eye size can further illuminate how retinal function is conserved at multiple scales.
The results found in the present work are directly comparable to the study by Grünert et al. (Reference Grünert, Martin and Wässle1994) on Macaca, where the density variation of rod bipolar cells as a function of eccentricity was evaluated for the dorsal and ventral quadrants without correction for anti-PKCα-positive cone bipolar cells (Grünert and Martin, Reference Grünert and Martin1991) and for the dorsal quadrant with correction for anti-PKCα-positive cone bipolar cells (fig. 14A of Grünert et al., Reference Grünert, Martin and Wässle1994). We have found that for both comparisons, either without correction (not illustrated) or with correction for anti-PKCα-positive cone bipolar cells (Fig. 5), there was some consistent difference between Cebus and Macaca. In Cebus, the rod bipolar cell density rises more gradually and peaks at a larger distance from the fovea than in Macaca, matching in location the approximately circular zone of highest rod density that occurs between 3 and 5 mm of eccentricity, as it can be seen in the published rod density maps (fig. 10 of Andrade-da-Costa & Hokoç, Reference Andrade-da-Costa and Hokoç2000; fig. 4 of Finlay et al., Reference Finlay, Franco, Yamada, Crowley, Parsons, Muniz and Silveira2008) and in the rod density profiles across the dorsal quadrant (fig. 11B of Andrade-da-Costa & Hokoç, Reference Andrade-da-Costa and Hokoç2000; fig. 2D of Finlay et al., Reference Finlay, Franco, Yamada, Crowley, Parsons, Muniz and Silveira2008). In Macaca, Wikler et al. (Reference Wikler, Williams and Rakic1990) reported that rod density is particularly high in an annulus around the fovea that extends from 2–3 to 6–8 mm of eccentricity. A close inspection of fig. 3D of Wikler et al. (Reference Wikler, Williams and Rakic1990), where the rod density profile across the dorsal–ventral direction is plotted for nine different retinae obtained from nine different animals, reveals two important aspects. First, there is a twofold difference in rod peak density across animals. Second, the rod density peak is located in a range of locations in different animals, varying from 2 to 6 mm of eccentricity. The macaque monkey retina analyzed by Grünert et al. (Reference Grünert, Martin and Wässle1994) shows a good match between the density profiles of rods and rod bipolars, especially regarding how the density raises in the first 2 mm from the fovea and the location of the density peak for these two cell populations. The retina analyzed by Grünert et al. (Reference Grünert, Martin and Wässle1994) seems to be placed at one end of the range reported by Wikler et al. (Reference Wikler, Williams and Rakic1990) and had the density peaks of rod and rod bipolars located quite near to the fovea. Thus, we interpreted the differences found in rod bipolar density between our mean values for the Cebus retinae and the values reported by Grünert et al. (Reference Grünert, Martin and Wässle1994) for the Macaca retina that they studied as due to the individual variability in the rod system topography for macaque monkeys.
Consistently with the differences observed in the central retina and with the general similarity along most of the paracentral and peripheral retina between these two primates, rod to rod bipolar cell convergence ratio remained between 10 and 20 across most of the retinal extension in Cebus (this work, Fig. 6) and Macaca (fig. 14B of Grünert et al., Reference Grünert, Martin and Wässle1994). Macaca has a larger retina than Cebus (670 vs. 565 mm2) and a similar density of rods (1.0–1.4 × 10⁵/mm2), resulting in an overall greater number of rods in Macaca versus Cebus retina (61 million vs. 53 million) (Cebus: Andrade-da-Costa & Hokoç, Reference Andrade-da-Costa and Hokoç2000; Franco et al., Reference Franco, Finlay, Silveira, Yamada and Crowley2000; Macaca: Packer et al., Reference Packer, Hendrickson and Curcio1989; Wikler et al., Reference Wikler, Williams and Rakic1990). In spite of the difference in the central retina, the density variation of rod bipolar cells in the Cebus and Macaca as well as the convergence from rod to rod bipolar cells are generally similar, suggesting that both retinae stabilize similar sensitivity (as measured by rod density) and convergence.
Rod pathway: Comparison of cellular density variation according to eccentricity
The rod pathways of Old World monkeys and anthropoid apes (Catarrhini) have been the most studied, particularly for the Macaca genus. With the exception of the nocturnal owl monkey Aotus sp., the New World monkeys, the Platyrrhini, have been studied rather less (Silveira et al., 2001; Yamada et al., 2001; Luo et al., Reference Luo, Ghosh, Martin and Grünert1999; Franco et al., Reference Franco, Finlay, Silveira, Yamada and Crowley2000; Chan et al., Reference Chan, Martin, Clunas and Grünert2001; Finlay et al., Reference Finlay, Franco, Yamada, Crowley, Parsons, Muniz and Silveira2008). In general, however, subject to regular scaling phenomena, the organization of the retinae of both suborders with regard to the rod pathway is quite similar.
Rods and rod bipolar cells in all these diurnal primates reach their peak in a plateau approximately 3–5 mm from central fovea. From that point, the density of both rods and rod bipolars drops somewhat toward the retinal periphery, while ganglion cell density drops steeply, producing a sharply increasing convergence of rods to ganglion cells (Fig. 6). Interestingly, the density of rods is increased in every retinal location, and the density of ganglion cells decreased in the nocturnal owl monkey, Aotus azarae, and the effect of both changes would be an increase in both sensitivity and convergence (Finlay et al., Reference Finlay, Franco, Yamada, Crowley, Parsons, Muniz and Silveira2008). It is commonplace to assume that the duplex retina, whether biased toward primarily diurnal vision, as in Cebus, or primarily nocturnal vision, as in Aotus, involves some sort of compromise between the optimization of both systems. Future research will attempt to determine in a systematic way the terms of that compromise.
Acknowledgments
This research was supported by grants from CNPq #486351/2006-8, #620248/2006-8, #620037/2008-3; CNPq-PRONEX/FAPESPA #2268; CNPq/NSF #910149/1996-8; and FINEP “Rede Instituto Brasileiro de Neurociência (IBN-Net)” #01.06.0842-00. S.V.O.C.L. and A.R.R. received fellowships for graduate students from CAPES-PROF and CNPq, respectively. DHB and LCLS are CNPq research fellows. The authors are thankful to Ulrike Grünert and Heinz Wässle for helpful comments about this work during an ARVO poster session some years ago.