Introduction
Rare-earth element (REE) resources have been found in highly weathered rocks containing kaolin, e.g. regolith-hosted or lateritic deposits, including mined kaolin deposits (e.g. Bao & Zhou, Reference Bao and Zhao2008; Bern et al., Reference Bern, Yesavage and Foley2017; Cheshire et al., 2018; Li et al., Reference Li, Zhao and Zhou2017; Li et al., Reference Li, Zhou and Williams-Jones2020; Li & Zhou, Reference Li and Zhou2020). Occurrences of REE in the Georgia kaolins (Cheshire et al., 2018; Elliott et al., Reference Elliott, Gardner, Malla and Riley2018; Sanematsu & Watanabe, 2016) opened questions about the provenance of the REE-bearing minerals and the secondary geochemical processes concentrating the REE in the Georgia kaolin deposits. Given the critical nature of the REE, alternative sources of the REE such as recovery from mine overburden or tailings could comprise potential resources for the REE in addition to the REE from the mined kaolin. This paper focused on describing the mineralogic and geochemical processes leading to the occurrences of the REE from mined kaolins together with the REE from mine tailings and sands of the overlying stratigraphy to the mined kaolins. These data together permitted a more comprehensive understanding of the mineralogic and geochemical processes of REE observed in the Georgia kaolin deposits.
The REE comprise 17 elements in Column 3 (IIIB) of the Periodic Table of the Elements (Sc, Y, and the Lanthanide Series; IUPAC: Connelly et al., 2005). The light-REE (LREE) are considered to be La–Gd and the heavy-REE (HREE) of the lanthanide series are Tb–Lu (Van Gosen et al., 2019). Y is considered as a HREE because of similarity in occurrence with other HREE, as well as comparable ionic radius and charge to Ho (Bern et al., Reference Bern, Shah, Benzel and Lowers2016; Bunzli, 2013; Chakhmouradian & Wall, Reference Chakhmouradian and Wall2012; Tepe & Bau, Reference Tepe and Bau2016). Sc is also considered a HREE in some studies (Mioduski, Reference Mioduski1993; Teitler et al., Reference Teitler, Cathelineau, Ulrich, Ambrosi, Munoz and Sevin2019). These elements are critical metals and disruption of their supply streams would impact adversely many important technologies (Fortier et al., 2018). The derivation of new domestic supplies of the REE and other critical metals are in all countries’ national interest. Historically, much production of the REE has been from the mining of hard-rock deposits (Bayan Obo, China, and Mountain Pass, California; Verplanck et al., 2014). REE are extracted currently from highly weathered laterite in SE China (Li & Zhou, Reference Li and Zhou2020) and from REE concentrates derived from Zr-Ti heavy-mineral beach placers in SE Georgia (Bailey, 2021; Oladeni et al., 2021). New resources of the REE will continue to be derived from the exploration of REE occurrences in sedimentary and regolith settings such as kaolins, bauxites, and laterites.
REE are associated commonly with mineralogically mature minerals (zircon, garnet, monazite, xenotime) in sediments and clastic sedimentary rocks (Piper, Reference Piper1974). In the southeast United States, monazite belts in the Piedmont and adjacent placers are known sources of light rare-earth elements (LREE) as well as Th (Mertie, Reference Mertie1953, 1975). Enrichments of the REE were noted in alluvial sediments in the Georgia Coastal Plain and in weathered Piedmont regolith in proximity to the Fall Line (Bern et al., Reference Bern, Shah, Benzel and Lowers2016, Reference Bern, Yesavage and Foley2017; Cheshire et al., 2018). Further in the Georgia Coastal Plain, heavy-mineral sands rich in Ti and Zr are being processed to concentrate monazite (Oladeni et al., 2021). Presently, these sands are processed to obtain Th and U (Bailey, 2021). Weathering and sedimentological processes concentrating mineralogically mature REE minerals in certain depositional environments would be expected, therefore, to concentrate the REE (Morton & Hallsworth, 2007; Piper, Reference Piper1974). Thus, highly weathered sedimentary rocks such as ore deposits of kaolins and bauxites, including from a number of studies from the Georgia Coastal Plain (Cheshire, 2011; Cheshire et al, 2018; Dombrowski, 1992, 1993; Elliott et al., Reference Elliott, Gardner, Malla and Riley2018), would be considered to be exploration targets for important domestic REE resources.
Whole-rock analyses including Sc and transition metals have been used to indicate the source rocks for the Cretaceous and Eocene kaolins (Dombrowski, 1992, 1993). The source of the Cretaceous kaolins was speculated from trace element geochemistry patterns as originating from weathering of granitic source rocks of the Piedmonts (e.g. Sparta Granite). The source(s) of the Eocene kaolins were proposed to be from the Little River Group metavolcanics and/or a mixture of sources in the Piedmont terrane (Dombrowski, 1992).
In subsequent studies related to kaolin deposit genesis, LREE and the precipitation of secondary phosphates (such as florencite) were observed in the mined Cretaceous kaolin units and in the regolith of the Sparta Granite (Cheshire, 2011; Cheshire et al., 2018). These results opened the possibility of sorption of released REE onto mineral surfaces (e.g. Li & Zhou, Reference Li and Zhou2020). Lastly, the heavy-mineral subfraction derived from the coarse fraction of the mined kaolin (i.e. gangue minerals or “grit”; Murray, 1976) contained considerable amounts of the REE (0.5 wt.% total REE; Elliott et al., Reference Elliott, Gardner, Malla and Riley2018). This heavy subfraction was enriched in the heavy rare-earth elements (HREE) relative to their concentrations in upper continental crust (UCC, Rudnick & Gao, 2003). Xenotime and possibly zircon were approximated as likely phases containing these HREE in the heavy subfraction of kaolin mine-tailings waste (Elliott et al., Reference Elliott, Gardner, Malla and Riley2018).
Other investigations into prospective occurrences of the REE in sedimentary systems include deep-sea polymetallic-manganese nodules (Pak et al., Reference Pak, Seo, Lee and Hyeong2018), seafloor sulfide deposits (Hein et al., Reference Hein, Mizell, Koschinsky and Conrad2013), and deep-sea sediments containing biogenic calcium phosphate (Yasukawa et al., Reference Yasukawa, Ohta, Mimura, Tanaka, Takaya, Usui, Fujinaga, Machida, Nozaki, Iijima, Nakamura and Kato2018). Non-traditional, potential REE sources may include industrial by-products (separates and waste). Examples of potential REE-feedstocks include beneficiation process separates from low-grade magnetite iron ore (Yan et al., Reference Yan, Zhang, Yang and Mclean2019) and coal fly-ash (Liu et al., Reference Liu, Huang and Tang2019). These non-traditional sources along with those related to the mining of kaolin (such as mine tailings) are potential REE resources which could be considered to address the increased demand for these critical metals.
The endowment of potential REE in the Georgia kaolins would have resulted from transport and deposition of detrital REE-bearing phases (zircon, monazite, and xenotime) with the other siliciclastic sediments building out the Coastal Plain during the late Mesozoic to Cenozoic eras. Secondary weathering processes (diagenesis) of the Paleocene and Cretaceous sediments influenced further the REE signatures compared to their source saprolites, including the remobilization of REE from the detrital host REE-minerals then facilitating REE fractionation (Cheshire et al., 2018). LREE associated with secondary phosphates (florencite, crandallite) in the fine fraction stimulated research questions addressing the reasons for the HREE enrichment in the coarse fractions shown by Elliott et al. (Reference Elliott, Gardner, Malla and Riley2018).
The comprehensive approach undertaken in this study (kaolins, mine tailings, and associated sand lithologies) presents new findings of diagenetic xenotime overgrowths on zircon in the Georgia kaolins, offering explanation for the apparent mechanisms fractionating HREE from LREE. These results combined with the results for the Marion Member sands containing considerable amounts of LREE provided insight into understanding the role of incorporation of these sands during kaolin mining, REE-hosting potential, and patterns of enrichment for the Georgia kaolin deposits.
Geologic Background
The kaolin deposits of the central Georgia, Upper Coastal Plain consist of Cretaceous, Paleocene, and Eocene age lithologies (sands and kaolins) comprising the Oconee Group. Kaolin of the Oconee Group is mined predominantly from the Buffalo Creek Member (Cretaceous Gaillard Formation) and the Jeffersonville Member (Eocene Huber Formation; Buie & Schrader, 1982; Elzea-Kogel et al., 2002; Huddlestun & Hetrick, 1991; Patterson & Murray, Reference Patterson and Murray1984; Pickering & Hurst, 1989). The sedimentary rocks are typically sand-dominated, containing abundant erosional-depositional sequences including channel-fill deposits and medium- to coarse-sand sequences with cross-bedding, mica flakes, and kaolinitic clasts (La Moreaux, 1946; Buie et al., Reference Buie, Hetrick, Patterson and Neeley1979; Elzea-Kogel et al., 2002; Huddlestun, 1982; Nystrom & Willoughby, 1982; Patterson & Murray, Reference Patterson and Murray1984). The mined kaolin beds are lenticular, laterally discontinuous units that may exceed 10 m or more in thickness found within the sand-dominated siliciclastic rocks (Elzea-Kogel et al., 2002; Murray & Keller, 1993; Patterson & Murray, Reference Patterson and Murray1984).
The siliciclastic sediments were deposited along the Fall Line trend in near-shore fluvial- to tidal-dominated estuarine, deltaic, and tidal-flat environments (Elzea-Kogel et al., 2002; Patterson & Murray, Reference Patterson and Murray1984). These depositional environments were filled by continental-derived and reworked sediments during the major transgressive and regressive cycles of the late Cretaceous to early Eocene period (Elzea-Kogel et al., 2002; Hurst & Pickering, Reference Hurst and Pickering1997; Owens & Gohn, Reference Owens, Gohn and Poag1985; Pickering & Hurst, 1989; Poag & Schlee, 1984; Reinhardt, 1979). The Piedmont crystalline rocks were the primary source of eroded material transported during the Cretaceous to Eocene at the Fall Line trend (Fig. 1), dividing the Piedmont Plateau crystalline rocks from the Coastal Plain (Hack, 1982; Hinckley, Reference Hinckley1965; Owens & Gohn, Reference Owens, Gohn and Poag1985; Pavich, Reference Pavich1989). Source rocks of the Piedmonts included granite, gneiss, and phyllites rich in feldspars and micas altered to kaolin (Murray, 2007).
State map of Georgia showing major geologic provinces and mining districts (after Patterson & Murray, Reference Patterson and Murray1984), major rivers defining the central Georgia Upper Coastal Plain, sampling, and stratigraphic section locations

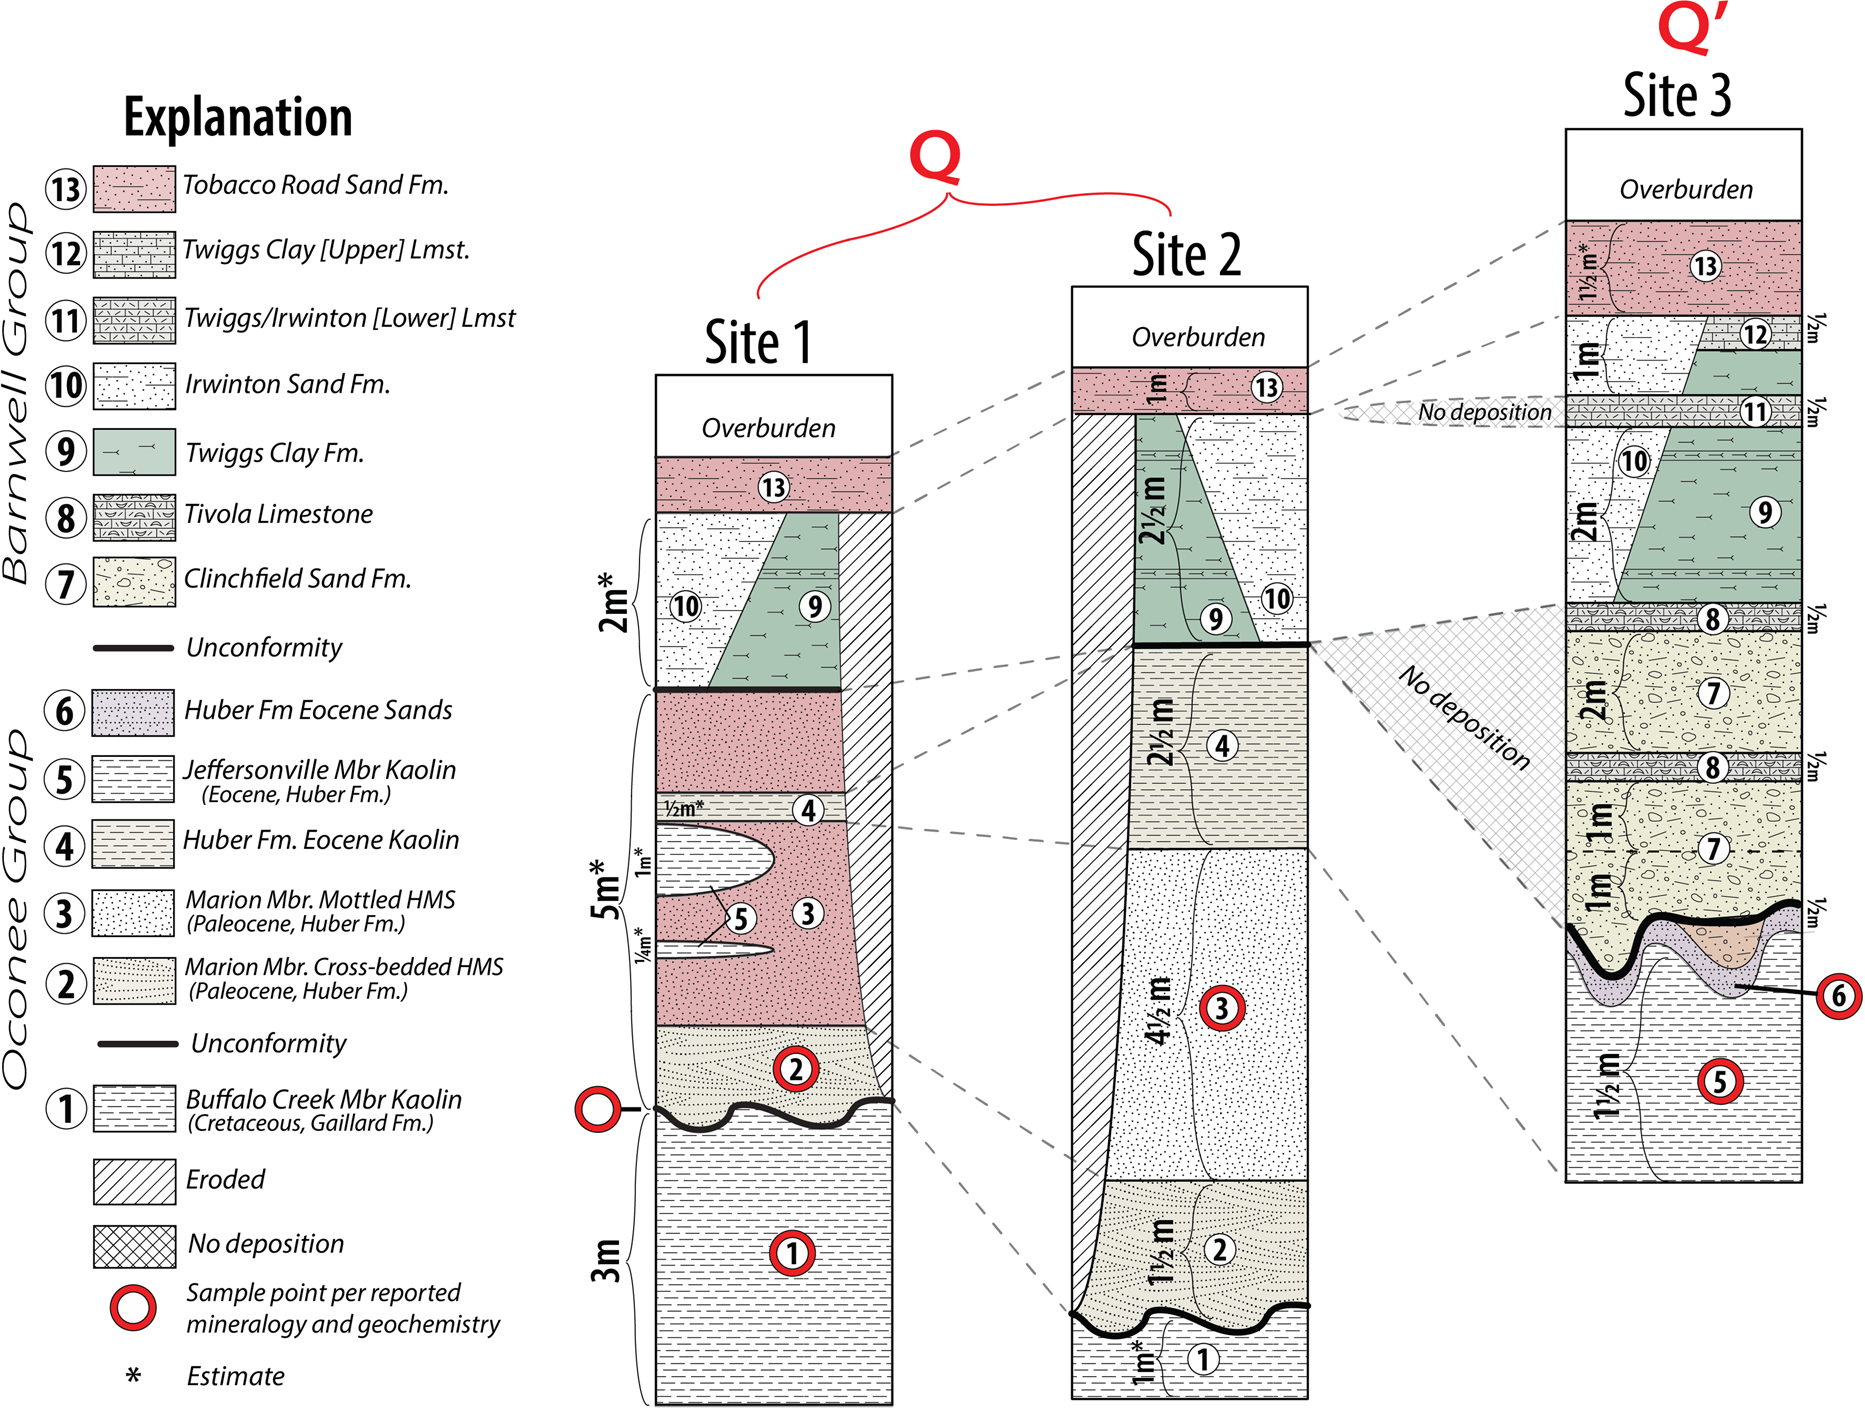
Overlying the Oconee Group in the central Georgia, Upper Coastal Plain are a series of late Eocene coastal-marine formations of the Barnwell Group (Huddlestun & Summerour, Reference Huddlestun and Summerour1996). The Barnwell Group consists of the Tobacco Road Sand Formation, Irwinton Sand Formation, Twiggs Clay Formation, and the Clinchfield Sand Formation (Elzea-Kogel et al., 2002; Falls & Prowell, Reference Falls and Powell2001; Huddlestun, 1981; Huddlestun & Hetrick, 1991; La Moreaux, 1946; Miller, Reference Miller1986). These formations are sand, limestone, and clay-rich lithologies, variably fossiliferous and calcareous. The Oconee Group is separated from the overlying Barnwell Group by a prominent, erosional unconformity marking an abrupt change in lithology between the Huber Formation (uppermost Oconee Group) and the overlying Barnwell strata (Buie, Reference Buie1978; Buie & Fountain, 1967; Buie et al., Reference Buie, Hetrick, Patterson and Neeley1979; Cheshire, 2011; Elzea-Kogel et al., 2002; Nystrom et al., 1991; Patterson & Murray, Reference Patterson and Murray1984). Three regional unconformities are recognized, with the second uniformity (Fig. 2) separating the Cretaceous Gaillard Formation from the overlying Huber Formation (Buie et al., Reference Buie, Hetrick, Patterson and Neeley1979; Elzea-Kogel et al., 2002; Patterson & Murray, Reference Patterson and Murray1984; Pickering & Hurst, 1989). The lowermost unconformity is an undulatory surface separating the crystalline bedrock and the overlying Coastal Plain stratigraphy (Buie et al., Reference Buie, Hetrick, Patterson and Neeley1979).
Stratigraphic column constructed for each field-sampling site including lithology correlation lines between sites and labeled sample points per reported mineralogy and geochemistry. Q represents the up-dip site locations and Qˈ represents the down-dip site location (Fig. 1). The Federal Geographic Data Committee (FDGC) standard for digital cartography and symbolization was referenced for USGS-compliant lithologic patterns of rock units presented in the stratigraphic columns

Methods
Field Samples
The mineralogy and chemical compositions were determined for three different types of geologic materials related to the mining of the Georgia kaolins. These materials include mined kaolin, mine tailings, and the sand units stratigraphically adjacent to the mined kaolins. The mined kaolins and sands were collected from the Sandersville mining district (Patterson & Murray, Reference Patterson and Murray1984), Washington County, Georgia. The mined kaolin from the Buffalo Creek Member (Cretaceous Gaillard Formation) was collected in northwest Washington County, Georgia, and the mined kaolin from the Jeffersonville Member (Eocene Huber Formation) was collected from down-dip lithologies of southwest Washington County, Georgia (Figs. 1 and 2).
Impound sands (IP) and stacked sands (SS) are undifferentiated, discarded sandy materials (mine tailings or ‘grit’). The SS and IP tailings were composed predominantly of sand-size fractions (> 75 µm) that were separated at the early stages of the kaolin mining process and stored near the processing plants (stacked sands) or discarded in inactive quarries (impound sands). These mine-tailings sands are composed typically of non-phyllosilicate minerals (quartz, pyrite, Ti-minerals, and zircon) with only minor amounts of kaolinite and muscovite/biotite. Mine tailings samples were collected from the mining of the Cretaceous kaolin and the Eocene kaolin. The heavy-mineral component was separated from the mine tailings using laboratory mineral separation techniques such as timed settling and density sorting (e.g. hand panning). These techniques were used to concentrate heavy minerals from the clay- and quartz-rich sandy materials in order to identify and characterize the heavy minerals.
Sand units adjacent to the mined kaolins were also collected for study. These sand units occurred as interburden or overburden to the mined kaolin. The heavy mineral-bearing Marion Member sands (Paleocene Huber Formation, Oconee Group) was present as an interburden, directly overlying the Cretaceous kaolin and underlying the Eocene kaolin beds. At one studied mine outcropping of the Marion Member sands, the sand unit was moderately well sorted and contained cross-bedding at the base 1.5 m of the formation. The cross-bedding contained laminae (< 1 cm) of dark/heavy minerals. Coarse mica flakes (0.5–1 cm) and large kidney-shaped kaolin rip-up clasts (30 cm × 10 cm) were also present at the base of the Marion Member of the Huber Formation. The heavy-mineral content resembled a mottled appearance with dark mineral patches and vertical streaks upwards through the section from the base of the Marion Member sands to the next 4.5 m. The patches and vertical streaks resembled the appearance of the effects of bioturbation. The coarse-mica flakes (muscovite) were less common in this upper section. The kidney-shaped kaolin rip-up clasts were smaller in size (2–3 cm) compared to the base section. These features occurred within sequences of fine- and coarse-sand bedsets (~30 cm thick) with convoluted laminations of the heavy minerals. A pyrite-rich sand horizon was observed at the contact between the overlying Marion Member sands and the underlying mined Cretaceous kaolin (Buffalo Creek Member). This pyrite-rich sand marked an unconformity between the upper Cretaceous and the lower Paleocene sediments (Buie, Reference Buie1978; Buie et al., Reference Buie, Hetrick, Patterson and Neeley1979; Elzea-Kogel et al., 2002; Patterson & Murray, Reference Patterson and Murray1984).
Another sand unit was collected in association with the younger Eocene mined kaolin. This sand unit was conformably overlying the mined Eocene kaolin (Jeffersonville Member, Huber Formation) and unconformably underlying the Eocene Clinchfield Sand Formation (Barnwell Group) above. This transition between the uppermost Huber Formation sand and the Clinchfield Sand Formation was a prominent erosional unconformity (Buie & Fountain, 1967; Buie et al., Reference Buie1978, Reference Buie, Hetrick, Patterson and Neeley1979; Cheshire, 2011; Elzea-Kogel et al., 2002). This upper Huber Formation (Eocene age) sand unit was overburden during mining for the underlying Eocene kaolins. The unit was purple-hued, compacted, well sorted, and contained thin (<1 cm) laminations of quartz sand with continuous-parallel bedding planes.
Sample Preparation
Samples of the unconsolidated mine tailings and sands were split into several fractions using a riffle splitter. Milling reduced the sample by >90% to a particle-size of <63 µm. The particle sizes of the milled samples were measured by a Microtrac S3500 (Microtrac, York, Pennsylvania, USA) laser diffraction particle-size analyzer. The split and milled samples were used for whole-powder testing including mineral-phase identification via X-ray powder diffraction (XRD), chemical analyses using X-ray fluorescence (XRF), and inductively coupled plasma mass spectrometry (ICP-MS). The unmilled samples were used for stereomicroscopy, scanning electron microscopy (SEM) analysis, and retained for the two separation techniques described below.
Two separation techniques were developed for the study of the mine tailings: (1) timed settling and decantation of suspended particles; (2) dispersing and wet screening starting material. The second technique was deemed more successful in separating the clay/silt from the sand fractions. The mine-tailings samples (200 g starting weight) were dispersed in a 0.2 wt.% solution of sodium hexametaphosphate (Na-HMP; CAS-No: 68915–31-1, Sigma-Aldrich, St. Louis, Missouri, USA) prepared as 1.5 L of Na-HMP in deionized water (DI). After vigorous agitation of the sample with Na-HMP solution for 1 min, the suspension was decanted and poured through an ASTM 325 mesh screen (45 µm size openings) with an additional 4.5 L of rinsing with DI water. Materials which passed through the screen (“–325 mesh”, the fine-particle size fraction <45 µm) and materials which were retained on the screen (“ + 325 mesh”, the coarse-particle size fraction > 45 µm) were dried and weighed for mineralogic and microscopy study (Supplementary Information, Figs. S1, S2, Table S1). Mineral separations and fractions in contact with phosphorus-based dispersant in DI water were used only for mineralogic (X-ray diffraction) and microscopy analyses. Reported whole-rock geochemistry involved whole-rock materials not treated with dispersant solutions or any other additives.
The geologic samples were processed separately from the mine tailings. The mined kaolins were soaked in a 0.2 wt.% Na-HMP solution for 7 days. The soaked clay and solution were mixed by a Waring blender (Fig. S2A; Waring Products Division, Dynamics Corporation of America, New Hartford, Connecticut, USA). The Waring blender was operated in three cycles composed of 5 s of operation followed by 3 s of settling. The blended solution was transferred to a larger beaker using DI water. The mined Cretaceous kaolin required four cycles of dispersal using the Waring Blender. The disaggregated material was passed through the 325 mesh screen (Fig. S2B, C). The –325 mesh fractions were separated into heavy and light subfractions by using timed settling followed by hand panning (Fig. S2D, E). Whole-rock sand samples required only hand panning with water to concentrate dark/heavy minerals for mineralogic and microscopy study.
Thermogravimetric Analyses
Thermogravimetric Analysis (TGA) was performed using a Perkin Elmer TGA8000 instrument (Perkin Elmer, Waltham, Massachusetts, USA). TGA was used to track weight-loss changes in the mined kaolins. TGA scans were conducted at 50°C/min over a temperature range of 50–1000°C. TGA data were used to confirm the presence of kaolinite and the absence of halloysite (Wilson et al., 2013). Diagnostic weight loss of kaolinite over the temperature range of ~450–650°C were needed to calculate the whole-rock kaolinite wt.% and used in subsequent calculations of mineral abundance. Kaolinite losses typically were a total of ~14 wt.% when heated to completion of this temperature range (Figs. S3, S4).
X-ray Diffraction
Random mounts of powders were scanned using a Panalytical X’Pert Pro diffractometer with CuKα radiation (1.5406 Å; Malvern Panalytical Ltd, Malvern, United Kingdom). Samples were prepared for XRD using an agate mortar and pestle with acetone to wet-grind specimens to a fine powder. Sample preparations were randomly oriented mounts via solvent (acetone) slurry drop-mounts onto zero-background Si-wafers or back-loaded powders into cassettes. Minerals were identified using the International Center for Diffraction Data (ICDD) PDF-4 + 2021 reference database. The MDI-JADE software (version 8.3) was used to process the raw data from the diffractometer and overlay ICDD database references for mineral phase identification. Accepted mineral abbreviations were used to annotate X-ray diffraction patterns (Whitney & Evans, Reference Whitney and Evans2010).
X-ray Fluorescence
Major and minor elemental abundances were measured for the mined kaolin, mine tailings, and sands using X-ray fluorescence (XRF). Sample powders were fused in a 1:10 sample to flux ratio (50:50 lithium metaborate to lithium tetraborate and 0.5 wt.% lithium iodide; Premier Lab Supply, Port St. Lucie, Florida, USA). Sample powders were fused in Pt-Au crucibles in an XRFuse2 two-position fusion oven (manufactured by Premier Lab Supply). The fused samples were cooled to pellets in Pt molds forming a fused pellet. The fused pellets were analyzed using a ThermoARL Advant’XP sequential XRF (Thermo Scientific, Waltham, Massachusetts, USA). A full set of calibrations monitored by drift corrections, check standards, and measurement of certified reference materials were utilized. Sulfide- and carbonate-bearing samples required 800°C oxidation and decomposition, respectively, prior to fusion. Materials were fused at 1050°C. Loss-on-ignition (LOI) was measured separately on samples in a muffle furnace set to 1050°C for 2 h.
Elemental Analyses
Major/minor, trace, and rare-earth elements (REE) were measured for samples and interlaboratory reference standards, prepared by whole-rock total digestions (lithium borate fusion), and analyzed by ICP-MS at Activation Laboratories Ltd. (ActLabs, Ancaster, Ontario, Canada). The measured concentrations for the major/minor, trace, and REE results were normalized to the upper continental crust (UCC, Rudnick & Gao, 2003). This normalization of the geochemical data showed gains and losses of elements resulting from the weathering (and other surficial processes) acting on crustal bedrock. UCC-normalized values of REE for La and Yb showed LREE-enrichment with La/Yb values > 1.0, and HREE-enrichment with La/Yb values < 1.0.
Eu anomalies were identified based on relative concentrations with respect to the neighboring REE, each normalized to UCC. Eu anomalies can be determined by Eq. 1 (below). Values of Eu/Eu* > 1.0 are positive anomalies, and values < 1.0 are negative anomalies (Verplanck et al., 2014).

Equation 1 – Eu/Eu* anomaly calculation (Bern et al., Reference Bern, Shah, Benzel and Lowers2016; Ghosal et al., 2020; McLennan & Taylor, Reference McLennan and Ross Taylor2012; Verplanck et al., 2014; Yusoff et al., Reference Yusoff, Ngwenya and Parsons2013).
Mineral Abundance Estimates
The ICP-MS and XRF results were used to estimate mineral abundances in samples via a rational basis for compositional stoichiometry calculations (Pruett, Reference Pruett2016). These data can be used to confirm the presence of mineral phases. For example, the concentration of zircon was determined from the analyses of whole-rock Zr contents. Confirmation of zircon as the only Zr-containing mineral phase present, per whole-rock, was assisted by the XRD results and electron microscopy EDS results. The abundance of zircon was calculated by: [wt.% Zr measured per whole-rock analysis]
 [wt.% Zr content of zircon] * 100 = total wt.% zircon mineral abundance per whole-rock.
Mineral abundances of monazite and xenotime as ratios were estimated by elemental abundance determinations via scanning electron microscopy (SEM) with energy-dispersive spectroscopy (EDS) analyses. SEM–EDS analysis was performed on populations of individual monazite and xenotime mineral grains to determine their respective elemental contents.
The monazite and xenotime ratios (mnz/xtn) were determined by the following steps:
Step 1. Distribute the whole-rock geochemistry result for elemental P wt.% between monazite and xenotime. Start the process with a 50–50 distribution.
Step 2. Calculate the wt.% monazite and wt.% xenotime by dividing the distributed P content by the elemental wt.% abundance of P, multiplied by 100, for each phase (monazite and xenotime), respectively.
Step 3. Multiply the calculated wt.% monazite result and wt.% xenotime result by the elemental wt.% abundance of each REE – e.g. LREE and Y for Monazite, HREE and Y for xenotime – divided by 100.
Step 4. Check Step 3 which results in a modeled wt.% of each REE attributed to monazite and xenotime mineral content, based on the elemental P distribution in Step 1.
Step 5. The modeled result from Step 3 for monazite + xenotime content per REE is compared to the actual whole-rock wt.% REE determined from the ICP-MS geochemistry analyses.
Step 6. Dividing the modeled REE totals from the actual REE totals, multiplied by 100, yields a ‘% of total value’. This value shows the closeness of the modeled REE total to the actual REE total.
Step 7. Steps 1 through 6 are repeated until the ‘% of total value’ is evenly distributed across all REE modeled.
Step 8. Even distributions with ‘% of total values’ > 100% are scaling factors corrected by decreasing the starting P content until the ‘% of total value’ is ~ 100%. Scaling factors are explained below:
• XRD analysis is complementary to this process by confirming the presence of other P-containing minerals, such as apatite, which may not contribute to the total REE content of the sample
• Presence of non/low-REE phosphates, such as apatite, produce ‘% of total values’ > 100% when their P content is allocated to mnz/xtn by this method
• The P content attributed to the non-monazite/xenotime sources should be subtracted from the total P content before proceeding through the method
Step 9. Once a modeled REE fit to actual REE is achieved, the wt.% monazite and wt.% xenotime values are ratioed.
Scanning Electron Microscopy
Scanning electron microscopy (SEM) with energy dispersive spectroscopy (EDS) was used to identify morphological properties and semi-quantitively determine the major and minor constituents of individual, discrete mineral grains of interest. The scanning electron microscope used was a Hitachi model S-4300SE/N SEM (Hitachi, Ltd, Tokyo, Japan) equipped with secondary electron (SE) and back-scatter electron (BSE) detectors. The SEM was also equipped with an EDS system: EDAX model Octane Elite, 70 mm2 Silicon Drift Detector (SDD), with APEX software for data processing, elemental identification, and quantification using eZAF corrections (EDAX, Warrendale, Pennsylvania, USA).
The accelerating voltage applied ranged from 8 to 30 kV. Beam current was varied between 53 and 72 µA. SE was used primarily to capture high-resolution images of particle morphologies. BSE was used primarily to discriminate and isolate particles of interest based on atomic-weight differences. EDS chemical mapping was utilized to show the distribution of chemical components within a field of view in order to identify possible mineral phases of interest. Sample preparation involved dust-mounting mineral powders onto 12 mm aluminum stubs with conductive carbon-adhesive substrates. The stubs prepared were lightly carbon coated (5–50 nm) by carbon-rod evaporation to improve conduction with the incident electron beam and lessening charging from the mineral surfaces.
Results
Mineralogy
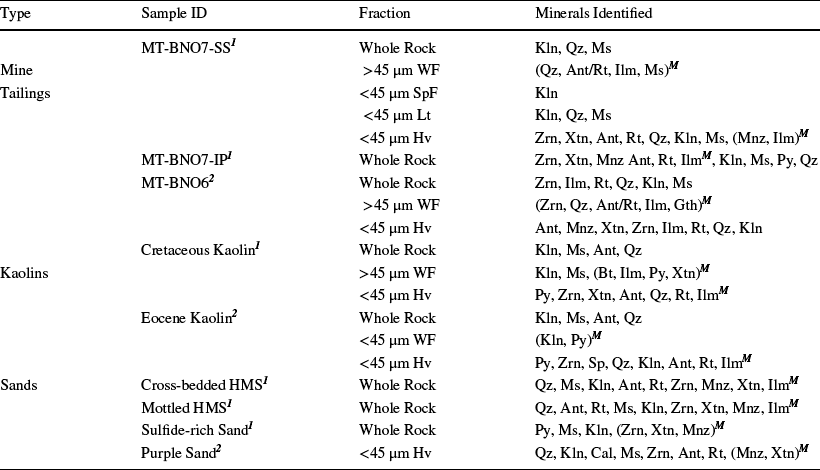
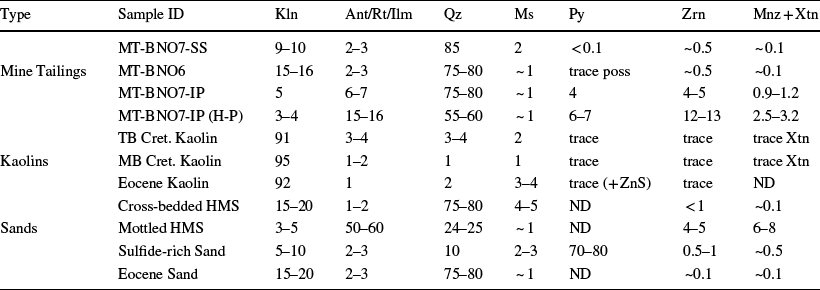
The mineral identifications and quantifications were described for the mined kaolins, mine tailings, and sands on a whole-rock basis (Tables 1 and 2; Figs. 3, 5, and 6). The mined kaolins were composed predominantly of kaolinite with smaller amounts of muscovite, quartz, and anatase. The mine tailings overall were composed mostly of quartz with minor amounts of kaolinite, and accessory phases (anatase, rutile, ilmenite, zircon, monazite, and xenotime). The sands were composed mostly of quartz with smaller amounts of kaolinite, muscovite, anatase, rutile, ilmenite, zircon, monazite, and xenotime.
Minerals identified by XRD and SEM per sample type and fraction

Abbreviations: WF: whole fraction; Hv: heavy subfraction; Lt: light subfraction; MT: mine tailings; HMS: heavy mineral sands; SpF: suspended fraction; M: microscopy-only; 1: associated with Cretaceous Buffalo Creek Mbr mined kaolin; 2: associated with Eocene Jeffersonville Mbr mined kaolin; mineral abbreviations (Whitney and Evans, Reference Whitney and Evans2010): kaolin (Kln), quartz (Qz), muscovite (Ms), biotite (Bt), anatase (Ant), rutile (Rt), ilmenite (Ilm), zircon (Zrn), xenotime (Xtn), monazite (Mnz), pyrite (Py), sphalerite (Sph), goethite (Gth), and calcite (Cal)
Whole-rock mineral abundance estimates

Abbreviations: MT: mine tailings; BNO7-SS/IP/IP(H-P): Cretaceous kaolin mine tailings; BNO6: Eocene kaolin mine tailings; HMS: heavy mineral sands; TB: top of bed sample; MB: middle of bed sample; ND: not detected; results in wt%; mineral abbreviations (Whitney & Evans, Reference Whitney and Evans2010): kaolin (Kln), anatase (Ant), rutile (Rt), ilmenite (Ilm), quartz (Qz), muscovite (Ms), pyrite (Py), zircon (Zrn), monazite (Mnz), xenotime (Xtn)
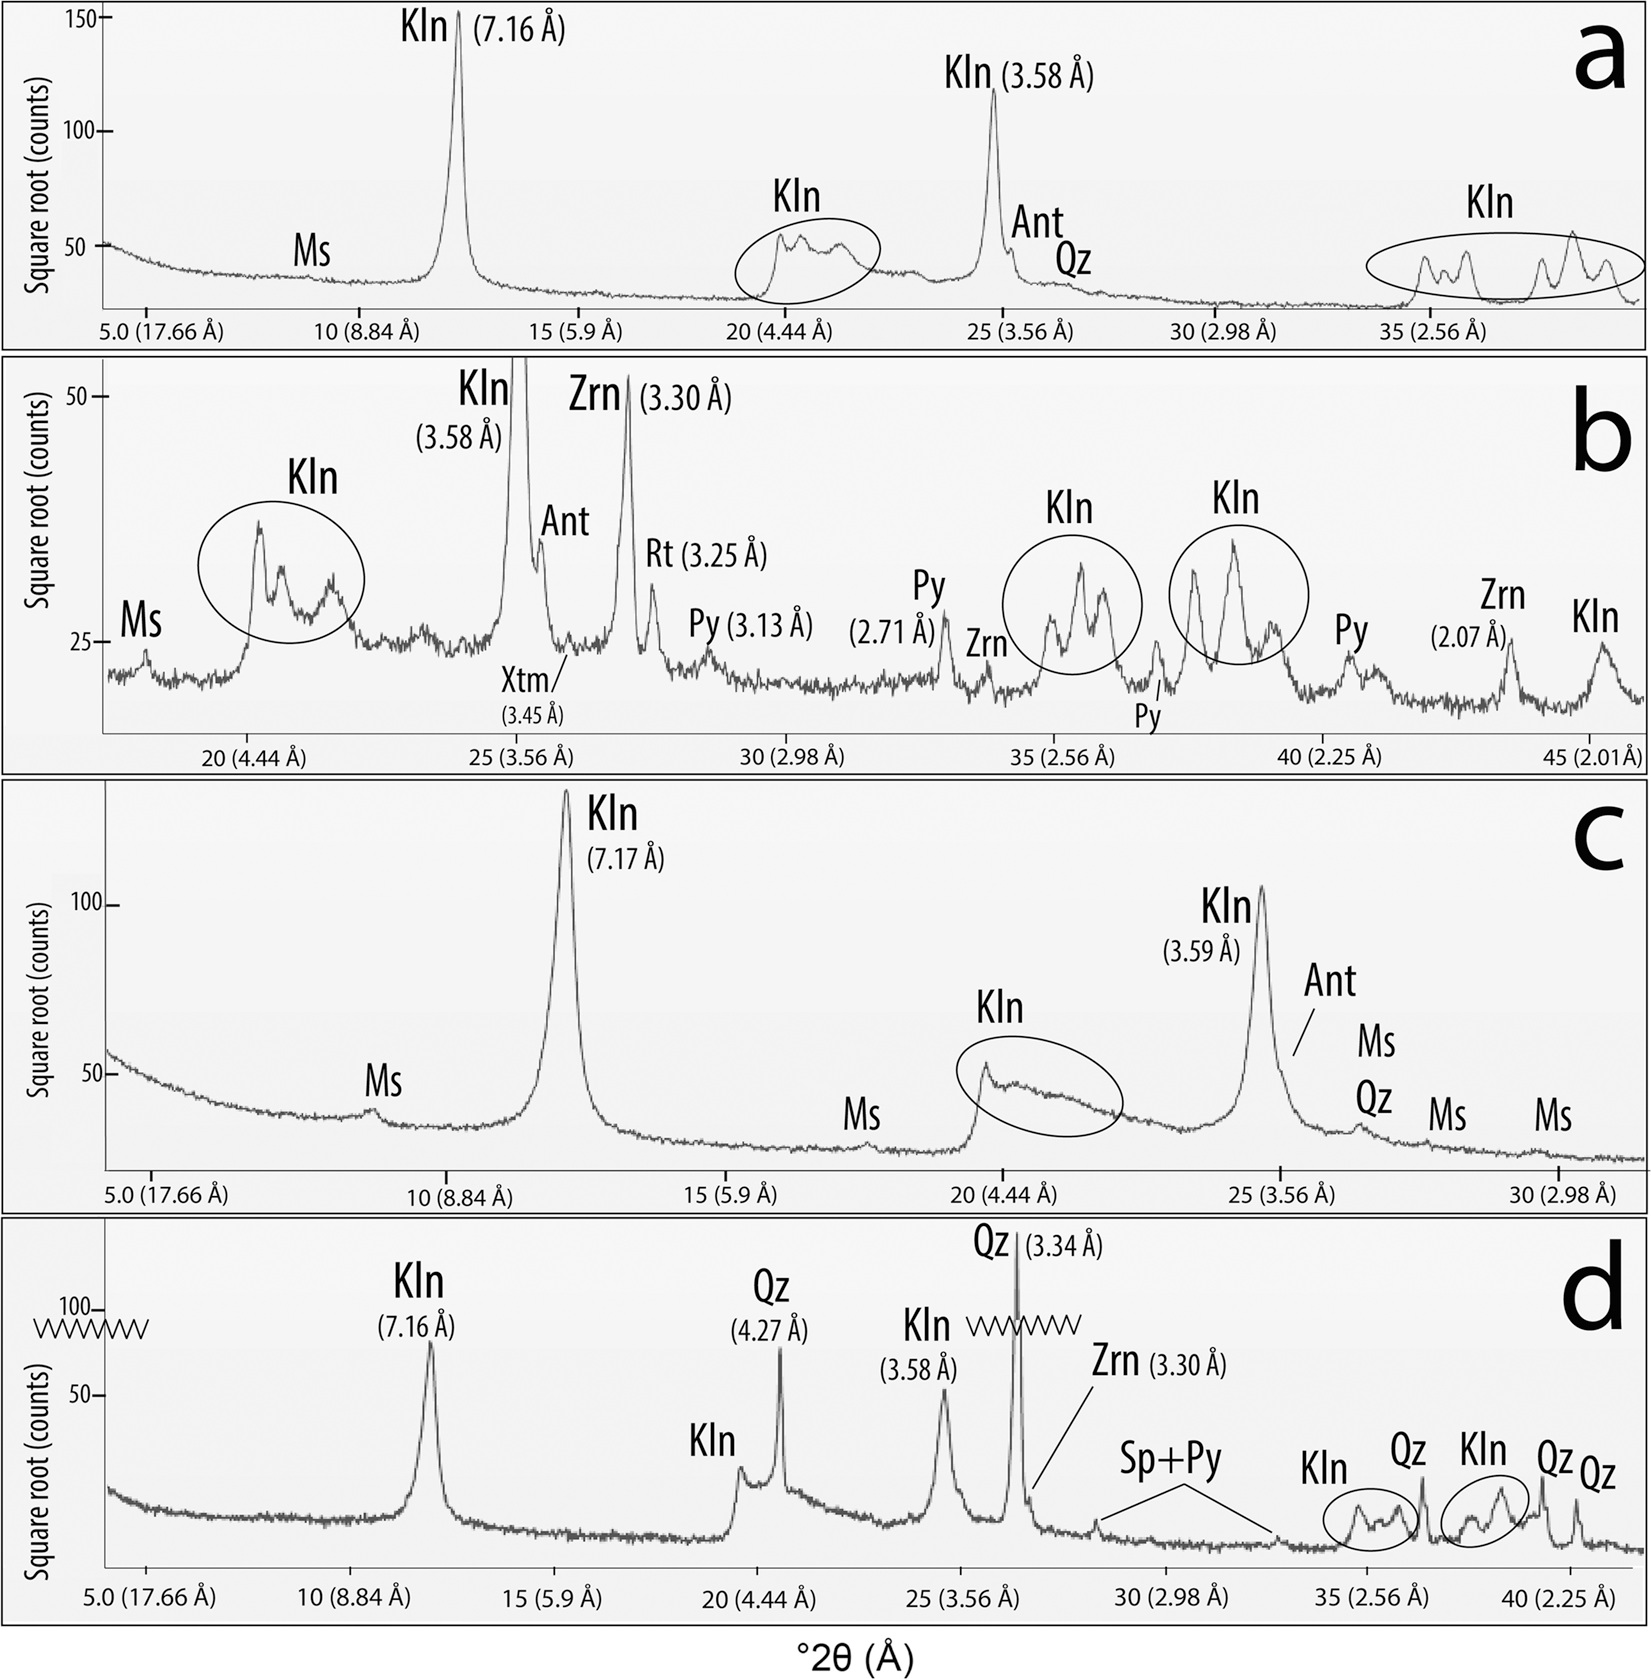
Kaolin – XRD traces with mineral-phase identifications for the mined kaolins: a whole-rock analysis results for the Cretaceous kaolin; b heavy subfraction (–325 mesh, <45 µm) analysis results for the Cretaceous kaolin; c whole-rock analysis results for Eocene kaolin; d heavy subfraction (–325 mesh, <45 µm) analysis results for the Eocene kaolin. Mineral abbreviations (Whitney & Evans, Reference Whitney and Evans2010): kaolin (Kln), quartz (Qz), muscovite (Ms), anatase (Ant), rutile (Rt), zircon (Zrn), xenotime (Xtn), pyrite (Py), and sphalerite (Sph)

Mined Kaolins
Kaolinite was the primary mineral observed in both mined Eocene and Cretaceous kaolins per XRD. Halloysite was not detected via XRD or TGA analyses (Figs. S3 and S4). Muscovite, anatase, and quartz were also observed in trace amounts for both whole-rock Cretaceous and Eocene kaolins (Table 2; Fig. 3a, c). Whole-rock fractions, as well as fine and coarse fractions of the mined kaolins, were analyzed (Table 1). Coarse mica flakes (muscovite and biotite), ilmenite, pyrite, and xenotime were identified in the +325 mesh (>45 µm) fraction for the Cretaceous kaolin by stereomicroscopy (Fig. S5) and SEM–EDS analysis. Agglomerated kaolin fragments and pyrite were identified in the +325 mesh (>45 µm) fraction of the Eocene kaolin per stereomicroscopy (Fig. S6).
Pyrite, zircon, anatase, quartz, rutile, and ilmenite were found in the heavy-mineral subfractions of the fine fractions (–325 mesh, <45 µm) of both Cretaceous and Eocene mined kaolins (Fig. 3b, d; Figs. S7, S8, S9 and S10). Sphalerite was found in the heavy fraction of the Eocene kaolin by XRD and SEM–EDS analysis (Fig. 3d; Fig. S10). The agglomerated kaolin fragments with pyrite identified for the Eocene kaolin coarse fraction were also observed via SEM (Fig. S11). Zircon grains were typically sub-rounded, amber-colored, and translucent when viewed via stereomicroscopy (Figs. S5 and S6). During SEM–EDS analysis, zircon was observed as rounded grains with minor to faintly preserved crystal faces (Figs. S7, S8, S10). The zircon grains were more well rounded in the Eocene kaolin (Fig. S10B). Xenotime grains (n = 12) were found in the heavy fraction of the Cretaceous kaolin (Fig. S9) whereas they were not present in the Eocene kaolin. These xenotime grains in the Cretaceous kaolin showed smooth mineral surfaces and evident crystal faces (Fig. S9). No dissolution etching or pitting features were observed on these xenotime grains. Several examples of these xenotime grains were observed as overgrowths to zircon (Fig. 4). Monazite was not detected during any analysis of either kaolin type.
SEM photomicrographs and EDS spectra for stages of growth and liberation of xenotime (Xtn) overgrowths on zircon (Zrn) present in the Cretaceous kaolin

Quartz grains showed rounding with observable conchoidal-fracture surfaces in both kaolins. Ilmenite, anatase, and rutile grains were typically sub-angular, fractured, and displayed minor rounding. Some anatase/rutile grains showed minor preservation of crystal faces, while ilmenite showed less evident crystal faces from fractured or rounded surfaces. Ilmenite also showed etching and pitting of grain surfaces (Figs. S8F and S15), not shown in anatase/rutile. The etching and pitting of grain surfaces were only identified in the Cretaceous kaolin and mine tailings derived from the mined Cretaceous kaolin. Pyrite grains were sub-rounded to angular with intact crystal faces. Pyrite grains were found also as clusters, nodular aggregates, or individual pyrite grains (Figs. S7 and S8). A framboidal morphology of the pyrite was observed only in the Eocene kaolin (Fig. S10). Feldspars were not observed in the mined kaolins.
Mine Tailings
Two types of mine tailings (MT) of the Cretaceous kaolin-derived mine tailings (MT-BNO7) were collected: ‘impound sands’ (IP) and ‘stacked sands’ (SS). Whole-rock fractions, fine and coarse fractions, light and heavy subfractions, and the suspended fraction of the stacked sand mine tailings (MT-BNO7-SS) were analyzed (Table 1; Fig. 5a–c). Kaolinite, quartz, and mica were the main constituents identified per XRD from the whole-rock fraction of MT-BNO7-SS (Fig. 5b). The coarse fraction (>45 µm, + 325 mesh) of MT-BNO7-SS contained predominantly quartz and muscovite. The heavy subfraction of the fine fraction (<45 µm, –325 mesh) for MT-BNO7-SS contained zircon, xenotime, monazite, anatase, rutile, kaolinite, muscovite, and ilmenite (Fig. 5a). The zircon grains present in the heavy subfraction were typically well rounded with trace preserved crystal faces (Fig. S13). Monazite and xenotime were also identified in the heavy subfraction as angular, fragmented per SEM–EDS (Fig. S12) – undetectable concentrations via XRD. The light subfraction, suspended fraction, and 7-day settled fraction produced from the fine fraction (<45 µm) contained predominantly quartz and muscovite per XRD (Fig. 5a–c). Across all fractions, quartz was either rounded or possessed diagnostic conchoidal fracture along mineral-grain breakage surfaces.
Mine tailings – X-ray diffraction tracings with mineral phase identifications; a light and heavy subfraction (–325 mesh, < 45 µm) analysis results for MT-BNO7-SS; b whole-fraction analysis (dark trace) versus –325 mesh suspended fraction (SpF, light trace) for MT-BNO7-SS showing predominance of quartz to the >45 µm fraction and predominance of kaolin to the <45 µm size fraction; c analysis results for the –325 mesh, 7-day settled fraction showing the efficacy of 24-h timed settling to concentrate the heavy minerals; d whole-fraction analysis results for MT-BNO7-IP versus MT-BNO7-IP(H-P); e heavy subfraction (–325 mesh, <45 µm) analysis results for MT-BNO6. Mineral abbreviations (Whitney & Evans, Reference Whitney and Evans2010): kaolin (Kln), quartz (Qz), muscovite (Ms), anatase (Ant), rutile (Rt), zircon (Zrn), xenotime (Xtn), monazite (Mnz), and pyrite (Py)

The mine tailings sample MT-BNO7-IP derived from mined Cretaceous kaolin contained zircon, xenotime, monazite, anatase, rutile, ilmenite, kaolinite, muscovite, quartz, and pyrite in the whole-rock fraction via XRD and SEM–EDS analyses (Table 1; Fig. 5d, Figs. S14, S15 and S16). A hand-panned (H-P) subsample of MT-BNO7-IP contained greater concentrations of the heavy minerals zircon, pyrite, anatase, rutile, monazite, and xenotime (Table 2). No other fractions were produced from MT-BNO7-IP due to the heavy minerals readily identified from whole-rock and hand-panned sub-samples without an additional processing being required. Similar to MT-BNO7-SS, quartz was either rounded or showed conchoidal fracture. Iron sulfide occurred as nodules and grains with a degree-of-roundedness ranging from well rounded to angular (i.e. intact crystal faces). Crystal habits for the iron-sulfide minerals ranged from indistinguishable (for rounded grains) to highly distinguishable (for angular grains). Monazite and ilmenite grains displayed rounding, evidence of mature minerals. Monazite and ilmenite grains also displayed possible dissolution pitting and etching patterns along mineral grain surfaces (Figs. S15 and S16). More than 100 monazite grains were identified during SEM–EDS analysis. Xenotime was not observed in the SEM–EDS analyses, but it was observed during XRD analysis.
The mine-tailings sample MT-BNO6 was derived from the Eocene mined kaolin. MT-BNO6 was composed predominantly of quartz, rutile, anatase, and kaolinite as the predominant phases (Table 2). Muscovite, zircon, monazite, and xenotime were observed as trace phases in whole-rock fractions. Whole-rock, fine and coarse fractions were analyzed. Zircon, quartz, anatase/rutile, ilmenite, kaolin, and goethite were identified by stereomicroscopy and SEM–EDS analysis of the +325 mesh coarse fraction (> 45 µm). In this coarse fraction, the kaolin was observed as hard fragments (i.e. unground ore) with botryoidal goethite as orange-yellow fragments within the coarse-quartz matrix (Fig. S17). Zircon, anatase, rutile, kaolinite, muscovite, quartz, monazite, and xenotime were detected by XRD for the heavy subfraction (Fig. 5e). Monazite grains were confirmed by SEM–EDS analyses (Fig. S18), but xenotime was detected only via XRD and not confirmed through SEM–EDS analyses. The SEM–EDS analyses showed abundant zircons occurring as sub-rounded grains with minor to faintly preserved crystal faces. Ilmenite typically occurred as sub-angular, fragmented grains. Monazite grains (n = 21) were identified by SEM–EDS analysis. The monazite grains occurred as sub-rounded grains. Most monazite grains displayed smooth grain surfaces with no identifiable etching or pitting features of the mineral-grain surfaces.
Sands
Quartz was the most abundant mineral identified for the cross-bedded section of the Marion Member sands (Huber Formation). This cross-bedded sand unit was composed of quartz and kaolinite as predominant minerals, with minor amounts of muscovite, monazite, rutile, and trace possible xenotime confirmed via XRD (Tables 1, 2; Fig. 6a, Figs. S19–S22). The mottled sands (upper section) of the Marion Member were composed of quartz and the Ti minerals (anatase, rutile, ilmenite) as the predominant minerals with minor amounts of zircon, monazite, and xenotime observed in the mottled sands – greater concentrations compared to the lower/basal cross-bedded section of the sand unit, per whole-rock basis (Tables 1 and 2; Fig. 6b, Figs. S23–S26). The dark, heavy minerals (e.g. Ti minerals, zircon, monazite/xenotime) were generally 0.25–0.75 mm in size and present along thin laminations of the cross-beds with quartz-sand grains (>1 mm) as the dominant component. More than 100 monazite grains were identified in the mottled section of the Marion Member sands via SEM–EDS analysis. Monazite was significantly more abundant than xenotime. Both monazite and xenotime grains were angular in character.
Sand lithologies – XRD traces with mineral-phase identifications; a whole-rock analysis results for the cross-bedded HMS showing quartz (major) with minor amounts of mica and kaolin, minor to trace Ti-bearing phases (anatase/rutile/ilmenite), and trace xenotime and monazite; b whole-rock analysis results for the mottled HMS showing that appreciable monazite and xenotime was detected; c whole-rock analysis for the sulfide-rich HMS showing major composition of Fe sulfides (pyrite, marcasite) with quartz, mica, and kaolin; d heavy subfraction (–325 mesh, <45 µm) analysis results for the Eocene sand lithology showing trace heavy-mineral content. Mineral abbreviations (Whitney & Evans, Reference Whitney and Evans2010): kaolin (Kln), quartz (Qz), muscovite (Ms), anatase (Ant), rutile (Rt), zircon (Zrn), xenotime (Xtn), monazite (Mnz), pyrite (Py), and calcite (Cal)

The sulfide-rich sand at the base of the Marion Member contacting with the underlying mined Cretaceous kaolin of the Buffalo Creek Member (Gaillard Formation) was composed predominantly of pyrite/marcasite with minor amounts of quartz, muscovite, and kaolinite (Fig. 6c). Monazite and xenotime displayed heavily etched and pitted mineral grains surfaces (Fig. 10, Figs. S27 and S28). Zircon grains were rounded with faint to no crystal faces preserved (Fig. S29) and the iron-sulfide mineralization showed granular and/or octahedral crystal clustering habits (Fig. S30).
The purple-hued Eocene sand of the upper Huber Formation showed quartz as the predominant mineral. This sand unit overlies conformably the Eocene mined kaolin. Analyses of the sand unit included whole-rock, the fine fraction, and the coarse fraction including a derived heavy subfraction (Tables 1, 2; Fig. 6d). Minor amounts of kaolinite and trace amounts of calcite, zircon, anatase, rutile, and muscovite were present. The heavy subfraction analyses showed contents of zircon, rutile, anatase, ilmenite, monazite, and xenotime (Fig. 6d, Figs. S31, S32 and S33). Zircon grains were rounded with little preservation of crystal faces evident. Monazite and xenotime were observed only during microscopy analyses (below detection limit during XRD analyses), with monazite grains more abundant.
Chemical Analyses
Major and Minor Elements
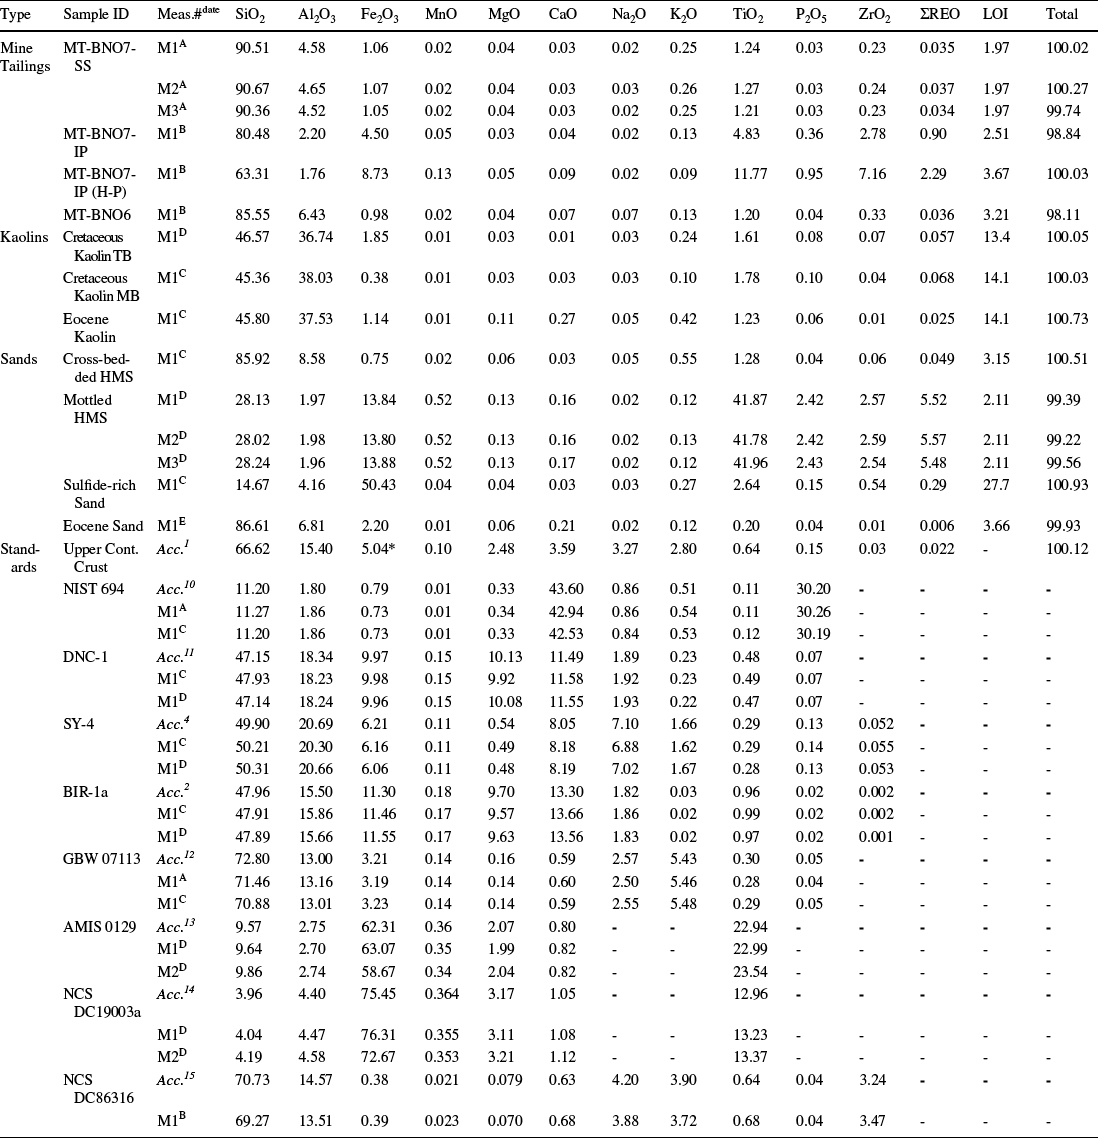
All chemical analyses were conducted on a whole-rock, total digestion basis. The mined kaolins contained SiO2 and Al2O3 as the predominant major-element oxides (Table 3). These analyses are consistent with the presence of kaolinite and quartz as the primary minerals in the mined kaolins. These mined Cretaceous kaolins were enriched in TiO2 and ZrO2 relative to their concentrations in the Upper Continental Crust (UCC; Fig. 7). The alkali and alkaline earth concentrations were <<1 wt.%. The alkali elements were depleted relative to UCC (Table 3). For the mine tailings, silica (SiO2) was the predominant component (63–91 wt.%; Table 3).
Major and minor oxide analyses

Measurement#date: M#A: 04/13/2021; M#B: 08/20/2021; M#C: 10/01/2021; M#D: 11/12/2021; M#E: 01/29/2023; Accepted Value: Acc. 1 : Rudnick & Gao (2003); Acc. 2 : Flanagan & Gottfried (Reference Flanagan and Gottfried1980), Flanagan (Reference Flanagan1984), Govindaraju (Reference Govindaraju1994); Acc. 4 : Bowman (Reference Bowman1995); Acc. 10 : NIST; Acc. 11 : Ragland et al. (Reference Ragland, Rogers and Justus1968), Flanagan (Reference Flanagan1984), Gladney & Roelandts (Reference Gladney and Roelandts1988), Govindaraju (Reference Govindaraju1994); Acc. 12 : China National Analysis Center for Iron & Steel (2010); Acc. 13 : African Mineral Standards (2008); Acc. 14 : China National Analysis Center for Iron & Steel (2006); Acc. 15 : China National Analysis Center for Iron & Steel (2008b); Abbreviations: MT: mine tailings; BNO7-SS/IP/IP(H-P): Cretaceous kaolin mine tailings; BNO6: Eocene kaolin mine tailings; HMS: heavy mineral sands; TB: top of bed sample; MB: middle of bed sample; NA: not analyzed; REO: rare-earth oxide; analysis results in wt.%; *as FeO
Diagrams for select major/minor and non-REE trace-element compositions of the mined kaolins, mine tailings, and sand lithologies; normalized to Upper Continental Crust (UCC) values

The Eocene kaolin mine tailings (MT-BNO6) and Cretaceous kaolin mine tailings (MT-BNO7-IP, MT-BNO7-IP H-P) were enriched in TiO2 relative to UCC (ranging 2–18 times, respectively) and ZrO2 (ranging 11 to 239 times, respectively; Table 3, Fig. 7). P2O5 was slightly enriched in the Cretaceous kaolin mine tailings (MT-BNO7-IP, MT-BNO7-IP H-P) and depleted in the Eocene kaolin mine tailings (MT-BNO6). The TiO2, ZrO2, and P2O5 enrichments in the Cretaceous kaolin mine tailings sample MT-BNO7-SS were similar to TiO2, ZrO2, and P2O5 enrichments in the Eocene mine tailings MT-BNO6 (Fig. 7).
The major element analyses of the Marion Member sands (cross-bedded section) contained large amounts of SiO2 (~86 wt.%; Table 3). These sands were also enriched in ZrO2 and TiO2 relative to their concentrations in the UCC (Fig. 7). These sands were depleted in Al2O3 and P2O5 (Table 3), and several alkali (Rb) and alkaline earth metals (Sr, Ba) relative to the UCC (Table 4). The major element composition of the mottled section of the Marion Member sands showed much smaller concentrations of SiO2 (~28 wt.%) and much larger TiO2 concentrations (~42 wt.%) compared to the cross-bedded lower section of these Marion Member sands (Table 3). The mottled section contained large amounts of Ti minerals, zircon, and phosphate minerals (Table 2). The mottled sands were considerably enriched relative to UCC in TiO2 (65 times), ZrO2 (86 times), with minor enrichments in P2O5 (16 times) and Fe2O3 (~2.5 times; Fig. 7). The mottled sands were depleted significantly in Si and Al (Table 3, Fig. 7). In contrast to the Paleocene mottled sands, the sulfide-rich sands were also enriched in ZrO2 and TiO2 relative to their concentrations in the UCC; the Eocene sands were depleted in ZrO2 and TiO2, however.
Trace element analyses

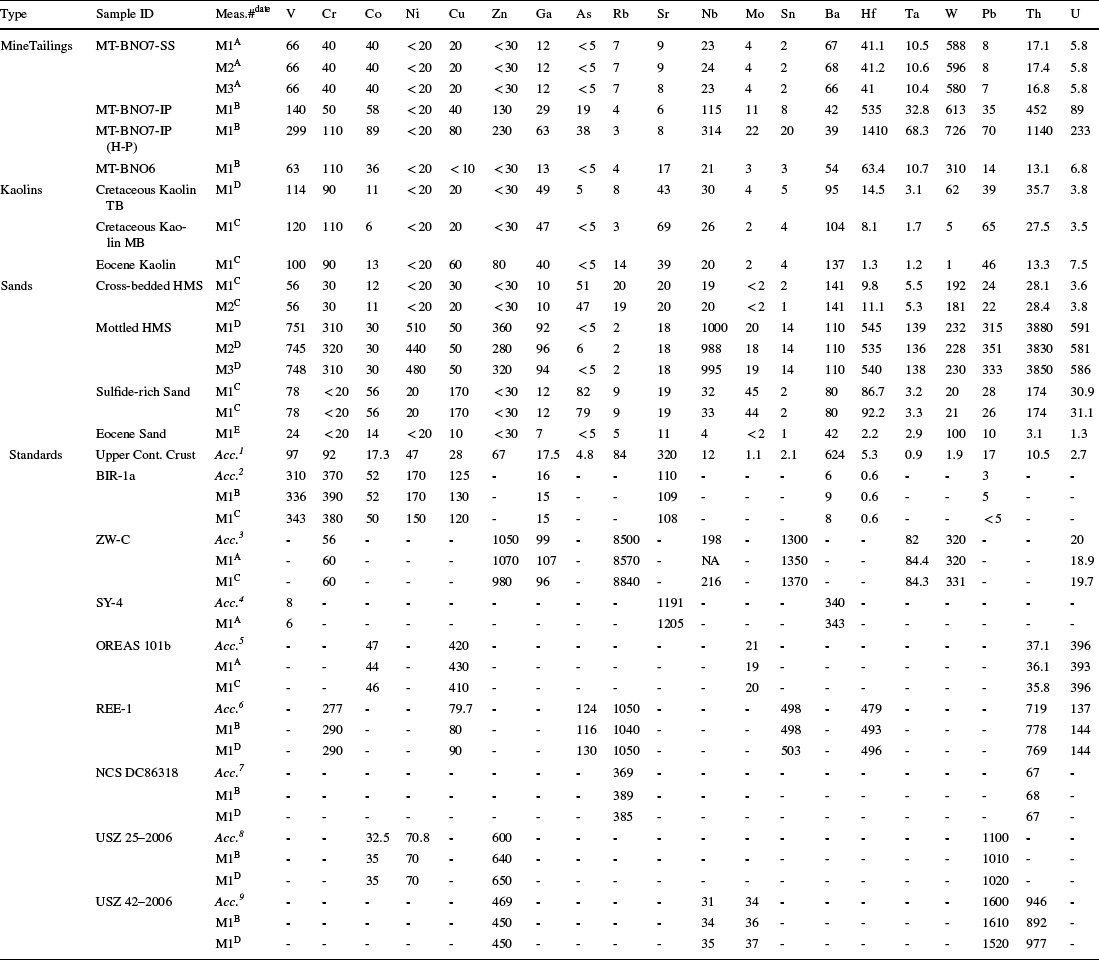
Measurement#date: M#A: 04/13/2021; M#B: 08/20/2021; M#C: 10/01/2021; M#D: 11/12/2021; M#E: 01/29/2023; Accepted Value: Acc. 1 : Rudnick and Gao (2003); Acc. 2 : Flanagan and Gottfried (Reference Flanagan and Gottfried1980); Flanagan (Reference Flanagan1984); Govindaraju (Reference Govindaraju1994); Acc. 3 : Govindaraju et al. (Reference Govindaraju, Rubeska and Paukert1994); Acc. 4 : Bowman (Reference Bowman1995); Acc. 5 : Ore Research & Exploration Pty Ltd. (2016); Acc. 6 : CCRMP (2014); Acc. 7 : China National Analysis Center for Iron and Steel ((2006); Acc. 8 : Central Geological Laboratory Mongolia (2016a); Acc. 9 : Central Geological Laboratory Mongolia (2016b); Abbreviations: MT: mine tailings; BNO7-SS/IP/IP(H-P): Cretaceous kaolin mine tailings; BNO6: Eocene kaolin mine tailings; HMS: heavy mineral sands; TB: top of bed sample; MB: middle of bed sample; NA: not analyzed; analysis results in ppm
Trace Elements
Overall, Nb, Mo, Sn, Hf, Ta, Pb, Th, U, and Ga were enriched (relative to UCC) for tailings, kaolins, and sands except the Eocene-age sands (Table 4, Fig. 7). The Eocene kaolins were also not enriched in Hf. Trace-element abundances reflected several mineralogical abundances among the types of samples in this study. The depletion in Hf for the Eocene kaolins versus the enrichment of Hf seen in the Cretaceous kaolin was attributed to the concentration of zircon in the Cretaceous mined kaolin (Table 3, wt.% ZrO2). Zn was enriched in the Eocene kaolins, relative to UCC, whereas depletion in Zn was shown for Cretaceous kaolins (Table 4, Fig. 7). Identification of Zn-sulfide (sphalerite) was confirmed by XRD mineralogy and SEM–EDS for the Eocene kaolins (Table 1). Zn-sulfide was not identified in the Cretaceous kaolins.
The Marion Member sands (mottled section) and the mine tailings sample MT-BNO7-IP (H-P) showed the greatest enrichments in the high field strength elements (HFSE: Nb, Hf, Ta, Th), U, Mo, Sn, and Pb relative to UCC. The alkali metals (Rb, Sr, Ba) were depleted in the mined kaolins, mine tailings, and sands relative to UCC (Table 4, Fig. 7). Relative to UCC, the concentrations of Hf, Th, and U exceeded 100, 350, and 200 times enrichment, respectively, in the mottled section of the Marion Member sands. Enrichments in Hf, Th, and U exceeded 250, 100, and 75 times UCC, respectively, for MT-BNO7-IP (H-P). These differences reflected the contrast in mineral abundances between the Marion Member sands and kaolin mine tailings (Table 2). SEM–EDS results showed Hf and Zr present only in the zircon minerals and confirms the whole-rock geochemistry concentrations of Zr and Hf to be attributed to total whole-rock zircon mineral content. Likewise for SEM–EDS results and Th and U identified only in monazite, the whole-rock geochemistry concentrations of Th and U were attributed to total whole-rock monazite mineral content.
Rare-Earth Elements
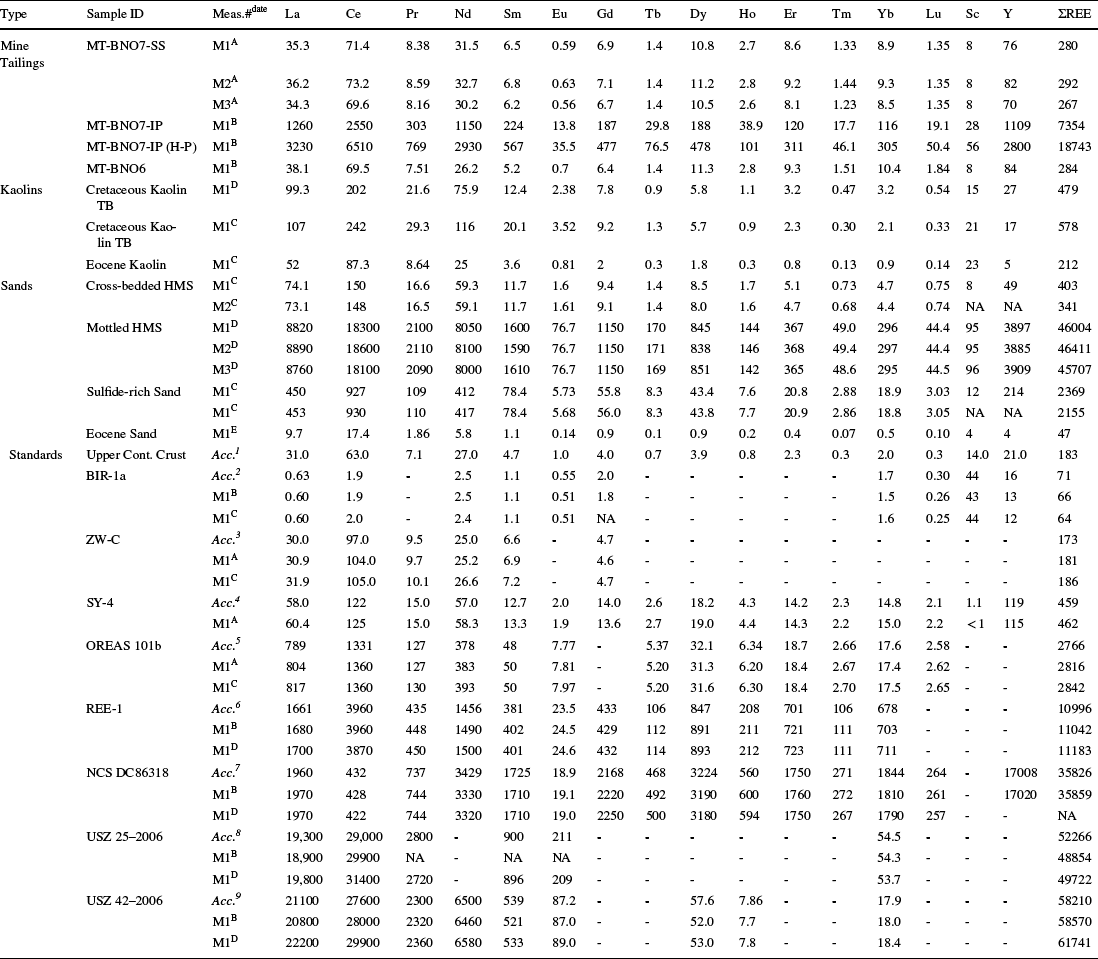
The total REE contents (ΣREE, Table 5) ranged from 212–578 ppm for the kaolins. The Eocene kaolins and sands had the lowest ΣREE (212 and 47 ppm, respectively) among all materials. The ΣREE for the Eocene sands were substantially depleted relative to UCC (< 30%), and the Eocene kaolins were most similar to the ΣREE concentrations in the UCC. These Eocene kaolins were only slightly enriched (~ 1.0–1.5 times) in the LREE La–Nd and were depleted in all other REE including HREE (Fig. 8). The Cretaceous kaolins (top-bed or ‘TB’ subsample, and middle-bed or ‘MB’ subsample – same Cretaceous kaolin outcrop) showed ΣREE ranging from 479–578 ppm. These Cretaceous kaolins were enriched (3.0–4.5 times) in the LREE La–Eu relative to UCC (Table 5, Fig. 8). The Eocene and Cretaceous kaolins showed positive Eu/Eu* anomalies with values ranging 1.05–1.30.
REE analyses

Measurement#date: M#A: 04/13/2021; M#B: 08/20/2021; M#C: 10/01/2021; M#D: 11/12/2021; M#E: 01/29/2023; Accepted Value: Acc. 1 : Rudnick & Gao (2003); Acc. 2 : Flanagan & Gottfried (Reference Flanagan and Gottfried1980); Flanagan (Reference Flanagan1984); Govindaraju (Reference Govindaraju1994); Acc. 3 : Govindaraju et al. (Reference Govindaraju, Rubeska and Paukert1994); Acc. 4 : Bowman (Reference Bowman1995); Acc. 5 : Ore Research & Exploration Pty Ltd. (2016); Acc. 6 : CCRMP (2014); Acc. 7 : China National Analysis Center for Iron & Steel (2008a); Acc. 8 : Central Geological Laboratory Mongolia (2016a); Acc. 9 : Central Geological Laboratory Mongolia (2016b); Abbreviations: MT: mine tailings; BNO7-SS/IP/IP(H-P): Cretaceous kaolin mine tailings; BNO6: Eocene kaolin mine tailings; HMS: heavy mineral sands; TB: top of bed sample; MB: middle of bed sample; NA: not analyzed; analysis results in ppm
Diagrams for REE compositions of the mined kaolins, mine tailings, and sand lithologies; normalized to Upper Continental Crust (UCC) values

The Cretaceous kaolin mine tailings (MT-BNO7-IP) and their hand-panned heavy fraction (MT-BNO7-IP H-P) had the second and third largest ΣREE values (7,354 and 18,743 ppm, respectively) of any material in this study (Table 5). These mine tailings were highly enriched in the HREE, up to ~120–160 times relative to UCC. The Cretaceous kaolin mine tailings (MT-BNO7-SS) and the Eocene kaolin mine tailings showed substantially smaller overall REE enrichments but were still HREE enriched (Table 5). All mine tailings displayed negative Eu/Eu* anomalies, with values ranging 0.29–0.53.
The hand-panned heavy fraction of the Marion Member sands (mottled section) had the highest ΣREE (45,707–46,411 ppm) of any material in this study. The Marion Member sands (mottled section) were enriched relative to UCC in LREE La–Sm (~300–350 times) and HREE Tb–Lu (~150–250 times; Fig. 8). The Marion Member sands (cross-bedded section) displayed lower overall enrichments in the REE compared to the mottled section and were slightly depleted in Sc (Fig. 8). The sulfide-rich sand showed ΣREE concentrations ranging from 2,155 to 2,369 ppm. These concentrations of REE in the sulfide-rich sand were enriched relative to UCC in the LREE La–Sm (14–16 times) and HREE Tb–Lu (~8–10 times; Fig. 8). Excluding the Eocene sands and with the exception of Sc, all sand units were enriched in REE (Fig. 8). All sands were LREE-enriched (La/Yb > 1.0, UCC normalized) and displayed negative Eu/Eu* anomalies, with values ranging 0.25–0.66.
The variations of ΣREE, LREE, and HREE for kaolins, mine tailings, and sands were compared to whole-rock P, Ti, Mn, and Zr concentrations (Fig. 9). The ΣREE, LREE, and HREE showed the strongest regression coefficients (r2 = 0.99, 0.98, and 0.85) with whole-rock P content for the sands and mine-tailings samples. The regression coefficients of ΣREE and LREE with P were greater than the regression coefficient between HREE and P for the mined kaolins. The correlation between P and HREE content showed the greatest variation in the kaolin whole-rock samples which contained >90 wt.% kaolinite mineral content. The regression coefficients between Zr content and ΣREE, LREE, and HREE were low (r2 = 0.31, 0.24, and 0.47). The best correlations with Zr were noted for HREE and Zr (r2 = 0.47). Ti and Mn, compared to Zr, showed higher regression coefficients in the sands and mine tailings (Ti, r2 = 0.39–0.85; Mn, r2 = 0.88–0.97).
Linear correlation coefficient graphs for ΣREE, LREE, and HREE versus P, Zr, Mn, and Ti concentrations (ppm) per sample type (mined kaolins, mine tailings, sands); ‘BC HF’ represents the mined Cretaceous kaolin heavy-mineral subfraction reported by Elliott et al. (Reference Elliott, Gardner, Malla and Riley2018)

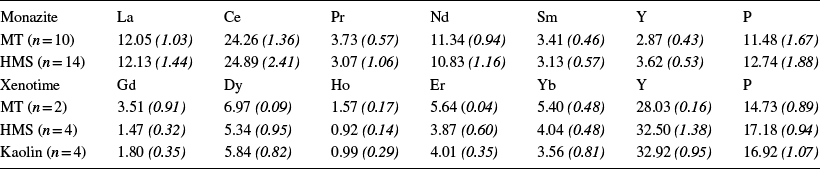
The distributions of the REE were examined in select minerals using SEM–EDS (Table 6, Tables S2 and S3). Monazite grains were observed in mine tailings and sands. The monazite contained significant concentrations of La, Ce, Nd, and Sm (Table 6, Table S2, Fig. 10). The monazite grains contained larger concentrations of the LREE (La, Ce, Nd) compared to Y. The LREE abundances in the analyzed monazite grains correlated strongly with the whole-rock LREE enrichments in the mine tailings and sands (Tables 5 and 6, Fig. 11). Xenotime grains were observed in all material types except the Eocene kaolin. Xenotime contained minor concentrations of Gd, Dy, Ho, Er, and Yb with major concentrations of Y (Table 6, Table S3, Fig. S9). The HREE enrichment trends in the analyzed xenotime grains correlated strongly with the whole-rock HREE concentrations trend in the mine tailings and sands (Tables 5 and 6, Fig. 11). Zircon was not found to contain much if any REE via SEM–EDS analysis (BDL – below detection limit, ≤ 0.5 wt.%, if present). SEM–EDS analyses showed Ti and Mn to be associated only with the Ti minerals (e.g. ilmenite).

SEM photomicrographs and EDS spectra of example monazite grains; a smooth, rounded monazite from the Eocene sands; b smooth, rounded monazite from the Eocene-derived mine tailings; c etched, pitted monazite grains from the Paleocene Marion Member sands overlying the mined Cretaceous kaolin; d etched, pitted monazite grains from the Cretaceous kaolin mine tailings; e advanced etched, pitted surfaces of monazite grains from the Paleocene-Cretaceous sulfide-rich sand contact

Correlation plot for whole-rock chemistry versus monazite and xenotime mineral-grain chemistry from mine-tailings material

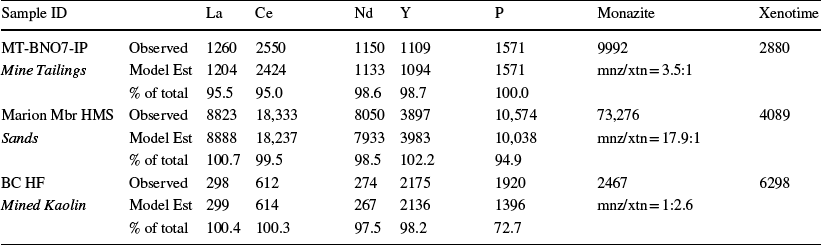
The REE elemental abundances of the REE in monazite and xenotime for each sample were used to model REE whole-rock concentrations and determine observation-fitted monazite/xenotime (mnz/xtn) ratios. The observation-fitted model shows that mnz/xtn of the Cretaceous mine tailings was 3.5:1. The mnz/xtn for the coarse fraction, heavy-mineral subfractions of the Cretaceous kaolin (‘BC HF’) was 1:2.6. The Marion Member sands overlying the mined Cretaceous kaolin showed mnz/xtn values that were 17.9:1. Based on the mnz/xtn of the two source materials (mined kaolin and lithologically adjacent Marion Member sands), the BC HF was shown by the model to account for 81 wt.% of the total REE by monazite and xenotime contribution, with the remaining 19% accounted for by the contribution of monazite and xenotime from the overlying Marion Member sands (Table 7).
Calculated monazite and xenotime ratios (mnz/xtn) determined by observed versus modelled REE concentrations

Abbreviations: MT: mine tailings; BNO7-IP: Cretaceous kaolin mine tailings HMS: heavy mineral sands; BC HF: Buffalo Creek kaolin heavy subfraction (Elliott et al., Reference Elliott, Gardner, Malla and Riley2018); concentration values in ppm
Interpretation and Discussion
REE and Mine Tailings
The mine tailings (i.e. ‘grit’) fractions of the mined kaolins contained abundant quartz and minor amounts of various heavy minerals including monazite and xenotime on a whole-rock basis (Tables 1 and 2). The mine-waste tailings (MT-BNO7-IP and HP) derived from the mined Cretaceous kaolins contained very high concentrations of monazite + xenotime (0.9–3.2 wt.%; Table 2). The ΣREE contents of the Cretaceous mine tailings impound sands (MT-BN07 IP) ranged from 0.7 to 1.9 wt.% (Table 5). The mine waste tailings (MT-BNO6) derived from mined Eocene kaolins contained 284 ppm ΣREE and only ~0.1 wt.% monazite + xenotime (Tables 2 and 5). In terms of chemical composition, the mine waste tailings were overall more enriched in the HREE relative to the UCC (i.e. La/Yb < 1.0, UCC normalized) owing to a greater contribution of HREE than LREE from the coarse fraction of the mined kaolin source (Fig. 8).
These findings were similar to those from a previous study which showed the heavy-mineral subfraction of kaolin grit to be substantially enriched in HREE relative to UCC by 100–150 times (Elliott et al., Reference Elliott, Gardner, Malla and Riley2018). While HREE were enriched overall (La/Yb < 1.0, UCC normalized), the mine-waste tailings of this study were found to contain slightly greater amounts of monazite (LREE-rich) than xenotime (HREE-enriched), with a mnz/xtn ratio of 3.5:1 (Table 7). One possible explanation of the greater monazite content is that the kaolin mine-waste tailings were processed from mined kaolin that contained minor amounts of the heavy minerals from the overlying Marion Member sands (Huber Formation). The Marion Member sands showed enrichment in the LREE (i.e. La/Yb > 1.0, UCC normalized) and with the monazite content being greater than the xenotime content. The amounts of monazite and its LREE admixture would not have been of sufficient proportion to be observed as an LREE-enriched mine-tailings material. It was plausible that these minor amounts of Marion Member sands could have been admixed with the mined kaolin during the initial mining of these kaolin units by excavation methods used typically in the mining of kaolin. The REE abundances in the kaolin mine-waste tailings were shown to be derived from an HREE-enriched contribution from the mined kaolins (81 wt.%) and the LREE-enriched overlying Marion Member sands (19 wt.%) per the modeled calculations (Table 7).
The differences in the whole-rock REE analyses between these two mined kaolin units and their respective ‘grit’ tailings coincided also with a difference in the size and roundness of the quartz grains. The differences in rounding of quartz grains were indicative of the distances to source terrains (e.g. Pettijohn, Reference Pettijohn1957). The quartz and zircon grains from the mine tailings derived from the mined Eocene kaolins were found to be more rounded than the same minerals present in the mine tailings derived from Cretaceous kaolins. The more well rounded grains depicted a more mature sediment (greater sorting) and probably more distant source for the Eocene mined kaolins. On the other hand, the greater amounts of monazite + xenotime and ΣREE content of the Cretaceous kaolin mine tailings might have resulted from closer proximity to its source terrain during transport and deposition (Cheshire et al., 2018).
Sands
The measured REE concentrations of the heavy mineral-containing Marion Member sands (Huber Formation) were some of the most noteworthy findings in this study. The total REE for the mottled section of the Marion Member sands ranged from 45,707 to 46,411 ppm (~4.6 wt.%) from a sample showing localized concentrations at outcrop (Table 5). These REE concentrations were the highest measured from lithologies in the kaolin district in this study and in past studies (Cheshire et al., 2018; Dombrowski, 1992; Elliott et al., Reference Elliott, Gardner, Malla and Riley2018). These REE were also enriched in the LREE, Th, and U relative to UCC (Table 5, Figs. 7 and 8). Monazite was more prevalent than xenotime as the primary REE-bearing phase in this Marion Member sands (Tables 2 and 7).
At first approximation, the source of the monazite was the Monazite Belts found in the Piedmont terrane. These Belts are considered to be the source of monazite present in beach placer and alluvial deposits of the North and South Carolina Piedmont terrane (Bern et al., Reference Bern, Shah, Benzel and Lowers2016; Mertie, Reference Mertie1953, 1975). These placers have been considered as primary domestic sources of monazite as well as Th (Mertie, Reference Mertie1953). The monazite-bearing Paleocene age Marion Member strongly resembled the relatively large amounts of monazite found in the alluvial sediments being deposited in the upper Atlantic Coastal Plain (e.g. Bern et al., Reference Bern, Shah, Benzel and Lowers2016). These modern alluvial sediments contained more monazite than xenotime with ratios of 6:1 to 12:1 (Bern et al., Reference Bern, Shah, Benzel and Lowers2016) and, therefore, would also show enrichment in the LREE as was found with the Paleocene-age Marion Member sands. Monazite has also been found as the predominant REE-bearing mineral in younger heavy-mineral sand deposits in the Lower Coastal Plain (Oladeni et al., 2021).
The residence of the REE in monazite and xenotime minerals from the Marion Member sands was further shown by ΣREE, LREE, and HREE showing the strongest regression coefficients (r2 = 0.99, 0.98, and 0.85) with whole-rock P content for the sands. Zr, Ti, and Mn showed weaker regression correlation coefficients (Fig. 9). These weaker regression correlations between the REE totals with Zr, Ti, and Mn were probably driven by both the lack of partitioning of the REE, LREE, or HREE into specific minerals and the abundances of the Ti minerals (+ Mn) and the Zr-bearing zircon minerals in various fractions. The highest regression correlation coefficient for Zr was shown to be between Zr and HREE. This correlation is supported by the results of many studies showing the concentration of the HREE in zircon (e.g. Hoskin & Schalltegger, Reference Hoskin and Schaltegger2003). Mn was probably not partitioned by any specific phase except for ilmenite. The greater regression correlation coefficient between Mn and the REE totals probably resulted from its greater concentrations of the ilmenite and other Ti minerals in the heavy-mineral fractions of the sands and mine tailings. Of note, the total REE for anatase, rutile (ΣREE = 34 ppm), and ilmenite (ΣREE = 45 ppm) did not contain significant amounts of the REE in the heavy-mineral sand deposits in the Lower Coastal Plain (Oladeni, 2022; Oladeni et al., 2021). These Ti-minerals would not be expected to contain significant amounts of the REE.
The correlation coefficients were useful to confirm the association of the REE with the phosphate minerals (monazite and xenotime). Monazite, xenotime, zircon, and the Ti minerals accumulated together by density sorting processes during deposition of these Marion Member sands. These heavy minerals would also show particle-size affinity for the coarse fraction, compared to the kaolin with affinity to the clay-rich fine fraction of the deposits. Therefore, these heavy minerals would accumulate together in the mine tailings.
While the magnitudes of REE enrichments in the Marion Member sands were surprising and noteworthy, the overall LREE enrichment (La/Yb > 1.0, UCC normalized) of these sands from this study and related studies is not unexpected. LREE enrichments are seen in the upper continental crust, shale composites, and clastic sediments (e.g. Piper, Reference Piper1974; Gromet et al., Reference Gromet, Haskin, Korotev and Dymek1984; Condie, 1991; Rudnick & Gao, 2003; Taylor & McLennan, Reference McLennan and Ross Taylor2012). Similarly, the conversion of volcanic ash and volcaniclastic sediments to clay-rich bentonite and secondary bentonites also resulted in LREE-enriched clays (Kadir et al., 2021; Zielinski, 1982). The breakdown of crustal rocks into clastic sediments transfers the REE so that the derived clastic sediments likewise are similarly enriched in the LREE (e.g. Piper, Reference Piper1974). Monazite was consequently relatively more enriched than xenotime in clastic sedimentary rocks and is another reflection of the transfer of LREE from parent to clastic sediment (Morton & Hallsworth, 2007). LREE enrichments seen in the Marion Member sands and other siliciclastic sediments contrasted with the HREE enrichments in the kaolin mine-waste tailings (Fig. 8), and in heavy-mineral fractions of the mined kaolins from previous studies (e.g. Elliott et al., Reference Elliott, Gardner, Malla and Riley2018). A possible reason(s) for the HREE enrichment in the mined kaolins and tailings is discussed below.
Kaolins
Trace amounts of xenotime were observed in the mined Cretaceous kaolins via XRD and SEM analyses during analysis of heavy subfractions. The whole-rock analyses by ICP-MS for the kaolins showed LREE enrichment (Fig. 8). The enrichment in LREE was consistent with the presence of LREE phosphates (crandallite, florencite) in the fine fraction (<45 µm) of the mined kaolins (Cheshire, 2011; Cheshire et al., 2018). The fine fraction (<45 µm) comprised typically the majority (>90 wt.%) of the mined kaolins. The presence of secondary phosphate (crandallite, florencite) with lower densities (2.7–3.7 g/cm3) would have affinity to this fine fraction (<45 μm) compared to the larger and more dense xenotime/zircon grains (4.5–5.5 g/cm3) with affinity to the coarse fraction (>45 μm). This difference in the grain sizes might explain the LREE enrichment in the fine fraction of mined kaolins while leaving the HREE to be concentrated in coarser, heavier subfractions of the mined kaolins (Elliott et al., Reference Elliott, Gardner, Malla and Riley2018).
Additionally, xenotime overgrowths on zircon were identified in the coarse, heavy-mineral subfraction of the mined Cretaceous kaolins (Fig. 4). The overgrowths were not observed in the younger mined Eocene kaolins. Xenotime overgrowths on zircon have been observed by other studies outside of the Georgia kaolins and has been suggested as diagenetic in origin (Berti et al., Reference Berti, Slowey, Yancey and Deng2022; Morton & Hallsworth, 2007; Rasmussen, Reference Rasmussen1996, 2000, Reference Rasmussen2005). Xenotime can form readily as overgrowths on zircon when sediment pore water contains REE + P + zircon (Rasmussen, Reference Rasmussen2005), in part due to the isostructural relationship between xenotime and zircon (Burt, 1989). The presence of xenotime overgrowths on zircon increases the size of the resulting zircon + xenotime grain. The sum grain size (increase) may be sufficient to cause zircon (with xenotime) to be found more abundantly in a coarser fraction of mined kaolins and the derived mine waste tailings. Geochronologic studies of the xenotime are needed to test the idea of diagenetic origin of xenotime on zircon (Rasmussen et al., Reference Rasmussen2005).
Mineral-grain surface textures of dissolution pitting and etching were observed in the Paleocene sands and the Cretaceous mined kaolins indicating chemical weathering post-deposition. Smooth, rounded mineral grain surfaces with no indication of post-deposition chemical weathering were observed for the Eocene sands. The dissolution etching/pitting of detrital, primary phosphates observed allows consideration of the possible release of REE from parent phosphate minerals as dissolved constituents within the mined kaolins. The precipitation of LREE phosphates has already been described for the mined kaolins of Cretaceous age and the Sparta Granite (Cheshire et al., 2018). The weathering of the Liberty Hill Pluton led to the sorption of the REE on its regolith (Bern et al., Reference Bern, Yesavage and Foley2017).
The possible presence of adsorbed REE would probably indicate either conversion of in situ parent granite materials to kaolin clays with sorbed REE, or in the weathering reactions of detrital mineral content within the mined kaolins (Cheshire et al., 2018). Sorbed REE would not remain after transport and deposition of the siliciclastic mineral input building out the Coastal Plain when acknowledging the brackish and/or high-salinity ocean water chemistry of the depositional environments for the Georgia kaolins. The Na and Mg contents of brackish or ocean-water chemistry would be sufficient to desorb any exchangeable component of ion-adsorbed REE on mineral surfaces of the transported sediments (Zhang et al., 2020). Therefore, if present, sorbed REE would be related directly to the processes occurring post-deposition. Investigations of sorbed REE in the Georgia kaolins remains unreported.
Conceptual Model for REE in the Georgia Kaolins
The REE in the kaolin deposits were delivered predominantly to the Upper Coastal Plain hosted by primary phosphate minerals (monazite and xenotime). The detrital sediments which formed the Georgia kaolin deposits originated from Piedmont terrane rocks and saprolites, transported by riverine processes (Dombrowski, 1992). These sediments were mixed efficiently during transport prior to deposition (Cheshire, 2011). The sediments were deposited with uniform REE patterns with respect to UCC (Rudnick & Gao, 2003), shale composite (Piper, Reference Piper1974) and the Georgia kaolins’ saprolite source rocks in the Piedmont (e.g. GASC; Cheshire, 2011; Cheshire et al., 2018).
Cretaceous and Paleocene sediments underwent diagenesis producing several differences in physical and chemical properties long recognized between the Cretaceous and Eocene kaolins of Georgia (Hinckley, Reference Hinckley1965; Buie et al., Reference Buie, Hetrick, Patterson and Neeley1979; Buie & Schrader, 1982; Patterson & Murray, Reference Patterson and Murray1984; Pickering & Hurst, 1989; Hurst & Pickering, Reference Hurst and Pickering1997; Elzea-Kogel et al, 2002). Monazite and xenotime originated as detrital mineral input to the kaolin deposits that formed during the Cretaceous and Eocene. The monazite and xenotime present in the Cretaceous kaolin and Paleocene age sediments (e.g. Marion Member sands) underwent post-depositional chemical weathering (diagenesis conditions). These grains were weathered chemically in part by the presence of organic acids released by decaying organic matter in the overlying stratigraphy. These organic acids decreased porewater pH early during diagenesis (Cheshire, 2011).
The remobilization of REE observed as non-uniform distribution patterns of the Cretaceous kaolins (relative to the saprolite source, GASC; Cheshire, 2011) led to the formation of secondary LREE-phosphates (Cheshire et al., 2018). In contrast, the uniformity and overall low abundances of the REE of the Eocene kaolins suggested that the presence of these REE was attributed to source-rock inheritance – little to no REE remobilization and fractionation during the post-depositional diagenetic processes (Cheshire, 2011). In the older Cretaceous and Paleocene sediments, the diagenetically influenced remobilization of LREE led to mineralization of secondary phosphates in the fine fraction of the kaolins, and remobilized HREE led to xenotime overgrowth formation on zircon in the coarse fraction. This depicts one set of mechanisms of REE fractionation in the Georgia kaolins. Mineral-grain surface textures of dissolution etching and pitting in the Paleocene sands overlying the Cretaceous kaolins allow consideration of the remobilized REE and sorption onto mineral surfaces as another mechanism of REE fractionation in the Georgia kaolins.
Conclusions
The mine waste tailings were, overall, enriched in the REE, with HREE enrichment greater than that of LREE. The primary REE-minerals in the mine-waste tailings included both monazite and xenotime. Yet, monazite was more abundant than xenotime in the mine tailings. The ΣREE regression coefficients of the mine tailings and sands were strongest with P (r2 > 0.99), attributed to monazite and xenotime content. Other mineral sources of REE, such as zircon, were ruled out as significant sources of the REE based on lower regression correlation coefficients. Only minor amounts of kaolinite (< 16 wt.%) were present in mine tailings and were also ruled out as significant sources of REE in these materials. The REE contents in the mine tailings were derived from the REE minerals in the mined kaolin mixed with REE mineral content from the overlying sands during mining.
The mine-waste tailings derived from the mined Cretaceous kaolins showed greater concentrations of monazite + xenotime (0.9 to 3.2 wt.%; ΣREE 0.7 to 1.9 wt.%) compared to the barren mine waste tailings derived from mined Eocene kaolins (~0.1 wt.% monazite + xenotime, ΣREE ~300 ppm). The differences spoke to the possibility of a more distant source provenance for siliciclastic mineral input of the Eocene kaolins and adjacent sand lithologies, compared to the Cretaceous kaolins and their adjacent sands.
The heavy mineral-containing sands of the Marion Member (Huber Formation) contained the greatest monazite and xenotime ratios, and highest concentrations of monazite + xenotime (6–8 wt.%; ΣREE 4.6 wt.%) compared to all lithologies in the kaolin district in this study and past studies. The ratios of monazite and xenotime contents were similar to modern accumulations of alluvial sediments in the upper Atlantic Coastal Plain (Bern et al., Reference Bern, Shah, Benzel and Lowers2016). Monazite and xenotime were found to drive the strongest correlation with ΣREE. A negligible ΣREE contribution was found from all the other elemental/mineral sources in the sands.
The mined kaolins were enriched in LREE on a whole-rock basis. The mined kaolins were predominantly composed of a fine fraction (<45 µm) of kaolin. Xenotime in the Cretaceous kaolins was observed as diagenetic overgrowths on zircon. The xenotime overgrowths and discrete, liberated xenotime overgrowths grains contributed the HREE fractionation (Figs. 4 and 12) in the coarse, heavy-mineral subfraction. The sources of Y and phosphate for these overgrowths were probably from detrital xenotime. These source xenotime grains were chemically weathered during diagenesis of the Paleocene and Cretaceous sediments and reprecipitated as xenotime overgrowths in the Cretaceous kaolins. Furthermore, the xenotime overgrowths on zircon were observed only in the Cretaceous kaolins which underly directly the Paleocene sands. Xenotime overgrowths were not present in the Eocene sands or kaolins.
Conceptual model for REE fractionation in the Georgia kaolins

Previous study by Cheshire (2011) and Cheshire et al. (2018) showed the presence of florencite and similar secondary REE-phosphates (e.g. crandallite) in the fine fractions of the mined Cretaceous kaolins and saprolite source rocks for modern kaolinitic sediments in the Atlantic Upper Coastal Plain. These findings of secondary phosphate minerals coupled with the SEM observations herein showing monazite and xenotime grains with dissolution textures (pitting, etching) permit further consideration of the released REE and adsorption onto kaolin mineral surfaces.
The lack of correlation of ΣREE with P and the positive Eu/Eu* anomalies in the kaolin anomalies suggest that monazite and xenotime do not account fully for the REE found for mine tailings and sands. The presence of sorbed REE might further explain the observed fractionation of LREE in the fine fraction while the HREE were fractionated into the coarse fractions of the mined kaolins. Such sorption processes would need to be consistent also with the known diagenetic processes, physical properties, and chemical properties of Georgia kaolins (Cheshire, 2011; Cheshire et al., 2018; Hurst & Pickering, Reference Hurst and Pickering1997; Patterson & Murray, Reference Patterson and Murray1984; Pickering & Hurst, 1989).
Supplementary Information
The online version contains supplementary material available at https://doi.org/10.1007/s42860-023-00235-7.
Acknowledgements
Field-site logistics and sampling in this study were greatly supported by geologist Andrew May. Dr. Alex Pullen (Clemson University) provided guidance on separation of the sands. The authors thank two anonymous reviewers and the editors for their comments and recommendations during revisions.
Author Contribution
A. Boxleiter performed field collection, sample processing, and laboratory analyses.
W.C. Elliott provided guidance on the selection of samples, field work, laboratory analyses, writing, and discussion of results.
Funding
Imerys funded lab testing fees and field work. There was no extramural funding.
Data Availability
All data used to prepare this paper are given in the text or in the Supplementary Information.
Declarations
Ethical Approval
Not applicable.
Consents to Participate
Not applicable.
Consent for Publication
The authors agree on all content written in this paper.
Conflicts of interest
A. Boxleiter is a student at Georgia State University and employed by Imerys. Georgia State University and Thiele Kaolin Company own one US patent related to the extraction of rare earth elements from gangue heavy fractions (US Patent10,688,501).