I. INTRODUCTION
Nanomaterials have been studied extensively for several years. The marked interest for these materials is due to their unique properties, their high surface-to-volume ratios and their potential applications in various fields for example in magnetic recording,Reference Iwasaki, Itoh and Yamamura1,Reference Qiu, Bai and Wang2 catalysisReference Cattarin and Musiani3,Reference Park, Han and Sung4 or medicine (diagnosis or treatments).Reference Alexiou, Jurgons, Seliger and Iro5–Reference Debouttiere, Roux, Vocanson, Billotey, Beuf, Favre-Reguillon, Lin, Pellet-Rostaing, Lamartine, Perriat and Tillement7 Numerous production techniques are used to synthesize them. Different methods can be cited (chemical, physico-chemical, mechanical, and thermal).Reference Darezereshki, Alizadeh, Bakhtiari, Schaffie and Ranjbar8,Reference Akimov, Andrienko, Egorov, Zherin and Usov9 Chemical vapor condensationReference Tolochko, Choi, Nasibulin, Vasilieva, Lee and Kim10 or deposition,Reference Aksoy, Kalay and Unalan11 laser ablation,Reference Suzuki, Tanaka, Ando and Takagi12,Reference Messaoud Aberkane, Boudjemai and Kerdja13 evaporation,Reference Förster, Wolfrum and Peukert14 oxidation route,Reference Zhan, Zheng, Liu and Wang15 chemical reduction,Reference Malina, Sobczak-Kupiec, Wzorek and Kowalski16 and sol–gel methodsReference Anastasescu, Anastasescu, Teodorescu, Gartner and Zaharescu17,Reference Liu, Zou, Li, Liao, Hong, Xiao and Fan18 and recently, biological processesReference Mitra, Vishnudas, Sant and Annamalai19,Reference Yaaghoobi, Emtiazi and Roghanian20 can be used too. Electrodeposition is another interesting synthesis method because it is cheap and very simple to implement.
Multiple parameters influencing the final form and numerous shapes of nanoparticles can be found in the literature: spheres,Reference Wang, He, Cui and Guo21 dots,Reference Kim, Lee, Yoon and Kim22 tubes,Reference Li, Gu, Guan, Zhou and Shang23 cubes,Reference Abbas, Takahashi and Kim24 tetrapods,Reference Zhu, Li, Lu, Zhao, Huang, Liu and Li25 and wires.Reference Li, Gu, Guan, Zhou and Shang23 Nanowires are particularly interesting because of their excellent sensitivity which allows their use in electrical, optical, and chemical transmission signals.Reference Cui, Wei, Park and Lieber26 They can also reinforce textiles and make them functional (“smart textiles”). To elaborate these nanometric wires, a particular electrodeposition process, the template method, is often used because it is rather simple and versatile. Arrays of uniform nanowires are produced using a porous membrane. Different types of nanowires have been obtained by this method: pure metals,Reference Chung, Yang, Liao and Li27 alloys,Reference Ali and Maqbool28,Reference Kumar, Vohra and Chakarvarti29 oxides,Reference Perret, Brousse, Bélanger and Guay30,Reference Daltin, Addad and Chopart31 and semiconductors.Reference Al-Salman, Mallet, Molinari, Fricoteaux, Martineau, Troyon, Zein El Abedin and Endres32 Core–shell nanowires are also synthesized initially by a superposition of two different types of semiconductors for electronic applications.Reference Cui and Lieber33 Most of the time, the replacement reaction was used to form a shell. Concerning the core of the nanowires, different routes were used such as hydrothermal synthesis,Reference Mohl, Dobo, Kukovecz, Konya, Kordas, Wei, Vajtai and Ajayan34 thermally assisted photoreduction,Reference Shen, Chen, Song and Chen35 or chemical reduction process.Reference Chen, Kuai, Yu, Li and Geng36–Reference Sun and Wang38 In a recent study, Zhao et al.Reference Zhao, Zhang and Zhang39 have prepared Cu/Ag nanowires for the electronic industries. Their aim was to protect copper from oxidation thanks to Ag coating. They have synthesized their copper core by chemical reduction using hydrazine as a reduction agent. In our study, the same material has been synthesized but using a different method (template and replacement reaction) and for a different application (potential bactericidal properties, in the continuation of a previous study on Cu/Ag nanopowdersReference Mancier, Rousse-Bertrand, Dille, Michel and Fricoteaux40). Indeed, metallic copper and silver are two bactericide metals used in the medical field (against Staphylococcus aureus and Escherichia coli). The comparison between the antibacterial activity of Ag and Cu or Ag–Cu (bimetal, alloy or mixture) was studied but did not always yield the same conclusions. Jing et al.Reference Jing, Yu and Li41 have shown the synergic effect of the metals with Cu/Ag bilayered films that destroys Bacillus atrophaeus. Some authorsReference Khare, Sharma and Verma42,Reference Ruparelia, Chatterjee, Duttagupta and Mukherji43 have found that silver presents the best properties against both E. coli and S. aureus. For Mat Zain et al.,Reference Mat Zain, Stapley and Shama44 the antibacterial effect increases according to the following sequence: Cu < Cu and Ag mixture < Ag < Cu–Ag alloys. In contrast, Valodkar et al.Reference Valodkar, Modi, Pal and Thakore45 have found a more important bacterial growth inhibition in the presence of copper as compared to silver; Tamayo et al.Reference Tamayo, Zapata, Vejar, Azócar, Gulppi, Zhou, Thompson, Rabagliati and Páez46 reported the same conclusion concerning Listeria monocytogenes. They attributed this phenomenon to a better release of copper ions compared to silver ions. Ruparelia et al.Reference Ruparelia, Chatterjee, Duttagupta and Mukherji43 have found the opposite, i.e., better action of silver compared to copper and explained their results by the presence of a copper oxide layer that decreases the copper ion release. So, their association via a porous core–shell nanostructure should be interesting because the silver layer could prevent the excessive formation of a copper oxide layer, while allowing their oxidation by the bacterial environment through the pores of the silver layer.
To minimize the traces of toxic agents in our nanowires, the template process was chosen to elaborate the copper core. For the shell, the problem was that chemical and electrochemical silver deposits are known to have a dendritic growth.Reference Sulka and Jaskula47 In surface treatment, a complexing agent such as cyanide ions, ethylene diamine tetraacetic acid and many others are used to improve the surface roughness and decrease the porosity. However, those chemical additives are hazardous for health and environment. An alternative could be to use ionic liquids often considered as “green” solvents. Most of them are easy to use in electrochemistry since they are both liquid at ambient temperature and ionic conductors. They can also dissolve numerous organic and inorganic compounds.Reference Wilkes and Zaworotko48 For all these reasons, the industry is more and more interested in extraction of metalsReference Endres, Abbott and MacFarlane49 by using this type of solvent. However, few publications report the use of ionic liquids to elaborate core–shell nanostructures.Reference Helgadottir, Arquillière, Bréa, Santini, Haumesser, Richter, Mudring and Aouine50,Reference Xu, Xu, Li, Yan, Xia, Yin and Zhang51 In the present paper, Cu–Ag core–shell nanowires were synthesized by using electrodeposition to produce a copper core. Then the surface copper atoms of these nanowires were replaced by silver atoms using a galvanic replacement reaction to obtain core–shell structures. Aqueous and ionic solvents were tested for silver deposition on a copper core. A comparison of the electroless deposition kinetics between both media was performed.
II. MATERIALS AND METHODS
A. Copper core elaboration
The copper nanowires were synthesized using a three-electrode electrochemical setup. The aqueous solution for copper electrolysis was made with copper sulfate pentahydrate (CuSO4·5H2O from Panreac Applichem, Barcelona, Spain) at 0.1 mol/L and sulfuric acid (H2SO4 from Chimie-Plus Laboratory, Denicé, France) at 0.9 mol/L. The copper electrolyte was regulated at 30 °C. Before experiments, the oxygen was removed from electrolyte by nitrogen bubbling for 20 min. During electrolysis, the nitrogen bubbling was stopped. The counter electrode was a pure copper rod (99.9%) and the reference electrode was a saturated mercury sulfate electrode noted as SSE in the text. The working electrode consists of a porous polycarbonate membrane (Nuclepore® Track-Etch Membrane; Whatman-Sigma-aldrich, Oslo, Norway) covered on one side with 400 nm of sputtered gold to ensure the sealing of the pore and provide a good electrical contact.Reference Fricoteaux and Rousse52 The membrane was 11 µm thick with a surface in contact with solution equal to 2.7 cm2. The membrane pores had a theoretical diameter of 200 nm and the pore density was 2.3 108 pores/cm2 corresponding to a theoretical active surface for experiments equal to 0.2 cm2. During electrodeposition, metallic copper appears at the surface of the gold before growing inside the pores of the membrane. The potential of −1.00 V versus SSE was chosen to carry out the production of copper nanowires.Reference Mancier, Rousse-Bertrand, Dille, Michel and Fricoteaux40
B. Silver shell elaboration
After dissolution of the membrane in distilled chloroform (CHCl3), the copper nanowires were dipped into a stirred solution of Ag(I) ions to cover them with a shell of metallic silver. The galvanic replacement reaction of silver was performed at ambient temperature. Before experiments, the oxygen was removed from electrolyte by nitrogen bubbling for 20 min. During galvanic replacement reaction, the nitrogen bubbling was stopped.
1. Silver aqueous solution
The silver aqueous solution ([Ag+] = 10−3 mol/L) was prepared with silver oxide (Ag2O from Fluka-Sigma-aldrich, Oslo, Norway), sulfamic acid (H3NO3S from Chimie-Plus Laboratory; 0.2 mol/L), Ethylenediaminetetraacetic acid (EDTA from Chimie-Plus Laboratory; 0.1 mol/L), and sodium hydroxyde pellets (NaOH from Chimie-Plus Laboratory). Silver oxide and sulfamic acid were first dissolved in deionized water. EDTA and NaOH were slowly added together to the previous solution. This order of insertion prevents the formation of unsolvable silver complexes. Finally, the pH was adjusted at 9.3 with sodium hydroxide.
2. Silver ionic solution
The ionic solvent was 1-butyl-1-methylpyrrolidinium bis(trifluoromethanesulfonyl)imide (P1,4NTF2) and the silver salt was silver bis(trifluoromethanesulfonyl)imide (AgNTF2). P1,4NTF2 and AgNTF2 from Solvionic (Toulouse, France) were used without any further purification. As in the aqueous solution, the concentration of silver was chosen to be 0.001 mol/L.
C. Characterization methods
The electrochemical measurements were performed using a Radiometer potentiostat-galvanostat PGZ 301 (Radiometer-analytical, Lyon, France) controlled by using Voltamaster 4 software. The voltammetry method was used to register the current density–potential curve and the potentiostatic curve for copper nanowire elaboration.
X-ray diffraction (XRD) analyses were carried out using a Brucker D8 Advance x-ray diffractometer (Bruker, Karlsruhe, Germany) equipped with a copper anticathode  $\left( {{\lambda _{{\rm{Cu}}{{\rm{K}}_\alpha }}} = 1.54056\;{\rm{{\AA}}}} \right)$. XRD diffractograms were recorded in Bragg Brentano configuration.
The chemical composition was investigated by energy-dispersive x-ray spectroscopy (EDXS) using a JEOL 1300 microprobe coupled with a JEOL JSM 6440LA scanning electron microscope (SEM; JEOL Europe SAS, Croissy sur Seine, France). All the EDXS atomic percentages are given with an accuracy of 4%.
Scanning transmission electron microscopy (STEM) was performed using a JEOL 2100F field emission microscope operating at 200 kV (JEOL Europe SAS). The STEM photomicrographs were recorded with a 1 nm nominal probe size using an annular dark field detector (Gatan Ltd., Gatan France, Evry, France). Electron energy loss spectroscopy (EELS) was recorded using a Gatan Imaging Filter quantum operating in spectrometer mode. The two metals (Ag and Cu) were simultaneously recorded by their respective edge i.e., L23 located at 931 eV for copper and M45 located at 367 eV for silver. Elemental signals were extracted by the conventional AE −r power law model for background modeling where E is energy, and A and r are fitting parameters.
III. RESULTS AND DISCUSSION
A. Copper nanowire synthesis
Before electrolysis, the working electrode was immersed into the electrolyte for 30 min to obtain a good wettability of the pores.
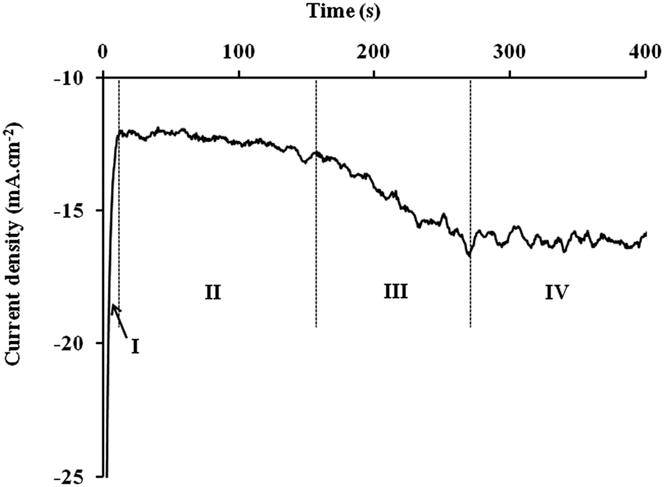
A preliminary study must be done to determine the maximum electrolysis duration before the nanowires overflow. For this, a chronoamperogram (Fig. 1) was recorded.
Current density–time curve during nanowire formation at −1 V/SSE. I: nucleation and establishment of the diffusion layer, II: growth of nanowires inside the pores, III: overflow and IV: thin film creation (current density is calculated with the theoretical active surface).

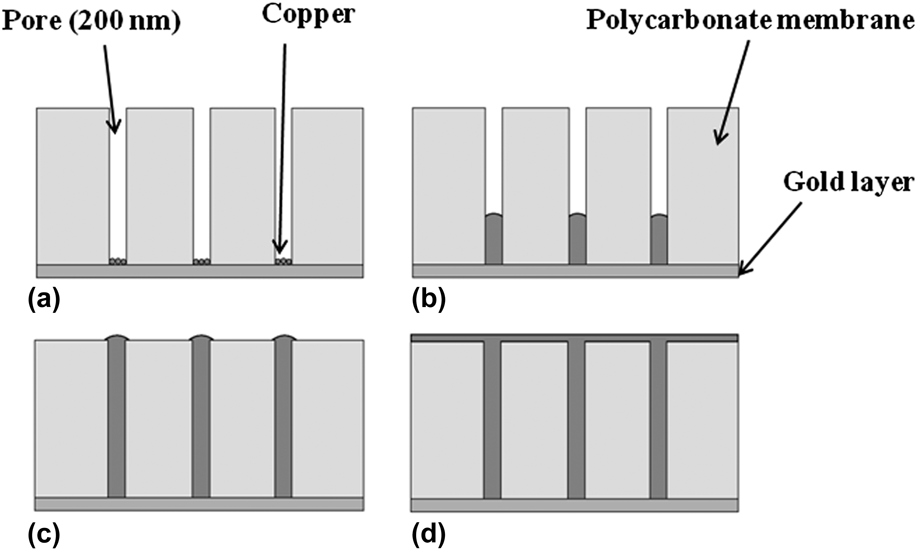
The curve obtained can be divided into four stages. In the first one, the cathodic current density decreases strongly with the deposition time. In the second stage, the current density remains roughly stable. After about 150 s of polarization, the cathodic current density increases (stage III) and then stabilizes (stage IV). During stage I, two phenomena appear: nucleation and establishment of the diffusion layer. The second stage appears when the diffusion layer is stabilized. During stage II, the deposit grows inside the pore [Figs. 2(a) and 2(b)] until it reaches the extremity of the pore.Reference Rousse and Fricoteaux53 Then, the increase of the current density which appears in stage III is linked to a change of the active surface accompanying the overflow of the pore [Fig. 2(c)]. As the copper deposition continues beyond pores, a thin layer of metallic copper is created [Fig. 2(d)] (stage IV) and the current becomes stable. To elaborate our nanowires, the polarization has to be stopped before overflowing. In this study, a polarization time of 100 s was chosen.
Schematics of the nanowire growth in the pores of the polycarbonate membrane. (a) nucleation, (b) growth of nanowires inside the pores, (c) overflow and (d) thin film creation.
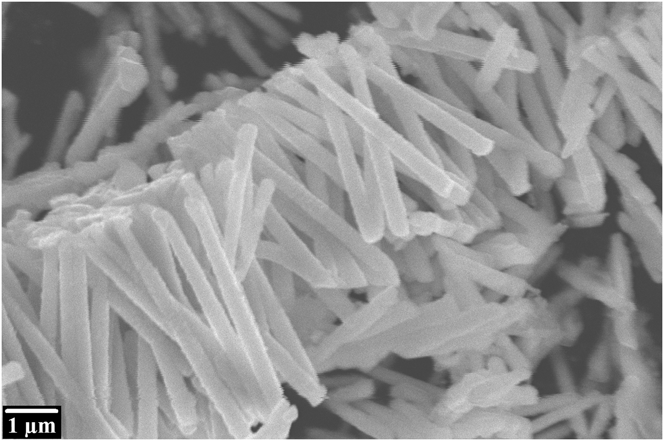
After electrodeposition and before the galvanic replacement reaction, the polycarbonate membrane is dissolved using chloroform (CHCl3). Figure 3 shows copper nanowires after polycarbonate membrane dissolution. The nanowire diameter found on this photomicrograph is about 300 nm. This high value compared to the theoretical pore diameter (200 nm) can be explained by the elasticity of the polycarbonate membrane. Note that the observed nanowire length (about 5 µm) is shorter than the thickness of the polycarbonate membrane (11 µm) because the electrolysis was stopped much before the overflow.
SEM photomicrograph of copper nanowires synthesized at −1000 mV versus SSE.
B. Silver shell elaboration
The copper nanowires were immersed in the silver solution to provoke a spontaneous silver deposit. In aqueous solution and according to the respective potential of copper and silver (E 0 = 0.80 V versus SHE for Ag+/Ag; E 0 = 0.34 V versus SHE for Cu2+/Cu), Eq. (1) takes place.
 $$2{\rm{Ag}}\left( {\rm{I}} \right) + {\rm{Cu}} \to {\rm{Cu}}\left( {{\rm{II}}} \right) + 2{\rm{Ag}}\quad {\rm{.}}$$
In the ionic liquid used, it was shownReference Zein El Abedin, Saad, Farag, Borisenko, Liu and Endres54,Reference Rousse, Beaufils and Fricoteaux55 that the first copper oxidation step leads to Cu(I). Consequently, Eq. (2) must be envisaged for the galvanic replacement reaction.
 $${\rm{Ag}}\left( {\rm{I}} \right) + {\rm{Cu}} \to {\rm{Cu}}\left( {\rm{I}} \right) + {\rm{Ag}}\quad {\rm{.}}$$
The same galvanic replacement reaction was observed by Abbott et al.Reference Abbott, Nandhra, Postlethwaite, Smith and Ryder56 in an eutectic ionic liquid.
After the galvanic replacement reaction under magnetic stirring, the Cu–Ag nanowires were filtered under vacuum and rinsed with deionized water and deoxygenated ethanol. After washing, the nanowires obtained were stored in deoxygenated pure ethanol. The Ag/Cu ratio is linked to the galvanic replacement reaction time. It can be easily obtained by studying the kinetics of the galvanic replacement reaction. When the silver layer on the copper nanoparticle surface becomes dense enough, the galvanic replacement reaction stops and bilayer particles (copper core–silver shell) are formed. If the silver surface is not dense enough but totally covers the copper core, core–shell nanowires can be obtained by stopping the deplacement reaction—by removing the wires from Ag(I) solution. For antibacterial actions,Reference Jing, Yu and Li41 this last case is certainly the best option because copper and silver would be accessible.
1. Silver shell elaboration in aqueous media
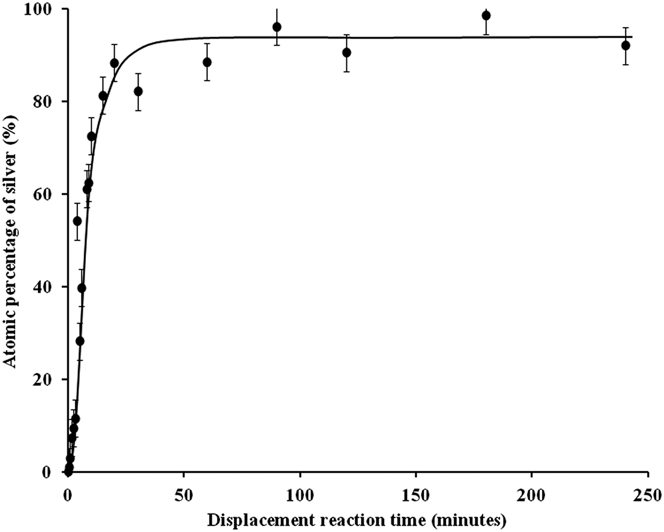
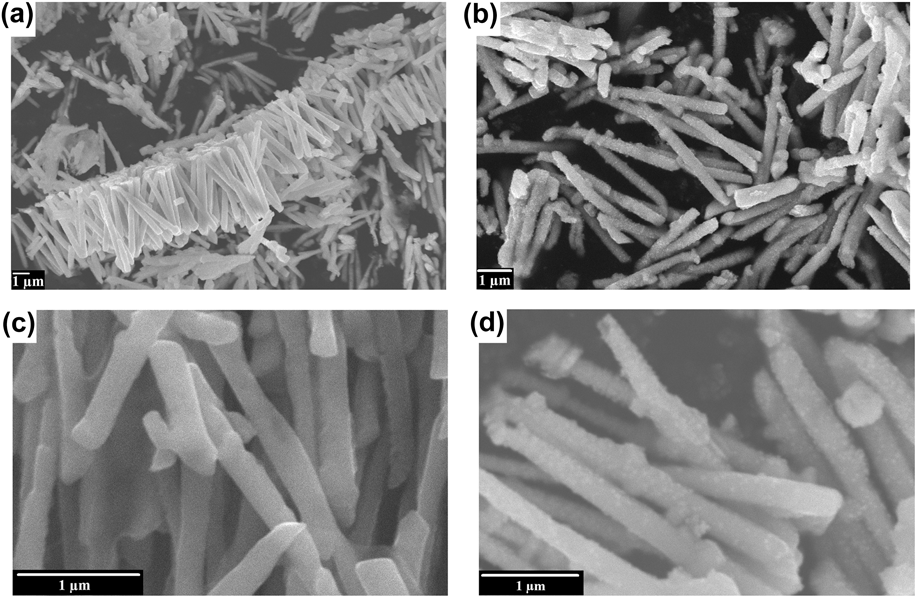
Figure 4 exhibits the evolution of Ag atomic percentage during the galvanic replacement reaction [Eq. (1)] in aqueous solution. The atomic percentage of silver increases very quickly during the first minutes. This is due to a great accessibility of copper for the replacement reaction. After about 10 min, copper accessibility decreases leading to a slower replacement reaction speed. Figure 5 compares SEM photomicrographs of copper and copper–silver nanowires obtained after 1 min of the galvanic replacement reaction corresponding to the composition Cu97Ag3 at different scales. The great difference between those pictures is the presence of silver nuclei on the whole surface just after the beginning of the galvanic replacement reaction [Figs. 5(b) and 5(d)]. The great quantity of nuclei on the entire surface may favor the formation of a uniform metallic silver shell. It is also possible to observe some nanowires shorter than 5 µm. This corresponds to broken wires that appear during their manipulation and especially during the membrane dissolution.
Kinetics of the galvanic replacement reaction in aqueous media (atomic percentage of silver is determined using EDXS).
SEM photomicrographs. (a) Cu nanowires, and (b) Cu97–Ag3 nanowires (1 min of the replacement reaction).
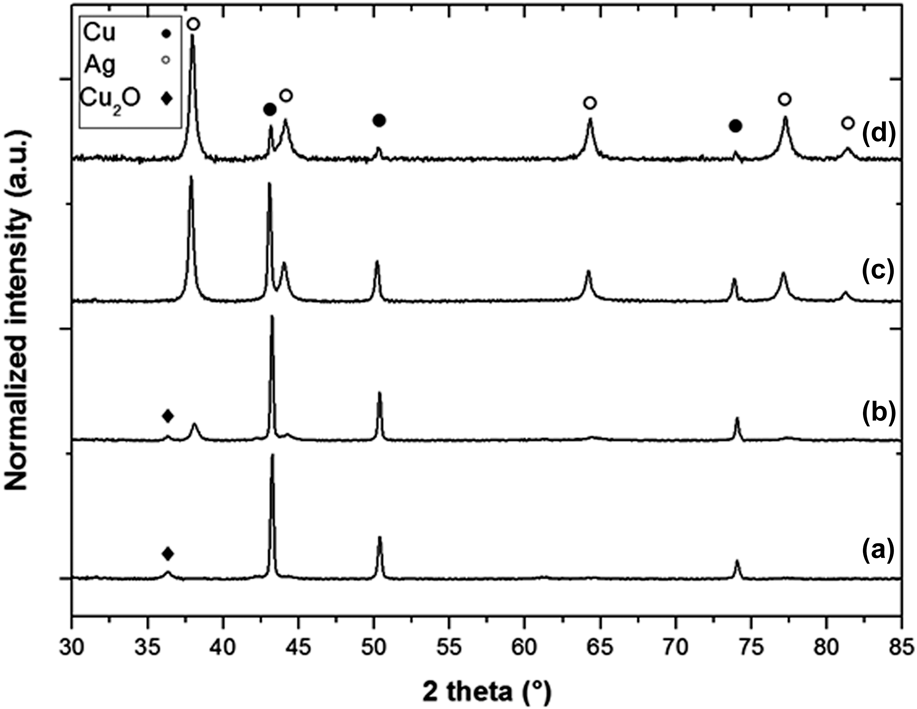
XRD diffractograms of nanowires were recorded after various times of the galvanic replacement reaction. Some of them (Cu, Cu90Ag10, Cu50Ag50, Cu5Ag95 corresponding respectively to 0, 2.5, 4, and 90 min of galvanic replacement reaction) are reported in Fig. 6.
XRD diffractograms of copper–silver nanowires (a) Cu, (b) Cu90–Ag10 (2.5 min of replacement reaction), (c) Cu50–Ag50 (4 min of the replacement reaction) and (d) Cu5–Ag95 (90 min of the replacement reaction).
The XRD diffractogram of copper nanowires [Fig. 6(a)] presents diffraction peaks at 43.26°; 50.34°; and 74.05° which can be attributed to metallic copper in a face-centered cubic system (JCPDS 004-0836). The XRD diffactrograms of copper–silver nanowires (b–d) exhibit diffraction peaks of both metallic copper (JCPDS 004-0836) and silver (38.12°; 44.28°; 64.43°; 77.47°; and 81.54°; JCPDS 004-0783). The small diffraction peaks around 36.42° in the diffractograms (a) and (b) can be attributed to the copper oxide Cu2O (JCPDS 05-0667). In accordance with the literature,Reference Xu, Luo, Zhuang, Li and Zhang57,Reference Chen, Mochizuki, Maitani and Wada58 the covering of the copper nanowires by silver seems to prevent them from oxidation since no cuprite is observed on samples (c) and (d) (corresponding to the highest atomic silver percentages).
The larger the quantity of silver is, the more the intensity of diffraction peaks of copper decreases and the intensity of diffraction peaks of silver increases. In the copper–silver nanowire diffractograms (b–d), two distinct crystallographic phases can be clearly identified indicating that no solid solution was created. These results indicate that both metals are separated but do not necessarily have a core–shell structure. The final Ag atomic percentage observed in Fig. 4 approaches 100%, which means that the silver shell is either not totally covering or porous. To prove the core–shell structure of the copper–silver nanowires, further experimentations need to be performed such as transmission electron microscopy studies.
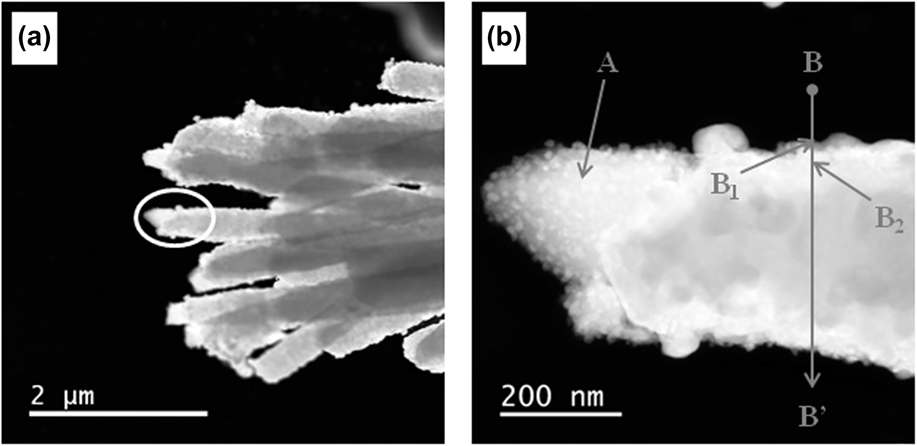
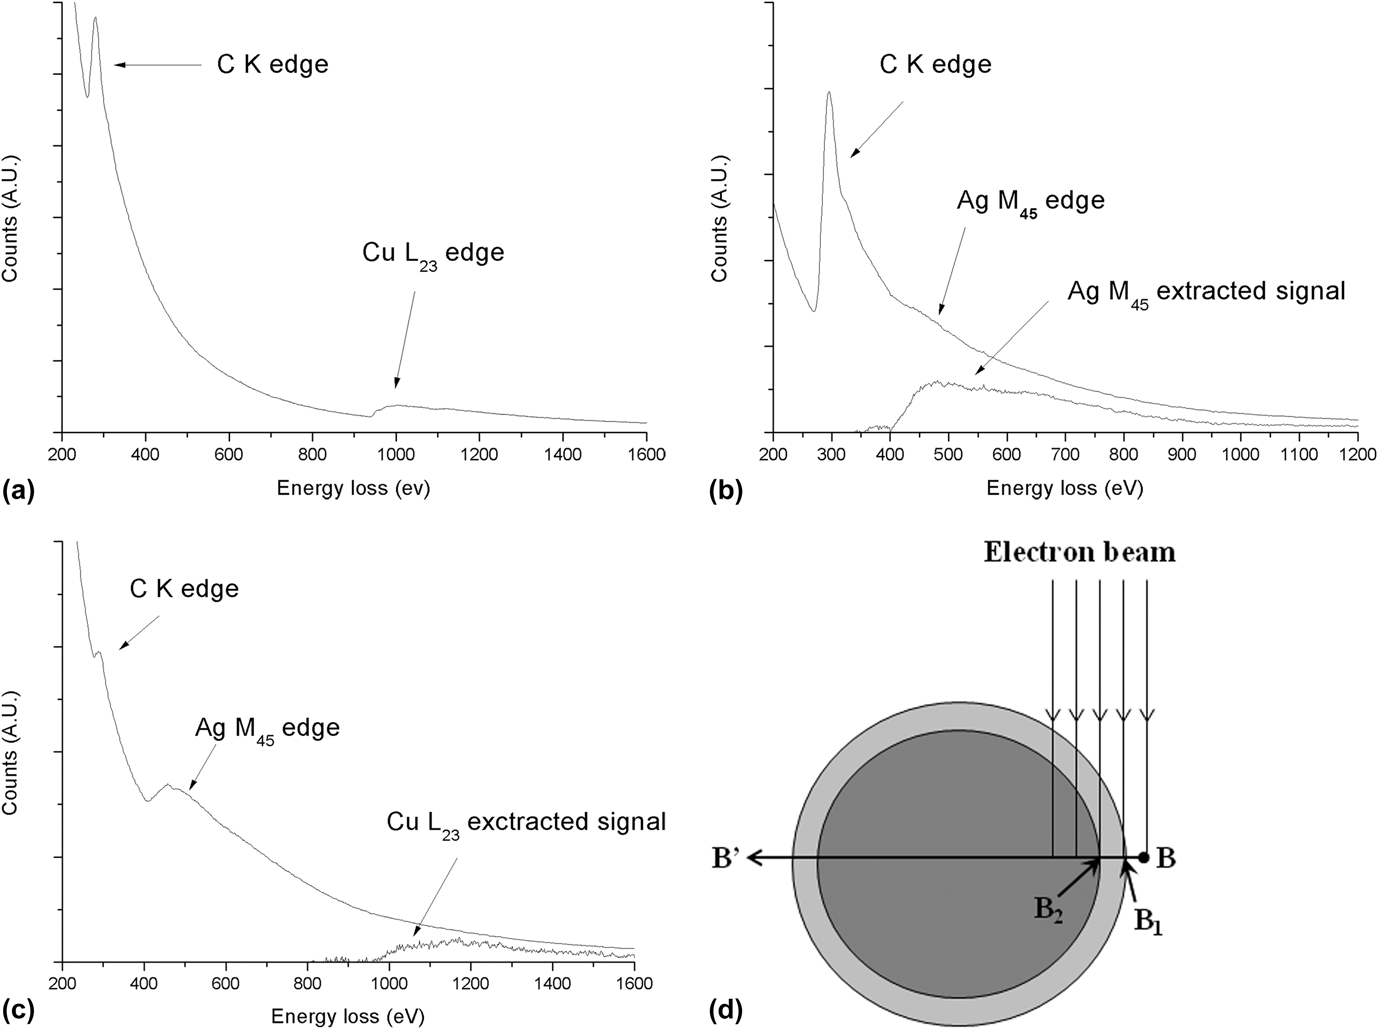
Figure 7(a) shows STEM photomicrographs of the Cu90–Ag10 nanowire sample synthesized in aqueous solution. Figure 7(b) exhibits the extremity of one nanowire at highest magnification. Two different textures can clearly be observed between the left (point A area) and right parts (point B area) of the nanowire. This may result from a breaking of the nanowires during their manipulation. To determine the composition of these different zones, EELS analyses were performed. The EELS analysis on point A corresponds to copper only [Fig. 8(a)]. A spectrum-line analysis was also performed along the B–B′ axe. This line analysis consisted of 100 spectra recorded at each nanometer for a total length of 100 nm from B. Among all these spectra, EELS analyses from points B 1 and B 2 were presented in Figs. 8(b) and 8(c). These specific points correspond to changes in the nanowire composition [see Fig. 8(d)].
(a) STEM photomicrograph of Cu90–Ag10 nanowires (2.5 min of the replacement reaction) synthesized in aqueous solutions, and (b) a zoom of the encircled area (A, B 1, and B 2: EELS analysis points for Fig. 8).
EELS spectra. (a) Spectrum corresponding to point A (Fig. 7), (b) spectrum corresponding to point B 1 (Fig. 7) and (c) spectrum corresponding to point B 2 (Fig. 7). B 1 and B 2 are two points on the BB′ axis. Extracted elemental signals (power law method AE −r) are also presented in the case of weak signals. (d) Scheme of a cross-section of a copper–silver core–shell nanowire with the representation of the EELS electron beam at different points of a line analysis.
As expected, neither silver nor copper signals were observed from B to B 1. From point B 1 to B 2, only the silver 3d ionization edge (367 eV) is detected [Fig. 8(b)]. This indicates the presence of a pure silver layer. From point B 2, the copper signal appears [copper 2p ionization edge (931 eV), Fig. 8(c)] simultaneously with the silver 3d signal. The presence of copper beyond point B 2 indicates the presence of copper in the core of the nanowire as already seen from point A. Consequently, these EELS results put in evidence that an external shell made out of silver covers a core made of copper. Moreover, this result obtained with a weak Ag/Cu ratio (Cu90–Ag10) exhibits the formation of a silver shell even with a low silver quantity.
The diameter of the nanowire (d 1) measured along the line BB′ (Fig. 7) was found to be 330 nm. The distance between B 1 and B 2 corresponding to the silver layer thickness (thAg) was found to be around 18 nm leading to a copper diameter d 2 equal to d 1 − 2thAg = 294 nm. These diameters (d 1 and d 2) allow obtaining copper and silver mole numbers [of the cross section schematized in Fig. 8(d)] using Eqs. (3) and (4).
 $${S_{{\rm{Cu}}}} = \pi {\left( {{{{d_2}} \over 2}} \right)^2} \to {m_{{\rm{Cu}}}} = {\rho _{{\rm{Cu}}}}\ell {S_{{\rm{Cu}}}} \to {n_{{\rm{Cu}}}} = {{{\rho _{{\rm{Cu}}}}\ell \pi \mathop {{d_{\rm{2}}}}\nolimits^2 } \over {4{M_{{\rm{Cu}}}}}}\quad ,$$
 $${S_{{\rm{Ag}}}} = {S_{\rm{t}}} - {S_{{\rm{Cu}}}} = \pi {\left( {{{{d_1}} \over 2}} \right)^2} - \pi {\left( {{{{d_2}} \over 2}} \right)^2} \to {m_{{\rm{Ag}}}} <$$><$$>= {\rho _{{\rm{Ag}}}}\ell {S_{{\rm{Ag}}}} \to {n_{{\rm{Ag}}}} = {{{\rho _{{\rm{Ag}}}}\ell \pi \left( {\mathop {{d_{\rm{1}}}}\nolimits^2 - \mathop {{d_{\rm{2}}}}\nolimits^2 } \right)} \over {4{M_{{\rm{Ag}}}}}}\quad ,$$
with d 1 and d 2 as the diameters of the nanowire and of the copper core (cm), respectively; S Ag, S Cu, and S t are the silver surface, the copper surface and the total surface for a cross section (cm2), respectively; m Ag and m Cu are the mass of silver and copper (g), respectively; ρAg and ρCu are the density of silver and copper (i.e., 10.50 and 8.96 g/cm3), respectively; l the length of the nanowire (cm). n Ag and n Cu arethe mole number of silver and copper (mol), respectively; M Ag and M Cu are the molecular weight of silver and copper (i.e., 107.9 and 63.5 g/mol), respectively.
Finally, the silver atomic percentage [Eq. (5)] can be calculated by combining Eqs. (3) and (4) as follows:
 $$\eqalign{ & {\rm{\% }}\;{\rm{at}}{\rm{.}}\;{\rm{Ag}} = {{{n_{{\rm{Ag}}}}} \over {{n_{{\rm{Ag}}}} + {n_{{\rm{Cu}}}}}} \times {\rm{100}} \cr & {\rm{\% }}\;{\rm{at}}{\rm{.}}\;{\rm{Ag}} = {{{{{\rho _{{\rm{Ag}}}}\ell \pi \left( {\mathop {{d_1}}\nolimits^2 - \mathop {{d_{\rm{2}}}}\nolimits^2 } \right)} \over {{\rm{4}}{M_{{\rm{Ag}}}}}}} \over {{{{\rho _{{\rm{Ag}}}}\ell \pi \left( {\mathop {{d_{\rm{1}}}}\nolimits^2 - \mathop {{d_{\rm{2}}}}\nolimits^2 } \right)} \over {{\rm{4}}{M_{{\rm{Ag}}}}}} + {{{\rho _{{\rm{Cu}}}}\ell {\rm{\pi }}\mathop {{d_{\rm{2}}}}\nolimits^2 } \over {{\rm{4}}{M_{{\rm{Cu}}}}}}}} \times {\rm{100}} \cr & {\rm{\% }}\;{\rm{at}}{\rm{.}}\;{\rm{Ag}} = {{{{{\rho _{{\rm{Ag}}}}\left( {\mathop {{d_{\rm{1}}}}\nolimits^2 - \mathop {{d_{\rm{2}}}}\nolimits^2 } \right)} \over {{M_{{\rm{Ag}}}}}}} \over {{{{\rho _{{\rm{Ag}}}}\left( {\mathop {{d_{\rm{1}}}}\nolimits^2 - \mathop {{d_{\rm{2}}}}\nolimits^2 } \right)} \over {{M_{{\rm{Ag}}}}}} + {{{\rho _{{\rm{Cu}}}}\mathop {{d_{\rm{2}}}}\nolimits^2 } \over {{M_{{\rm{Cu}}}}}}}} \times {\rm{100}}\quad {\rm{.}} \cr}$$
For the wire presented in Fig. 7(b), the atomic percentage of silver calculated with Eq. (5) was found to be 15% which is in relatively good agreement with the percentage measured using EDXS (10 ± 4%).
2. Silver shell elaboration in ionic liquid
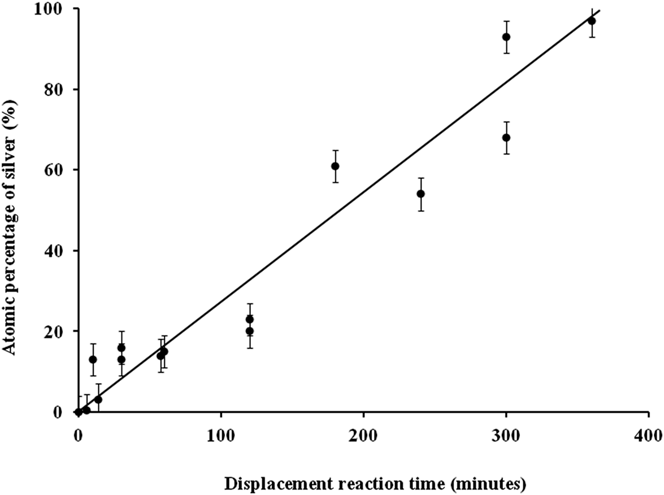
As with the aqueous solution, the evolution of the Ag atomic percentage during the galvanic replacement reaction [Eq. (2)] was studied. The results are shown in Fig. 9.
Kinetics of the galvanic replacement reaction in ionic liquid media (atomic percentage of silver is determinate using EDXS).
Unlike the case of the aqueous solution (Fig. 4), the galvanic replacement kinetics is very slow. This phenomenon can be partially explained by the viscosity of the ionic liquid that decreases the mobility of the Ag(I) ions or by the formation of a less porous silver shell than in the case of aqueous solution. So, it is interesting to see if the silver shell grows homogeneously as with the aqueous solvent.
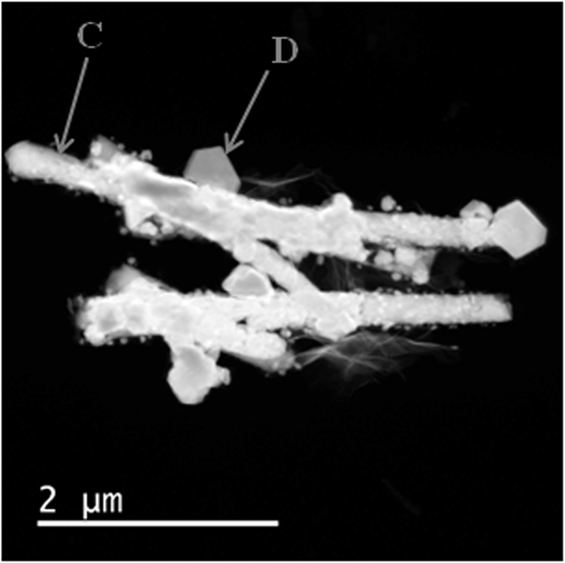
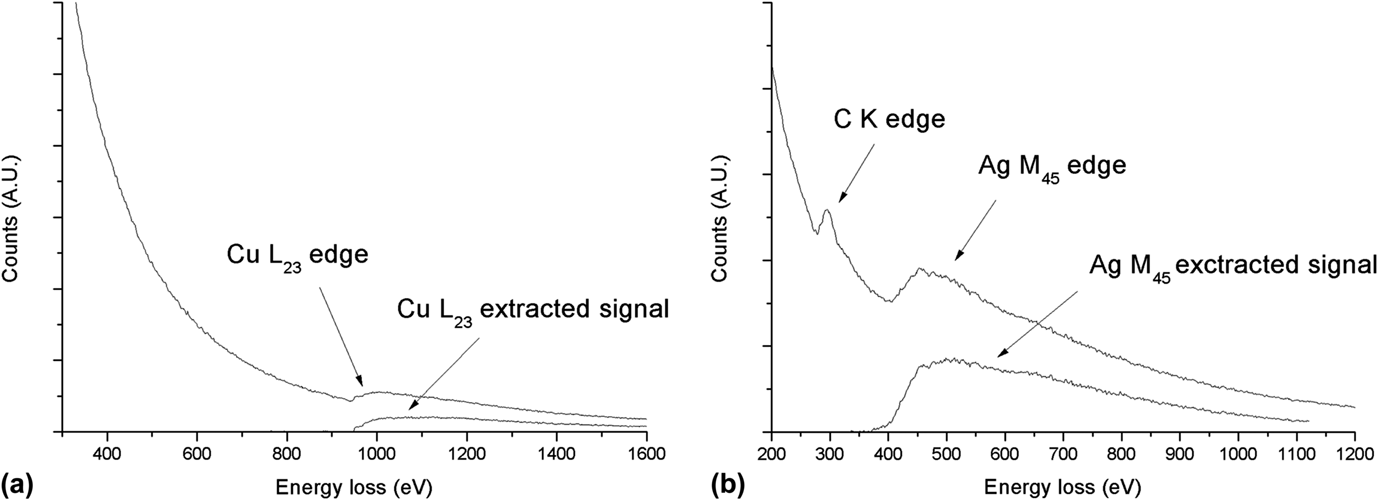
Figure 10 shows a STEM photomicrograph of copper–silver nanowires with the same composition as Fig. 7 (Cu90–Ag10) but corresponding this time to 30 min of the replacement reaction. In this case, the structure of the copper–silver nanowires synthesized in the ionic liquid solution used is significantly different from the one obtained in the aqueous media. This difference cannot be explained by a difference of viscosity between the two media because Abbott et al.Reference Abbott, Nandhra, Postlethwaite, Smith and Ryder56 have obtained a uniform Ag coverage with another ionic liquid. This could be an effect of the nature of the ionic liquid. Very marked crystals are observed at the surface of the nanowires in Fig. 10. To determine their chemical composition, EELS analyses were performed. Numerous analyses were done on the nanowires and two characteristic analysis points are shown in Fig. 11: point C at the surface of a nanowire and point D on a crystal. On the EELS spectrum which corresponds to point C the single ionization edge of copper [Fig. 11(a)] is detected while at point D, only the signal of silver is found [Fig. 11(b)]. For the studied composition (Cu90–Ag10), no area with simultaneous silver and copper signals is found contrary to the case of the galvanic replacement reaction in aqueous solution. This difference of covering should be interesting for a future study of antibacterial activity. Indeed, to obtain a good synergy of antibacterial activity of copper (against S. aureus) and silver (against E. coli), it is important for both copper and silver to be accessible. It is the case in the composition (Cu90–Ag10) studied here and obtained in the two media (aqueous and ionic). In the first case, even if a core–shell structure is observed (Fig. 7), the kinetic curve indicates that the silver layer is not dense because the galvanic replacement reaction continues beyond the Cu90–Ag10 composition (Fig. 4) by diffusion through porosities. In the second case, both copper and silver are directly accessible (see Fig. 10).
STEM photomicrograph of Cu–Ag nanowires after 30 min of the replacement reaction (Cu90–Ag10) (C and D: EELS analysis points for Fig. 11).
V. CONCLUSION
Copper–silver nanowires were synthesized using a template method followed by a galvanic replacement reaction. The first stage was conducted in copper aqueous solution using a polycarbonate membrane. After membrane dissolution, copper nanowires were immersed in two different silver solutions (aqueous and ionic solvent). The galvanic replacement reaction was very different according to the medium used. With aqueous solvent, the kinetics is very fast and a homogeneous silver covering surrounding the copper is obtained leading to a core–shell structure. With ionic liquid, the kinetics is slower and no core–shell structure is observed but silver crystals appear at the surface of the copper nanowires for the composition studied (Cu90–Ag10).
Further studies will be performed to test the antibacterial efficiency of these Cu–Ag nanowires to study their potential applications (insertion in band aids, cotton textiles, etc.).
ACKNOWLEDGMENTS
This study received grant support from the Conseil Régional de la Marne. We thank the URCA PICT IBiSA Imaging Center for its technical support and Sylvie Ricord for linguistic assistance.