Communication between native and nonnative speakers is widespread, particularly in countries such as the United States that have significant numbers of immigrants. This imposes challenges for both speakers and listeners in various contexts, including college classrooms. In a CGS/GRE survey, there were over 800,000 international graduate students entering US colleges for studies in 2012 (http://www.cgsnet.org/ckfinder/userfiles/files/GEDReport_2012.pdf). At Stony Brook University, for example, 60% of the new graduate students during the 2013/2014 academic year were international students, and over half of these were Chinese students. These international students are often assigned to be instructors or teaching assistants in US colleges, even though in many cases their level of spoken English is far from native. American undergraduate students frequently complain about not being able to understand their speech well (Borjas, Reference Borjas2000; Finder, Reference Finder2005; Fitch & Morgan, Reference Fitch and Morgan2003; Zhou, Reference Zhou2014). Studies suggest that these nonnative English speakers are usually perceived as poorer communicators than native speakers (Grossman, Reference Grossman2011; Hosoda, Stone-Romero, & Walter, Reference Hosoda, Stone-Romero and Walter2007). Given this problematic situation, to enhance successful communication between international teaching assistants (ITAs) and American undergraduate students, there are two logical alternatives: improve the speakers’ accent/pronunciation in order for them to be better understood, or improve the listeners’ understanding without much change on the speakers’ side. In the latter case, for example, one could focus on the use of visual cues during accented speech perception. If lip movements can substantially enhance the understanding of accented speech, they have the potential to provide an important way to enhance communication between accented speakers and native listeners (Banks, Gowen, Munro, & Adank, Reference Banks, Gowen, Munro and Adank2015a; Janse & Adank, Reference Janse and Adank2012). Specifically, one potential solution could be to encourage students to sit close to the speakers if they are having trouble understanding the speech. Although this seems intuitive, there is actually no direct empirical evidence to suggest that this would improve listeners’ ability to understand accented speech. The current study focuses on this practical issue of communication between Chinese instructors and American undergraduate students in college classrooms: we examine the potential role of visual cues in recognizing accented words.
Lipreading and Difficult Speech
Many prior studies have examined the role of visual information in processing difficult speech, though almost none of this research has investigated accented speech. It has been known since Sumby and Pollack (Reference Sumby and Pollack1954) that access to lipreading information improves perception of speech in noise, and the benefits of viewing articulatory movements in a noisy environment have been confirmed in later studies (e.g., Erber, Reference Erber1969, Reference Erber1971; MacLeod & Summerfield, Reference MacLeod and Summerfield1987; Ross, Saint-Amour, Leavitt, Javitt, & Foxe, Reference Ross, Saint-Amour, Leavitt, Javitt and Foxe2007). Moreover, visual information has been shown to improve perception of noise-vocoded speech, which has been studied due to its similarity to the signal produced by a cochlear implant. Several of these studies reported that lip-movement information can enhance perceptual learning of noise-vocoded speech (Bernstein, Auer, Jiang, & Eberhardt, Reference Bernstein, Auer, Jiang and Eberhardt2013; Kawase et al., Reference Kawase, Sakamoto, Hori, Maki, Suzuki and Kobayashi2009; Pilling & Thomas, Reference Pilling and Thomas2011; Wayne & Johnsrude, Reference Wayne and Johnsrude2012). In addition, lipreading facilitates the comprehension of another type of challenging speech: time-compressed speech (Adank & Devlin, Reference Adank and Devlin2010; Banai & Lavner, Reference Banai and Lavner2012). Collectively, there is thus substantial evidence that visual speech cues can help listeners to understand suboptimal speech input. In contrast, relatively little work has examined the possible use of visual cues in nonnative speech perception. We will review the relevant research in the following sections.
LIPREADING AND NONNATIVE PHONEMES
Wang, Behne, and Jiang (Reference Wang, Behne and Jiang2008) presented native Mandarin speakers with syllables that contained English fricatives in audio-visual (AV), audio-only (AO), and visual-only (VO) conditions, and found that visual cues facilitated nonnative fricative identification. Moreover, Chinese participants who had resided for a short time in Canada showed more reliance on visual information than those who had been there longer, indicating an effect of linguistic experience on nonnative phoneme identification. These results converge with the finding that the visual contribution to nonnative fricative identification is modulated by the listener’s first language (Wang, Behne, & Jiang, Reference Wang, Behne and Jiang2009). Hazan, Kim, and Chen (Reference Hazan, Kim and Chen2010) had participants identify /ba/, /da/, and /ga/ produced by native or nonnative speakers in AV, AO, and VO conditions, and found that listeners gave greater weight to visual information when listening to nonnative speech than when listening to native speech. Hazan et al. (Reference Hazan, Sennema, Faulkner, Ortega-Llebaria, Iba and Chung2006) asked English learners to identify visually salient contrasts (e.g., labial/labiodental consonant contrasts) and visually less salient contrasts (e.g., /l/-/ɹ/). They found that both Japanese and Spanish learners of English performed better in AV than in AO conditions on visually salient contrasts, but neither showed an audiovisual benefit for /l/-/ɹ/ contrasts. Thus, the visual salience of nonnative sounds played an important role in the use of visual information. In addition to these studies that focused on the use of visual cues for consonants, Navarra and Soto-Faraco (Reference Navarra and Soto-Faraco2007) demonstrated that visual cues facilitated the recognition of vowel contrasts in nonnative speech. In their study, Spanish-dominant bilinguals who spoke Catalan as a second language failed to distinguish the Catalan sounds /ɛ/ and /e/ in an AO condition, but could successfully do so using additional visual information. However, Kawase, Hannah, and Wang (Reference Kawase, Hannah and Wang2014) suggested that visual cues are not always helpful in nonnative phoneme recognition. They presented native English listeners with three English phonemic consonants produced by Japanese native speakers, and found that the presence of visual information could positively or negatively affect the recognition of phonemes. For instance, an inaccurate articulation configuration of /ɹ/ by Japanese speakers provided native listeners with misleading information in the identification task, lowering recognition. Thus, although the literature shows that in general visual information helps to understand nonnative phonemes, sometimes misleading information from visual cues can be detrimental, as shown by Kawase et al. (Reference Kawase, Hannah and Wang2014). Note that the approach taken in these studies is to contrast the presence versus absence of visual information, rather than to manipulate the degree to which visual cues are available.
LIPREADING AND ACCENTED SPEECH
The relationship between lipreading and accented speech has not been extensively studied yet. Yi, Phelps, Smiljanic, and Chandrasekaran (Reference Yi, Phelps, Smiljanic and Chandrasekaran2013) asked participants to transcribe sentences in native- or Korean-accented speech presented in noise, in an AO or an AV condition. They found that lip movements facilitated speech recognition, but the visual enhancement was greater for native speech than for the Korean-accented speech. In addition, Korean speakers were rated as more accented in the AV than in the AO condition, whereas native speakers were rated as producing less accented speech in the AV than in the AO conditions (see Rubin, Reference Rubin1992; Zheng & Samuel, Reference Zheng and Samuel2017, for related findings).
Other studies have reported a positive role for visual cues, though in general the effects have been modest. Barros (Reference Barros2010) found that access to visual cues enhanced the intelligibility of Brazilian-accented English slightly and nonsignificantly for native English listeners. Banks et al. (Reference Banks, Gowen, Munro and Adank2015a) presented Japanese-accented speech in noise to native English listeners, and found that recognition accuracy was significantly better in an AV condition than in an AO condition. However, they found that visual information did not facilitate the perceptual learning of accented speech: participants improved at the same rate when presented with accented speech in AO versus AV conditions. To reconcile this finding with prior studies showing that visual cues enhanced the perceptual learning of noise-vocoded speech, Banks et al. (Reference Banks, Gowen, Munro and Adank2015a) suggested that the results depend on the characteristics of the speech signal: “variation in noise-vocoded speech stems from degrading the acoustical composition of the entire speech signal, whereas accented speech varies in terms of its phonemic patterns, is acoustically intact and only affects certain speech sounds” (p. 2). In a related study, Janse and Adank (Reference Janse and Adank2012) showed that native Dutch older adults showed marginally higher accuracy in understanding artificially accented Dutch in an AV condition than in an AO condition, with no difference in reaction times. They found that the initial adaptation to accented speech was faster in the AV condition compared to the AO condition, but the overall improvement ultimately was the same for the two conditions. Collectively, these studies suggest that visual cues can aid perception but not perceptual learning of accented speech (Adank & Janse, Reference Adank and Janse2010; Banks, Gowen, Munro, & Adank, Reference Banks, Gowen, Munro and Adank2015a, Reference Banks, Gowen, Munro and Adank2015b).
The Current Study
As the preceding review indicates, prior research has provided some evidence that lipreading can be helpful in processing difficult speech, such as speech-in-noise, vocoded speech, and time-compressed speech. A few studies examining the use of visual cues in recognizing nonnative phonemes have provided some support for a positive contribution of visual cues (although the influence can also be negative if visual cues are misleading; Kawase et al., Reference Kawase, Hannah and Wang2014). The results for lipreading of accented speech are mixed: there is some evidence that visual cues can be helpful in comprehension (Banks et al., Reference Banks, Gowen, Munro and Adank2015a), but sometimes the facilitation is marginal and modest/insignificant (Barros, Reference Barros2010; Janse & Adank, Reference Janse and Adank2012). The utility of visual cues in accommodating to accented speech is quite limited (Banks et al., Reference Banks, Gowen, Munro and Adank2015a; Janse & Adank, Reference Janse and Adank2012). The purpose of the current study is to determine whether varying the quality of visual cues affects accented word recognition across a range of conditions that are potentially relevant in the ITA–native listener situation (e.g., varying language materials, visual quality, and speakers).
The present study diverges from prior work methodologically: rather than testing the importance of visual cues by completely eliminating these cues, we provide observers with different levels of visual cue availability and measure whether this affects how well participants recognize words. Specifically, we manipulate the quality of visual speech cues by varying the apparent distance between the speaker and the listener. The results of this quantitative variation in visual cue availability can be compared to the effect of the all-or-none type of manipulation (AV vs. AO) used in prior work (Banks et al., Reference Banks, Gowen, Munro and Adank2015a; Hazan et al., Reference Hazan, Kim and Chen2010; Janse & Adank, Reference Janse and Adank2012; Kawase et al., Reference Kawase, Hannah and Wang2014; Navarro & Soto-Faraco, Reference Navarra and Soto-Faraco2007; Wang et al., Reference Wang, Behne and Jiang2008; Yi et al., Reference Yi, Phelps, Smiljanic and Chandrasekaran2013). Our methodology offers a potentially practical approach to the real-world issue we have described: does it make sense to advise American undergraduate students to sit closer to their nonnative instructors in order to facilitate their understanding of their instructors’ accented speech? We created a lab situation to simulate classroom conditions in which the speaker is seen from close up, where the mouth is clearly visible, versus conditions in which the speaker is further away, rendering mouth information less clear.
At a theoretical level, the current study provides a test of the extent to which visual information aids word recognition broadly versus the extent to which it affects more specific aspects of decoding. On one hand, given the evidence that visual cues can help to decode difficult speech, to the extent that accented speech is considered to be a type of difficult speech, one might assume that visual cues should also help with accented speech. On the other hand, accented speech is difficult for different reasons: accented speech is acoustically intact but has certain phonetic variations that are not present in native speech. Thus, the benefit of visual cues found for degraded speech may not generalize to accented speech (Banks et al., Reference Banks, Gowen, Munro and Adank2015a). The current study thus can clarify whether visual cues are useful for specific reasons, or for more general ones.
In constructing our study, we made two fundamental design decisions. First, we chose to focus on Mandarin Chinese-accented English because a large number of ITAs at our university, as at many others, are from Mandarin-speaking places in China (Davis, Reference Davis1988; Rubin Reference Rubin1992). Second, we chose to test how well listeners could understand Mandarin Chinese-accented words under conditions that did not allow listeners to use sentence-level context to guess the words. This choice was grounded in our desire to know how much the visual information actually improves word recognition per se. In sentence-level tests, it is difficult to separate how well listeners are actually decoding the words from how well they can use the sentence context to guess word identity. It has been known for over a half century (e.g., Miller & Isard, Reference Miller and Isard1963) that accuracy of word report can be heavily affected by these additional cues. Therefore, we had our participants make lexical decision judgments about Mandarin Chinese-accented English words and pseudowords. The required response on each trial was simply to indicate whether the item is a real English word or not. In the literature on word recognition, this is by far the most widely used task to measure word-level intelligibility. An additional virtue of this task, in the current study, is that the responses to the pseudowords can provide insights into how participants process unfamiliar items. Many courses in the STEM fields require students to deal with new terms, such as “arcsine,” which are similar to the pseudowords included in the lexical decision test.
As noted above, the primary aim of the current work was to test the influence of distance. To operationalize the distance manipulation, we videotaped two native Mandarin Chinese speakers producing accented English words and pseudowords, and presented two versions of the videos to our participants: “far” and “close.” The far version items were recorded with the camera about 4 m away from the speakers. For the close version, we took the original video-recordings and zoomed in on the speaker’s head, cropping the rest of the original frame. This approach ensured that the far and close stimuli had exactly the same sound quality and lip movements (at the cost of some subtle cues that vary with actually approaching an object).
In sum, the current study examines the role of visual quality in accented word recognition. In addition, to examine how the effect of visual quality might change over time, especially for listeners who are exposed to Chinese-accented instructors over the course of a semester, we asked participants who were initially tested at the beginning of a semester to return for retesting at the end of the semester. All participants filled out a questionnaire that asked for information about their language background. The questionnaire included questions about the person’s prior experience with nonnative instructors.
Method
Participants
We recruited 152 Stony Brook undergraduate students within the first 6 weeks of the semester, all of whom had self-reported normal vision and hearing. Nine participants were excluded because they were not native English speakers (as reflected in the questionnaire), and 1 participant’s data were not used due to headphone problems. All participants performed well above chance level on the lexical decision task (range: 67% to 87%), and as such no participants were excluded based on poor performance. Thus, usable data were obtained from 142 participants (114 females, 28 males). All participants were native English speakers and were 18 years of age or older. The mean age was 20.4 (SD=2.76), with a range of 18 to 44 years old.Footnote 1 None of the participants reported knowing either of the two speakers presented in the experiment. A subset of the participants (41 females, 16 males; mean age 21.3, SD=3.7, range of 19 to 44 years old) agreed to come back for a second session a few months later. The results for the second session will be discussed after those from the first session. Participants were compensated with $10 or partial course credit for each session of their participation. The study was approved by the Stony Brook University Institutional Review Board.
Materials
Sixty English words were selected, ranging between one and four syllables in length. These words included common terms used in the STEM field (e.g., axis) and regular English words (e.g., fight). They were all relatively high-frequency words (frequency for each token is shown in Appendix A, retrieved from http://subtlexus.lexique.org/moteur2/index.php). We then made 60 nonwords that matched the words in structure and number of syllables (e.g., “advertise” was used to generate the nonword “adverbise”; see Appendix A). Nonwords were made by changing one consonant in a word somewhere in the first, second, or third syllable, making it easy for our two speakers to know the desired pronunciation from the orthography.
Two native Mandarin Chinese speakers recorded the stimuli during their first semester in the United States. Both were first-year PhD students at Stony Brook University. One speaker had a relatively strong accent (female, 22 years old), and the other speaker had a weaker accent (male, 26 years old). The female speaker was born in Hebei, China, and started learning English at the age of 9. The male speaker was born in Tianjin, China, and started learning English at the age of 10. The native language for both speakers was Mandarin. The subjective impression of their accents was reflected in their pronunciation scores on the Versant Test (https://www.versanttests.com/) of 49 and 59 (out of 80), respectively. The Versant test is an automated speaking test; its reliability and validity have been verified in the literature (Chun, Reference Chun2008; Downey, Farhady, Present-Thomas, Suzuki, & Van Moere, Reference Downey, Farhady, Present-Thomas, Suzuki and Van Moere2008). The pronunciation section of the test focuses on speakers’ ability to produce vowels, consonants, and stress in a nativelike manner. To foreshadow, word recognition in the current study was better for stimuli produced by the male speaker, consistent with both the Versant scores and subjective impressions of the two speakers. In the following text, we will refer to the first speaker as “female” and the second as “male,” without any implication that these individuals provide any information about female versus male speakers in general.
The speakers were instructed to stand in front of a blackboard, and to read words and nonwords from a laptop that was placed next to a VIXIA HFG20 Canon HD camcorder at a distance of about 4 m. Thus, in the video it looked as if the speaker was looking directly into the camera. Speakers were asked to read the stimuli in a natural and clear way, with a neutral facial expression. The speakers were asked to rerecord an item if it was not good in any way (e.g., disfluency, cough, frowns, smiling, obvious body movements, background noise, or not looking into the camera). Each word (e.g., advertise) was followed by a nonword made from that word (e.g., adverbise). This procedure made it easy for the speakers to produce both words and nonwords. They were asked to produce all items with the same confidence level. During the videotaping process, the speakers wore a CVL lavalier microphone using a Shure BLX 14/CVL-H10 wireless system to ensure the quality of the audios. The microphone was placed close to the neck of each speaker.
We used VSDC video editing software to make two versions of each video. First, we split the video and audio and saved the audios as separate .wav files. Second, we applied a noise-reduction function in Goldwave editing software to minimize any background noise. Third, we normalized the amplitude of the audios, using Goldwave’s half dynamic range option, to match the overall volume across the two speakers. Fourth, we inserted the audio stream back into the videos. Fifth, we cropped the borders of the original videos to make two versions: in one version, the distance from the camera to the speaker remained relatively far, whereas in the second version we zoomed in on the speaker’s head, making the distance from the camera to the speaker seem relatively close. Sixth and finally, we split the long videos into short clips, and each short clip was saved as an individual video, starting right before the speaker opened his/her mouth and ending when the mouth was closed.Footnote 2 As noted above, while this method does not capture every cue to distance, it provides a good approximation to the desired change in apparent distance while assuring that the exact same lip movements were present in the two versions of each video, with the same high-quality audio stream. The final versions were all 720×480 pixels per frame, with 44,100-Hz frequency and 29.970 fps. In total, there were 480 videos: 60 words and 60 nonwords, each presented at two distances by two speakers. See Appendix B for examples of visual images of the two speakers at the two distances.
Procedure
We tested up to three participants at the same time. Participants first completed a questionnaire regarding their present and past experiences with Chinese speakers (e.g., professors, instructors, ITAs, etc.) in classroom settings; see the questionnaire in Appendix C. For simplicity, we refer to these speakers as “Chinese TAs” in the following text. After completing the questionnaire, participants were tested in a sound-attenuated booth. They watched videos of speakers producing speech on a standard 17-inch Dell computer monitor (60 Hertz refresh rate, 32-bit color quality, 1280×1024 pixels resolution) about 60 cm from the participants. The audio was presented through high-quality SONY MDR-V900 headphones, at a fixed, comfortable level for all participants. The participants’ task was to determine whether a given utterance was a word or a nonword. They were asked to do the task as accurately as they could without taking too much time, and to keep their eyes on the screen in front of them. Participants were monitored through a window, ensuring that they looked at the monitor throughout the whole experiment. For each video, participants had up to 3 s to respond, with a half second of silence between trials. They registered each word versus nonword response by pressing one of two labeled buttons on a button board. Response accuracy was used as the measurement of speech intelligibility.
Each participant watched a complete set of 60 word videos and 60 nonword videos. The experiment was run using a custom-designed C++ program. Within each set of 60 stimuli, 15 stimuli were presented for each of the four cases created by crossing the two distances with the two speakers. Four test versions were created by rotating distances and speakers across items, so that across participants each item was presented in all four combinations. The order of stimuli was pseudorandomized for each set of 1–3 participants tested together. The whole study took around 20 min.
Results
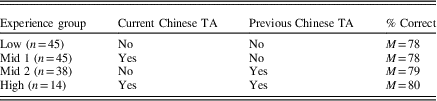
We calculated the average accuracy for each level of lexicality (word vs. nonword), distance (close vs. far), and speaker (male vs. female) for each participant. A four-way repeated measures analysis of variance was conducted with three within-subject factors: lexicality, distance, and speaker, and one between-subject factor: experience. Assignment to an experience level was based on a participant’s responses on the questionnaire. Participants were divided into four groups based on their linguistic experience with Chinese TAs, either in the past or currently (see Table 1). Although there was a very small (2%) trend toward better accuracy for those with more experience, there was no significant effect of Experience, F (1, 138)=0.90, p=.444, η2=.02. Experience did not interact significantly with any of the other factors.
Accuracy of four participant groups at Time 1

Note: TA, teaching assistant.
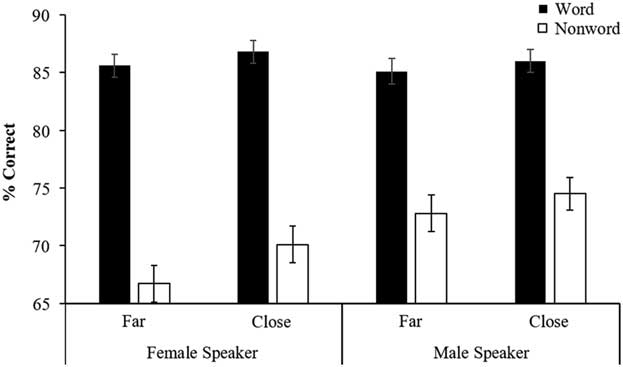
Figure 1 summarizes the effects of lexicality, distance, and speaker for the 142 participants tested at the beginning of the semester. As is usually the case, participants’ performance was significantly better on words than on nonwords, F (1, 138)=84.21, p<.001, η2=.38. The main effects of speaker and distance were also both significant, F (1, 138)=14.33, p<.001, η2=.09; F (1, 138)=10.27, p=.002, η2=.07, respectively. The main effect of distance indicates that providing better (closer) visual information can help listeners to recognize accented words and nonwords. The main effect of speaker is consistent with the higher Versant test score for the male speaker than for the female speaker.
Accuracy as a function of distance, lexicality, and speaker. Error bars represent the standard error of the mean.

The interaction between speaker and lexicality was significant, F (1, 138)=7.08, p=.009, η2=.05. Pairwise comparisons showed that the male speaker (who had a relatively weaker accent) was significantly more intelligible than the female speaker for nonwords (mean difference=5.2%, p<.001) but not for words (mean difference=0.6%, p=.591). The Distance × Lexicality interaction was not significant, F (1, 138)=1.38, p=.243, η2=.01. The Distance × Speaker interaction also was not significant, F (1, 138)=.49, p=.485, η2=.004. In both cases, there was a trend for distance to have a slightly stronger effect when conditions were more difficult, on nonwords (2.6% difference) rather than words (1.1%), and on the more-accented female’s speech (2.3%) than on the less-accented male stimuli (1.3%).
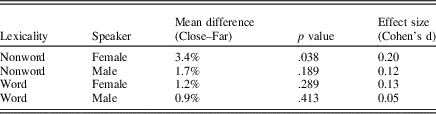
As Figure 1 shows, and as noted above, the effects of distance and speaker were primarily seen on the stimuli that were more difficult. This pattern can be summarized using Cohen’s measure of effect size (see Table 2). Participants did significantly better at the close distance than at the far distance only when the stimuli were nonwords and with the speaker who had a relatively heavier accent. When words were pronounced by the female speaker, or when nonwords were pronounced by the male speaker, distance had a smaller and nonsignificant effect. The effect size of distance was smallest when words were spoken by the male speaker. Similarly, participants did significantly better at understanding the male speaker than the female speaker when the stimuli were nonwords but not when the stimuli were words.
Effect sizes of distance (far vs. close) as a function of lexicality and speaker

Retest after 2 months
Of the 142 participants who were included in the first part of the study, 57 (50 females, 7 males) agreed to return to participate in the second part of the study. We compared the accuracy data (on the first session) for the 57 participants who returned and the 86 participants who did not return, and their performance did not differ, F (1, 140)=1.15, p=.286, η2=.008. This suggests that the participants who agreed to return did not constitute a biased sample. The average time between the first part and the second part of the study was 60 (SD=9.5) days. The participants were presented with the same set of videos at the two time points. We included a very long delay between the two tests (2 months) to minimize any effect of experience with the stimuli, but it is of course possible that there could be some benefit from the first experience.
When participants returned for the second session, we had them complete the questionnaires again. Because a categorization based only on classroom experience may not fully reflect people’s experiences with Chinese-accented English (e.g., they may have Chinese friends or family), we added one question to the questionnaire that asked participants to rate their general familiarity with Chinese-accented English on a scale of 1–10 (see Appendix C).
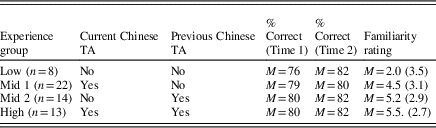
As before, we derived four levels of experience (Low, Mid 1, Mid 2, and High), using the information provided in the questionnaires during the second session (13 of the 57 participants modified their answers about their TA experience on the second questionnaire). Table 3 shows that the four levels of experience (shown in the second and third columns) pattern in the same way as the familiarity ratings shown in the last column. Participants who had neither a previous nor a current Chinese TA reported low familiarity with the accent (a mean of 2.0 on a 10-point scale), while those with both previous and current Chinese TAs reported higher familiarity (5.5 out of 10). This convergence suggests that our categorization is capturing the linguistic experience of the participants reasonably well.
Accuracy and familiarity rating of four participant groups at Time 1 and Time 2

Note: TA, teaching assistant.
Table 3 also shows the 57 participants’ overall lexical decision accuracy at the two time points. We had expected that hearing a Chinese TA for 2 months in a classroom setting would help listeners to understand Mandarin Chinese-accented English in the lab better. However, the results provide no support for this expectation. Participants who did not have semester-long Chinese TAs (i.e., the Low and Mid 2 groups, change of +3.5%) improved slightly more over time than those who had Chinese TAs (the Mid 1 and Low groups, change of +1.4%).
A five-way repeated measures analysis of variance was conducted including four within-subject factors (time, speaker, distance, and lexicality) and one between-subject factor (experience). As in the larger sample of performance on the initial test, the main effect of experience was not significant, F (3, 53)=.49, p=.692, η2=.027. Despite the absence of an effect of Chinese TA experience, participants’ overall performance significantly improved from Time 1 to Time 2, F (1, 53)=23.13, p<.001, η2=.30, presumably due to having taken part in the original test before.
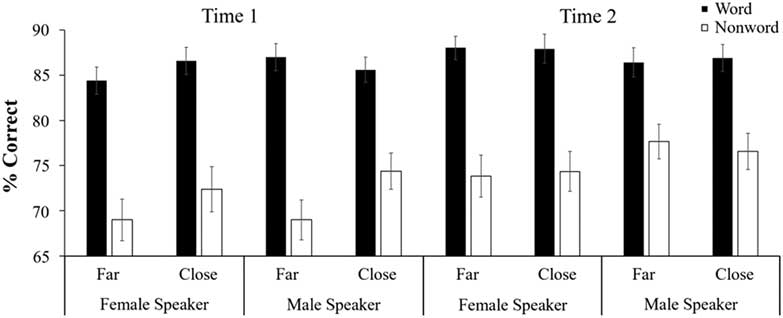
Given this overall improvement, we can examine whether the differential effects of distance across speaker that we saw initially hold over time. Recall that for the full sample, performance was better for close videos than for far ones, and for the male speaker than for the female speaker, with these differences only being reliable for the more difficult nonword stimuli. Figure 2a shows performance by the 57 participants as a function of distance, lexicality, and speaker during the initial test session, while Figure 2b provides the results when they returned 2 months later.
Accuracy as a function of distance, lexicality, and speaker at (a) Time 1 and (b) Time 2. Error bars represent the standard error of the mean.

Comparing Figure 2a to Figure 1, we see that the 57 participants produced a pattern similar to that of the original larger sample (of which they were a subset). The effect of distance was quite similar to that the full sample, with significantly better performance for the close than for the far distance (mean difference=2.1%, p=.009). There was one difference: in the subset, the close distance led to significantly better accuracy for nonwords with the male speaker (mean difference=5.4%, p=.002, d=0.31), whereas in the full sample the significant difference was for the female speaker. Overall, the patterns for the subset (Figure 2a) and for the full sample (Figure 1) were quite similar.
Comparing Figure 2a and 2b shows how the results for the 57 participants changed over time. The significant overall improvement in accuracy seems to have primarily been due to better performance on the stimuli that were originally most challenging. As a result, performance on far stimuli no longer was significantly worse than on close stimuli (mean difference <0.1%, p=.947), nor were items produced by the female speaker more difficult than those by the male speaker (mean difference=0.9%, p=.376).
Discussion
The present study extends previous work that showed that audiovisual presentation improves the comprehension of difficult speech (e.g., compressed speech or speech in noise) to the use of visual information in recognizing accented words. We noted above that this project was partially motivated by an existing and growing problem: many teaching assistants in the United States speak with foreign accents, which can cause problems in classroom communications. We studied Mandarin Chinese-accented English in the current project because the largest number of international teaching assistants (both at our university, and at research universities more generally) are from China. Our central question has been whether better visual cues can help listeners in perceiving accented speech.
We operationalized the effect of visual quality on accented word recognition as the apparent distance from the speaker. We had participants make lexical decisions while seeing and hearing Mandarin Chinese-accented speakers producing words or nonwords at two distances. In addition, we also examined whether any visual enhancement is modulated by factors such as the familiarity of the language stimuli (words vs. nonwords), speaker differences, or a listener’s experience with a particular accent. Our results confirm that having more access to visual lip movements facilitates accented speech recognition, especially under nonoptimal listening conditions. That is, the effect of distance was more reliable when the stimuli were nonwords (compared to words) and when the speaker had a relatively stronger accent.
Practically speaking, a number of our results bear on this real-world issue. Our findings suggest that having more access to the visual cues (loosely analogous to sitting up front in a classroom) can be helpful when listening to accented speech. The utility of doing so seems to be greatest for nonwords (analogous to speech materials that are not familiar), when the speaker’s accent is relatively strong. From the perspective of offering real-world solutions, these constraints are encouraging because these are the conditions that are most likely to be causing problems in the first place (e.g., a highly accented ITA using unfamiliar technical terms in the STEM field, such as “arcsine”). Somewhat less positively, our results are consistent with the view that cross-talker generalization is limited (i.e., speaker-specific), so that giving students more general training with accented speech may not help very much. Further research is needed to establish the generalizability of the current findings by including more accent types, more speaker variability, and distance manipulations that capture all of the cues that vary with distance.
Theoretically speaking, the current findings provide insights into accented speech perception by showing the impact of visual cues at the word level. Visual cues improved accented word recognition, presumably by providing additional valid information from the lip movements that can help to decode the auditory speech signal. Listeners used the visual information most effectively when the speech input was difficult. In a study of speech that was challenging for reasons other than accent, Sumby and Pollack (Reference Sumby and Pollack1954) showed that visual information helped more at low speech-to-noise ratios than when the speech was clear. Our results are consistent with this pattern: the impact of lipreading on speech perception is correlated with the difficulty of the listening conditions.
The results also provided some ideas on the relationship between linguistic experience and accented speech comprehension. Previous studies suggested that listeners’ language experience can potentially affect their perception of dialect variants (Larraza, Samuel, & Onederra, Reference Larraza, Samuel and Oñederra2016; Sumner & Samuel, Reference Sumner and Samuel2009; Witteman, Weber, & McQueen, Reference Witteman, Weber and McQueen2013) and nonnative phonemes (Wang et al., Reference Wang, Behne and Jiang2008, Reference Wang, Behne and Jiang2009). Witteman et al. (Reference Witteman, Weber and McQueen2013) suggested that listeners’ familiarity with an accent affected the speed of perceptual adaptation to accented speech. They found that extensive long-term experience with German-accented Dutch facilitated learning of strongly German-accented Dutch, but limited experience with that accent did not. Sumner and Samuel (Reference Sumner and Samuel2009) also found an effect of long-term experience on the perception and representation of dialect variants. In the current study, we did not observe any effect of real-world linguistic experience on accented speech recognition (either overall, or more specifically, by virtue of having a Chinese TA between the two testing sessions). In contrast, the overall improvement from the first session to the second session suggests that participants may have benefited from being exposed to the same Chinese speaker tested at the beginning of the semester. Taken together, we thus see some improvement through exposure to the same speakers, but no improvement due to different speakers. These results are generally consistent with talker-specific learning effects that have been reported in the literature (e.g., Bradlow & Bent, Reference Bradlow and Bent2003; Gass & Varonis, Reference Gass and Varonis1984; Jongman, Wade, & Sereno, Reference Jongman, Wade and Sereno2003): much perceptual adjustment seems to be based on tuning perception to a particular speaker. Of course, it is possible to generate cross-talker or even cross-accent generalization with extensive training that contains enough variability along the dimension of desired generalization (Baese-Berk, Bradlow, & Wright, Reference Baese-Berk, Bradlow and Wright2013; Bradlow & Bent, Reference Bradlow and Bent2008).
The effects in the current study, while interesting, were generally small. There are potential extensions that might produce larger effects. For example, we manipulated the visual cues by testing two apparent distances, and it could be more informative to vary this factor across more levels. Apparent distance can also be manipulated with actual distance from the camera, rather being realized by zooming in. Potentially, this approach could add more cues that might increase the impact of the manipulation. As with distance, we also only included two different speakers here, and a testing a broader range of accent strengths would clearly be desirable. At a theoretical level, comparing accents other than from Chinese speakers would also be interesting.
In sum, the current work has both theoretical and practical implications. On the theoretical side, visual cues provide additional useful information in processing Mandarin Chinese-accented words, and the reliance on visual cues is modulated by the difficulty of the listening conditions. On a more applied side, the results offer a practical idea for improving how American undergraduates can better understand their international instructors: comprehension of accented words can be improved by reducing the distance between the listeners and the speaker, especially under nonoptimal conditions.
ACKNOWLEDGMENTS
Support was provided by Ministerio de Ciencia E Innovacion Grant PSI2014-53277, Centro de Excelencia Severo Ochoa Grant SEV-2015-0490, and by the National Science Foundation under Grant IBSS-1519908. Thanks to Dr. Yue Wang for useful comments on an earlier version of this paper. We appreciate the constructive suggestions of Dr. Shelley Xiuli Tong, Dr. Stephen Politzer-Ahles, and two anonymous reviewers.
SUPPLEMENTARY MATERIAL
To view supplementary material for this article, please visit https://doi.org/10.1017/S0142716418000462