






1. Introduction
The study of coherent structures in turbulent flow dates back to the early 1950s. Since the first observations of these organised motions, for instance by Townsend (Reference Townsend1951, Reference Townsend1976), Mollo-Christensen (Reference Mollo-Christensen1967) and Crow & Champagne (Reference Crow and Champagne1971), a substantial body of work has been dedicated to developing an understanding of how they work and what dynamical role they play. Reviews for wall-bounded flow have been provided by Robinson (Reference Robinson1991) and Jiménez (Reference Jiménez2012).
Coherent structures can be seen in flow visualisations or simulations of boundary layers, where they are manifest in the form of streaks (Wu & Moin Reference Wu and Moin2009; Eitel-Amor et al. Reference Eitel-Amor, Örlü, Schlatter and Flores2015; Jodai & Elsinga Reference Jodai and Elsinga2016) or hairpin-like structures (Adrian Reference Adrian2007). They may be analysed quantitatively in terms of their statistics and compared with frequency space models (Sen, Bhaganagar & Juttijudata Reference Sen, Bhaganagar and Juttijudata2007; Baltzer, Adrian & Wu Reference Baltzer, Adrian and Wu2010; Jordan & Colonius Reference Jordan and Colonius2013; Cavalieri, Jordan & Lesshafft Reference Cavalieri, Jordan and Lesshafft2019; Lesshafft et al. Reference Lesshafft, Semeraro, Jaunet, Cavalieri and Jordan2019; Abreu et al. Reference Abreu, Cavalieri, Schlatter, Vinuesa and Henningson2020b; Morra et al. Reference Morra, Nogueira, Cavalieri and Henningson2021; Nogueira et al. Reference Nogueira, Morra, Martini, Cavalieri and Henningson2021). A recent overview of the different structures observed in wall-bounded turbulent flows, the focus of this study, can be found in Lee & Jiang (Reference Lee and Jiang2019).
An early modelling idea, where wall-bounded flows are concerned, is that of the attached-eddy hypothesis (AEH), introduced by Townsend (Reference Townsend1951, Reference Townsend1976) and further developed by Perry & Chong (Reference Perry and Chong1982). Underlying this hypothesis is the idea that eddies in the logarithmic region of wall-bounded turbulent flows extend to the wall. This implies that their characteristic dimensions scale with distance to the wall, which implies, in turn, the existence of a self-similar organisation. A recent review of the literature on the AEH can be found in Marusic & Monty (Reference Marusic and Monty2019).
The original AEH considers coherent structures in the logarithmic region of boundary layers (Townsend Reference Townsend1976) at high Reynolds number ( $Re$), and predicts an
 $\alpha ^{-1}$ decay in the one-dimensional energy spectrum, where
 $\alpha$ is the streamwise wavenumber. The
 $\alpha ^{-1}$ decay was observed in wall-bounded turbulent flows at friction Reynolds number
 $Re_\tau \sim 100\,000$ (Perry, Henbest & Chong Reference Perry, Henbest and Chong1986; Chandran et al. Reference Chandran, Baidya, Monty and Marusic2017), suggesting the existence of attached eddies that dominate the kinetic energy in the logarithmic region. The high Reynolds number of those studies makes it difficult to conclude on the validity of the AEH in flows simulated numerically or studied at laboratory scale with low or moderate Reynolds number. Cheng et al. (Reference Cheng, Li, Lozano-Durán and Liu2020) showed that wall-attached structures account for a significant portion of the flow energy even at low-
 $Re$ flows, ranging from
 $Re_\tau =180$ to 1000. They extracted the structures that move together and reach up to the wall, and observed geometric self-similarity among these structures. Chandran, Monty & Marusic (Reference Chandran, Monty and Marusic2020) investigated the two-dimensional spectra of the streamwise velocity component, where a transition from
 $\alpha ^{-1/2}$ to
 $\alpha ^{-1}$ scaling was observed as moving from
 $Re_\tau =2400$ to 26 000. Davidson, Krogstad & Nickels (Reference Davidson, Krogstad and Nickels2006a) and Davidson, Nickels & Krogstad (Reference Davidson, Nickels and Krogstad2006b) showed that the
 $\alpha ^{-1}$ decay is not observed at lower Reynolds numbers, and they attributed this to the limited range of scales of attached eddy that can exist at low
 $Re$, whence their smaller contribution to the energy spectrum. In view of this, they suggested using the second-order structure function as a better indicator of attached eddies. Agostini & Leschziner (Reference Agostini and Leschziner2017) used structure functions to show that attached-eddy behaviour can be observed at wall-normal distance,
 $y^+$, ranging from 80 to 2000 in channel flow at
 $Re_\tau =4200$. Their study demonstrated that choosing the correct method to identify attached eddies, as statistical entities, is crucial in finding evidence of the AEH in turbulent flows that are attainable at lab scale or via numerical simulation.
There exist many techniques for the detection of coherent structures. One may use two-point measurements (Tomkins & Adrian Reference Tomkins and Adrian2003; Monty et al. Reference Monty, Stewart, Williams and Chong2007; Baars, Hutchins & Marusic Reference Baars, Hutchins and Marusic2017), conditional sampling (Hussain Reference Hussain1986; Hwang et al. Reference Hwang, Lee, Sung and Zaki2016; Cheng et al. Reference Cheng, Li, Lozano-Durán and Liu2020; Hwang, Lee & Sung Reference Hwang, Lee and Sung2020) or modal decomposition techniques such as proper orthogonal decomposition (POD) (Lumley Reference Lumley1967), dynamic mode decomposition (DMD) (Schmid Reference Schmid2010) or spectral proper orthogonal decomposition (SPOD) (Lumley Reference Lumley1970; Picard & Delville Reference Picard and Delville2000; Schmidt et al. Reference Schmidt, Towne, Rigas, Colonius and Brès2018; Towne, Schmidt & Colonius Reference Towne, Schmidt and Colonius2018). A review of these decomposition techniques, except SPOD, can be found in Taira et al. (Reference Taira, Brunton, Dawson, Rowley, Colonius, McKeon, Schmidt, Gordeyev, Theofilis and Ukeiley2017). It has been demonstrated how POD can be used to educe attached eddies in pipe flows at  $Re_\tau =1300$ (Hellström, Marusic & Smits Reference Hellström, Marusic and Smits2016) and at
 $Re_\tau =685$ (Hellström & Smits Reference Hellström and Smits2017). Those studies showed how leading POD modes are self-similar and scale with distance to the wall. This is in line with Townsend's original hypothesis, which states that attached eddies correspond to the most energetic motions of the boundary layer (Townsend Reference Townsend1976).
Coherent structures obtained through the aforementioned decomposition techniques do not satisfy the Navier–Stokes equations. An attached-eddy model based, for instance, on similarity analyses such as discussed above, provides a kinematic description only. A number of studies have shown, using dynamical descriptions, how the energy-containing motions at different scales in turbulent wall-bounded flows may be maintained through a self-sustaining mechanism (see Cossu & Hwang (Reference Cossu and Hwang2017) for a review on the subject). Those studies rely on overdamped large-eddy simulations of the filtered Navier–Stokes equations (Hwang & Cossu Reference Hwang and Cossu2010b; Hwang Reference Hwang2015), and they show that the self-sustaining cycle exhibits self-similarity. We here use standard direct numerical simulations (DNS) coupled with the resolvent framework to investigate such self-similar dynamics for the wall-attached structures in the flow.
Resolvent analysis provides a dynamical framework to study coherent structures and the nonlinear interactions that drive them (Hwang & Cossu Reference Hwang and Cossu2010a; McKeon & Sharma Reference McKeon and Sharma2010; Schmidt et al. Reference Schmidt, Towne, Rigas, Colonius and Brès2018; Cavalieri et al. Reference Cavalieri, Jordan and Lesshafft2019; Lesshafft et al. Reference Lesshafft, Semeraro, Jaunet, Cavalieri and Jordan2019). The approach involves linearising the Navier–Stokes equations about the mean flow and retaining the nonlinear terms as an inhomogeneous forcing of the linearised system. The problem can then be cast in an input/output (forcing/response) form, with forcing and response connected by the resolvent operator. Optimal forcing–response mode pairs can be identified from the resolvent operator, revealing the most important linear growth mechanisms in the flow. In many flows, the leading response mode is found to match closely coherent structures educed from time-resolved flow data (McKeon & Sharma Reference McKeon and Sharma2010; Lesshafft et al. Reference Lesshafft, Semeraro, Jaunet, Cavalieri and Jordan2019). It has been shown in the literature (Hwang & Cossu Reference Hwang and Cossu2010a; Moarref et al. Reference Moarref, Sharma, Tropp and McKeon2013; McKeon Reference McKeon2017; Sharma, Moarref & McKeon Reference Sharma, Moarref and McKeon2017, among others) that for wall-bounded flows, the optimal response mode exhibits a self-similar structure reminiscent of attached eddies. However, the dynamics of coherent structures are ultimately determined by the details of the nonlinear interactions at work in the flow, and these must be considered in order to understand how forcing/response modes of the resolvent operator combine to produce the observed behaviour (Zare, Jovanović & Georgiou Reference Zare, Jovanović and Georgiou2017; Rosenberg, Symon & McKeon Reference Rosenberg, Symon and McKeon2019; Pickering et al. Reference Pickering, Rigas, Sipp, Schmidt and Colonius2019; Martini et al. Reference Martini, Cavalieri, Jordan, Towne and Lesshafft2020; Morra et al. Reference Morra, Nogueira, Cavalieri and Henningson2021; Nogueira et al. Reference Nogueira, Morra, Martini, Cavalieri and Henningson2021; Symon, Illingworth & Marusic Reference Symon, Illingworth and Marusic2021). Consideration of the resolvent operator alone can provide only a limited understanding of the dynamics of attached eddies in wall-bounded flows. It is this that motivates the study that we undertake, where a data-driven approach is elaborated to explore the self-similarity of wall-attached coherent structures and the nonlinear interactions that drive them. It is important to understand if the self-similarity seen in the flow structures is imposed only by the resolvent operator or if a self-similar forcing also plays a role. The former scenario implies that nonlinear terms, although not self-similar, are filtered by the self-similar resolvent operator such that the response is self-similar. The latter scenario, on the other hand, indicates a dynamic self-similarity, which can be useful for modelling wall-shear-related phenomena in turbulent flows.
Our objective is to identify forcing structures that exist in the data and are associated with observed wall-attached coherent structures. One approach that can be used to do this has been proposed by Towne, Lozano-Durán & Yang (Reference Towne, Lozano-Durán and Yang2020), where a resolvent-based estimation (RBE) of forcing statistics was achieved by combining flow measurements with the resolvent operator. Martini et al. (Reference Martini, Cavalieri, Jordan, Towne and Lesshafft2020) extended that work by proposing an optimal estimation approach by which the space–time forcing field can be computed from a limited set of flow measurements; the estimator requires a model for the forcing statistics. RBE is recovered when a white model forcing is assumed, showing that this is an underlying assumption of the RBE method.
In this work, we adopt an alternative approach, in which the extended proper orthogonal decomposition (EPOD) of Borée (Reference Borée2003), which we cast in frequency space, is applied in the resolvent framework so as to identify forcing structures that are associated with an observed coherent structure. This method was first discussed in Towne et al. (Reference Towne, Colonius, Jordan, Cavalieri and Brès2015). We refer to this tailored implementation of EPOD as resolvent-based extended spectral proper orthogonal decomposition (RESPOD). Related methods are observable inferred decomposition (OID) (Schlegel et al. Reference Schlegel, Noack, Jordan, Dillmann, Gröschel, Schröder, Wei, Freund, Lehmann and Tadmor2012) and approaches based on linear stochastic estimation, such as in Kerherve et al. (Reference Kerherve, Jordan, Cavalieri, Delville, Bogey and Juvé2012). In each of these cases, linear mappings are identified between a selected observable and some other field considered to drive that observable (the flow structures in a jet responsible for sound radiation, for example). But linear mappings so identified are not grounded in any rigorous dynamic framework. The advantage of the RESPOD method is that a dynamic relation is granted within the resolvent framework. Empirically observed coherent structures are used to identify the forcing structures that exist in unsteady data and that drive the coherent structures via the resolvent operator. The dynamic relationship between forcing and response is identified such that it is consistent with the linearised Navier–Stokes equations. We use this approach to find coherent structures that are correlated to the wall shear, i.e. that are wall-attached, and the associated forcing.
A related effort is the work of Skouloudis & Hwang (Reference Skouloudis and Hwang2021), who superpose resolvent modes with various wavenumbers, as a representation of attached eddies, so as to recover the Reynolds shear stress of channels. This is referred to as a quasi-linear approximation (QLA), which may be seen as a dynamic model of attached eddies based on the linearised Navier–Stokes operator. For simplicity, the superposition is restricted to zero streamwise wavenumber, and, for most cases, to zero frequency. As discussed in the cited paper, even with restricted wavenumbers and frequencies, such a superposition is non-unique, as there are several combinations of forcing modes that lead to the same overall Reynolds shear stress. While the approach of Skouloudis & Hwang (Reference Skouloudis and Hwang2021) leads to correct Reynolds number trends, a quantitative comparison with simulation data reveals differences. Information on nonlinear terms driving flow responses may be built into dynamic attached-eddy models for more accurate predictions. We anticipate that self-similarity may be identified in both forcing and response modes with the techniques that we aim to use in the present study. Use of the educed self-similar forcing in QLA is expected to lead to structures that better match fluctuations in wall-bounded turbulence.
As we will discuss (§ 2), RESPOD is related to the RBE method of Towne et al. (Reference Towne, Lozano-Durán and Yang2020). RBE provides the ‘observable’ forcing that has the minimal norm required to generate the observed coherent structure, and it eliminates all ‘silent’ components of forcing, i.e. those components that, while present in the data, do not drive the response directly. We will show that RESPOD finds, for a given coherent structure, all the correlated forcing, including the silent components. These silent components, though redundant in terms of the direct driving of coherent structures through the resolvent operator, provide additional information regarding the forcing mechanisms at play, and, considered together with the ‘non-silent’, driving components, provide a more complete picture of the forcing structures that actually exist in the unsteady data and are correlated with the observed coherent structures. We thus obtain a more complete description of attached eddies and the scale interactions by which they are driven.
This paper is organised as follows. In § 2, the RBE and RESPOD methods are revisited. The characteristics of the two methods are discussed via implementation on a toy model. The methods are then applied in a turbulent channel flow problem in § 3. A DNS database with friction Reynolds number  $Re_\tau =543$ is used. The methodology to trace attached eddies in the turbulent channels and to compute the associated forcing is presented with the results. Further discussions are provided in § 4.
2. Identifying the forcing associated with optimal response
2.1. Resolvent-based estimation
We consider the Navier–Stokes equations
 \begin{equation} \boldsymbol{\mathsf{M}}\,\partial_t\boldsymbol{q}(\boldsymbol{x},t)=\mathcal{N}(\boldsymbol{q}(\boldsymbol{x},t)), \end{equation}
where  $\boldsymbol {q}=[\rho,\,u,\,v,\,w,\,p]^{\text {T}}$ is the state vector,
 $\mathcal {N}$ denotes the nonlinear Navier–Stokes operator, and the matrix
 $\boldsymbol{\mathsf{M}}$ is zero for the continuity equation and identity matrix for the rest in incompressible flows, or the identity matrix in compressible flows. Discretisation in space and linearisation around the mean,
 $\bar {\boldsymbol {q}}(\boldsymbol {x})$, yields
 \begin{equation} \boldsymbol{\mathsf{M}}\,\partial_t\boldsymbol{q}^{\prime}(\boldsymbol{x},t)-\boldsymbol{\mathsf{A}}(\boldsymbol{x})\,\boldsymbol{q}^{\prime}(\boldsymbol{x},t)=\boldsymbol{f}(\boldsymbol{x},t), \end{equation}
where  $\boldsymbol{\mathsf{A}}(\boldsymbol {x})=\partial _q\mathcal {N}|_{\bar {\boldsymbol {q}}}$ is the linear operator obtained from the Jacobian of
 $\mathcal {N}$, and
 $\boldsymbol {f}(\boldsymbol {x},t)$ denotes all the remaining nonlinear terms, interpreted as a forcing term in the above equation. The equations are linearised using primitive variables (Karban et al. Reference Karban, Bugeat, Martini, Towne, Cavalieri, Lesshafft, Agarwal, Jordan and Colonius2020). In the resolvent framework, (2.2) is Fourier transformed and rearranged to obtain
 \begin{equation} \hat{\boldsymbol{q}}(\boldsymbol{x},\omega)=\boldsymbol{\mathsf{R}}(\boldsymbol{x},\omega)\,\hat{\boldsymbol{f}}(\boldsymbol{x},\omega), \end{equation}
where  $\boldsymbol {x}=[x,\,y,\,z]^{\text {T}}$ is the space vector,
 $\omega$ is the angular frequency, the hat indicates a Fourier transformed quantity, and
 $\boldsymbol{\mathsf{R}}(\boldsymbol {x},\omega )=(-{\rm i}\omega \boldsymbol{\mathsf{M}}-\boldsymbol{\mathsf{A}}(\boldsymbol {x}))^{-1}$ is the resolvent operator. In what follows, notation showing dependence on
 $\boldsymbol {x}$ and
 $\omega$ will be dropped for brevity.
The cross-spectral densities of the response and forcing can also be related via the resolvent operator
 \begin{equation} {\boldsymbol{\mathsf{S}}}=\boldsymbol{\mathsf{R}}{\boldsymbol{\mathsf{P}}}\boldsymbol{\mathsf{R}}^H, \end{equation}
where  $\boldsymbol{\mathsf{S}}={\rm E}\{\hat {\boldsymbol {q}}\hat {\boldsymbol {q}}^H\}$ and
 $\boldsymbol{\mathsf{P}}={\rm E}\{\hat {\boldsymbol {f}}\hat {\boldsymbol {f}}^H\}$ denote the response and forcing cross-spectral density (CSD) matrices, respectively, with
 ${\rm E}\{\cdot \}$ denoting the expectation operator obtained by averaging different realisations, and the superscript
 $H$ denoting the conjugate transpose, or Hermitian.
The resolvent operator can be modified in order to explore the relationship between subsets of the forcing and response. For instance, limited measurements at a selection of points,  $\boldsymbol {\hat {y}}$, may be considered and related to forcing:
 $$\begin{gather} \hat{\boldsymbol{y}}=\boldsymbol{\mathsf{C}}\hat{\boldsymbol{q}}, \end{gather}$$
 $$\begin{gather}\hat{\boldsymbol{y}}=\tilde{\boldsymbol{\mathsf{R}}}\hat{\boldsymbol{f}}, \end{gather}$$
where  $\boldsymbol{\mathsf{C}}$ denotes the measurement matrix and
 $\tilde {\boldsymbol{\mathsf{R}}}\triangleq \boldsymbol{\mathsf{C}}\boldsymbol{\mathsf{R}}$ is the modified resolvent operator that connects forcing to those measurements. We will first investigate the case where
 $\boldsymbol{\mathsf{C}}=\boldsymbol{\mathsf{I}}$ and
 $\boldsymbol{\mathsf{R}}$ is full-rank, i.e.
 $\tilde {\boldsymbol{\mathsf{R}}}$ is also full-rank, before extending our analysis to cases where
 $\tilde {\boldsymbol{\mathsf{R}}}$ may be singular. Note that (2.2) and (2.3) are exact and provide a bijective relation between the forcing and the response when the resolvent operator is full-rank, and an injective relation when
 $\boldsymbol{\mathsf{R}}$ is singular.
We employ SPOD to identify coherent structures in the flow. This requires definition of an inner product
 \begin{equation} \langle \boldsymbol{a},\boldsymbol{b}\rangle = \int_\varOmega \boldsymbol{b}^H{\mathcal{W}}\boldsymbol{a}\,{\rm d}\kern0.7pt\boldsymbol{x}, \end{equation}
where  ${\mathcal{W}}$ denotes an energy norm. Equation (2.7) can be written in discrete form as
 \begin{equation} \langle \boldsymbol{a},\boldsymbol{b}\rangle = \boldsymbol{b}^H\boldsymbol{\mathsf{W}}\boldsymbol{a}, \end{equation}
where  $\boldsymbol{\mathsf{W}}$ now accounts for both the energy norm and the numerical quadrature weights. The SPOD modes, which are orthogonal with respect to the inner product defined by (2.8), are obtained by solving the eigenvalue problem
 \begin{equation} \boldsymbol{\mathsf{S}}\boldsymbol{\mathsf{W}}\boldsymbol{\psi} = \lambda\boldsymbol{\psi}, \end{equation}
where  $\boldsymbol {\psi }$ and
 $\lambda$ denote the eigenvector (SPOD mode) and the eigenvalue (SPOD mode mean square value). The CSD matrix
 $\boldsymbol{\mathsf{S}}$ can be built from SPOD modes as
 \begin{equation} \boldsymbol{\mathsf{S}} = \sum_n \lambda_n\boldsymbol{\psi}_n\boldsymbol{\psi}_n^H, \end{equation}
where the subscript  $n$ denotes SPOD mode number.
For non-singular  $\boldsymbol{\mathsf{R}}$, the forcing mode that generates a given SPOD mode,
 $\boldsymbol {\psi }$, can be obtained by inverting the resolvent equation
 \begin{equation} \boldsymbol{\phi}=\boldsymbol{\mathsf{L}}\boldsymbol{\psi}, \end{equation}
where  $\boldsymbol{\mathsf{L}}\triangleq (-{\rm i}\omega \boldsymbol{\mathsf{M}}-\boldsymbol{\mathsf{A}})$ and
 $\boldsymbol{\mathsf{R}}=\boldsymbol{\mathsf{L}}^{-1}$. In the case of
 $\tilde {\boldsymbol{\mathsf{R}}}$, which is singular, direct inversion is not possible, and the forcing mode associated with the SPOD mode,
 $\boldsymbol {\psi }$, can then be obtained by means of a pseudo-inverse of
 $\tilde {\boldsymbol{\mathsf{R}}}$:
 \begin{equation} \boldsymbol{\phi}=\tilde{\boldsymbol{\mathsf{R}}}^+\boldsymbol{\psi}. \end{equation}
The mode  $\boldsymbol {\phi }$ in (2.12) can be understood as the minimal-norm forcing that creates the response,
 $\boldsymbol {\psi }$, through the resolvent operator, in what is called resolvent-based estimation (RBE) (Martini et al. Reference Martini, Cavalieri, Jordan, Towne and Lesshafft2020; Towne et al. Reference Towne, Lozano-Durán and Yang2020). The forcing structures that are correlated with the response but are ‘silent’, i.e. have no flow response, are not present in the forcing modes estimated using RBE. This might be a desired property for the kinematic modelling of forcing, as whatever is included in the estimated mode is ensured to contribute to the response. However, from a dynamical modelling point of view, elimination of the correlated-but-silent parts of the forcing may hide important dynamic traits of the interaction mechanisms that underpin the forcing structures. Since the silent components are correlated to the observable forces, they are likely generated by the same mechanisms. Thus their study can facilitate identification of these mechanisms. To identify such structures, we consider, in what follows, a data-driven approach that takes into account the forcing and response structures that are actually contained in the data.
2.2. Resolvent-based extended spectral proper orthogonal decomposition
The approach that we present is adapted from the EPOD of Borée (Reference Borée2003), whose goal was to identify correlations between an observed POD mode and some other target field. In Hoarau et al. (Reference Hoarau, Borée, Laumonier and Gervais2006), the method was used in spectral domain. We revisit EPOD also in frequency space, setting the target event as the forcing defined by (2.3). This specific construction of EPOD was first discussed in Towne et al. (Reference Towne, Colonius, Jordan, Cavalieri and Brès2015). We refer here to this implementation as ‘resolvent-based, extended spectral proper orthogonal decomposition’ (RESPOD).
The SPOD modes defined by (2.9) are orthogonal with respect to the norm defined by (2.8), i.e.
 \begin{equation} \langle \boldsymbol{\psi}_n,\boldsymbol{\psi}_p\rangle = \delta_{np}, \end{equation}
where  $\boldsymbol {\psi }_n$ is the
 $n$th SPOD mode. The SPOD modes provide a complete basis that can be used to expand any realisation of the state vector as
 \begin{equation} \hat{\boldsymbol{q}} = \sum_n a_n\boldsymbol{\psi}_n, \end{equation}
where the projection coefficient  $a_n$ associated with the
 $n$th eigenmode is obtained by the projection
 \begin{equation} a_n = \langle \hat{\boldsymbol{q}},\boldsymbol{\psi}_n\rangle. \end{equation}
The orthonormality of the SPOD basis, defined by (2.13), imposes that the projection coefficients satisfy
 \begin{equation} {\rm E}\{a_n a_p^H\} = \lambda_n\delta_{np}. \end{equation}
This can be seen as follows:
 \begin{align} {\rm E}\{a_n a_p^H\} &={\rm E}\{\langle\hat{\boldsymbol{q}},\boldsymbol{\psi}_n\rangle\langle\hat{\boldsymbol{q}},\boldsymbol{\psi}_n\rangle^H\} \nonumber\\ &={\rm E}\{\boldsymbol{\psi}_n^H\boldsymbol{\mathsf{W}}\hat{\boldsymbol{q}}\hat{\boldsymbol{q}}^H\boldsymbol{\mathsf{W}}^H\boldsymbol{\psi}_p\}\quad\text{(using (2.8))}\nonumber\\ &=\boldsymbol{\psi}_n^H\boldsymbol{\mathsf{W}}{\rm E}\{\hat{\boldsymbol{q}}\hat{\boldsymbol{q}}^H\}\boldsymbol{\mathsf{W}}^H\boldsymbol{\psi}_p\nonumber\\&= \boldsymbol{\psi}_n^H\boldsymbol{\mathsf{W}}\sum_k\lambda_k\boldsymbol{\psi}_k\boldsymbol{\psi}_k^H\boldsymbol{\mathsf{W}}^H\boldsymbol{\psi}_p\quad\text{(using (2.10))}\nonumber\\ &= \lambda_n\delta_{np}.\end{align}
Here, the expectation operator corresponds to an ensemble average of Fourier realisations. Borée (Reference Borée2003) used (2.14) and (2.16) to show that
 \begin{align} {\rm E}\{\hat{\boldsymbol{q}}\,a_p^H\}&={\rm E}\left\{\left(\sum_n a_n\boldsymbol{\psi}_n\right)a_p^H\right\}\nonumber\\ &=\sum_n{\rm E}\{a_na_p^H\}\boldsymbol{\psi}_n \nonumber\\ &=\lambda_p\boldsymbol{\psi}_p, \end{align}
which provides an alternative way to compute  $\boldsymbol {\psi }_p$ as
 \begin{equation} \boldsymbol{\psi}_p=\frac{{\rm E}\{\hat{\boldsymbol{q}}\,a_p^H\}}{\lambda_p}, \end{equation}
assuming that  $a_p$ is known. Equation (2.19) corresponds to the snapshot approach, shown by Towne et al. (Reference Towne, Schmidt and Colonius2018) to provide a less costly alternative to eigendecomposition of (2.9). Note that for this, one needs to calculate the projection coefficients beforehand. Using the decomposition given in (2.14), we can show that
 \begin{equation} \langle \hat{\boldsymbol{q}},\hat{\boldsymbol{q}}\rangle = \sum_n a_n a_n^H. \end{equation}
For a given  $\hat {\boldsymbol{\mathsf{Q}}}$ defined as the set of realisations of
 $\hat {\boldsymbol {q}}$, (2.20) can be written as
 \begin{equation} \langle \hat{\boldsymbol{\mathsf{Q}}},\hat{\boldsymbol{\mathsf{Q}}}\rangle = \sum_n \boldsymbol{a}_n {\boldsymbol{a}_n}^H, \end{equation}
where  $\boldsymbol {a}_n\triangleq \langle \hat {\boldsymbol{\mathsf{Q}}},\boldsymbol {\psi }_n\rangle$ denotes the projection coefficient vector. Note that (2.16) holds also for
 $\boldsymbol {a}_n$, implying the orthogonality of the projection coefficient vectors that correspond to different SPOD modes. Given this orthogonality, rewriting (2.21) by normalising
 $\boldsymbol {a}_n$ with
 $\lambda _n^{-1/2}$ as
 \begin{equation} \langle \hat{\boldsymbol{\mathsf{Q}}},\hat{\boldsymbol{\mathsf{Q}}}\rangle = \sum_n (\boldsymbol{a}_n\lambda_n^{{-}1/2})\lambda_n (\boldsymbol{a}_n^H\lambda_n^{{-}1/2}), \end{equation}
we obtain the eigendecomposition of  $\langle \hat {\boldsymbol{\mathsf{Q}}},\hat {\boldsymbol{\mathsf{Q}}}\rangle$. Computing the eigendecomposition given in (2.22), one can obtain the projection coefficients before calculating the SPOD vectors.
Given the forcing vector  $\hat {\boldsymbol {f}}$, its RESPOD mode is given by
 \begin{equation} \boldsymbol{\chi}_p=\frac{{\rm E}\{\hat{\boldsymbol{f}}a_p^H\}}{\lambda_p}. \end{equation}
The RESPOD mode  $\boldsymbol {\chi }_p$ provides the forcing mode associated with the
 $p$th SPOD mode of the response. In Borée (Reference Borée2003), it was shown that the extended modes can be used to isolate, from the target event, the part that is correlated with the observed coherent structure. Given, for instance, the rank-1 representation of
 $\hat {\boldsymbol {q}}$ as
 $\hat {\boldsymbol {q}}_1=a_1\boldsymbol {\psi }_1$, the corresponding RESPOD mode
 $\boldsymbol {\chi }_1$ allows identification of
 $\hat {\boldsymbol {f}}_1\triangleq a_1\boldsymbol {\chi }_1$, which is the forcing correlated with
 $\hat {\boldsymbol {q}}_1$. This can be seen by comparing the two cross-covariances between the forcing and the response given as
 \begin{align} {\rm E}\{\hat{\boldsymbol{f}}\,\hat{\boldsymbol{q}}_1^H\} &= {\rm E}\{\hat{\boldsymbol{f}}a_1^H\boldsymbol{\psi}_1^H\}\nonumber\\ &= {\rm E}\{\hat{\boldsymbol{f}}a_1^H\}\boldsymbol{\psi}_1^H \nonumber\\ &= \lambda_1\boldsymbol{\chi}_1\boldsymbol{\psi}_1^H \end{align}
and
 \begin{align} {\rm E}\{\hat{\boldsymbol{f}}_1\hat{\boldsymbol{q}}_1^H\} &= {\rm E}\{a_1\boldsymbol{\chi}_1a_1^H\boldsymbol{\psi}_1^H\}\nonumber\\ &= \boldsymbol{\chi}_1{\rm E}\{a_1a_1^H\}\boldsymbol{\psi}_1^H \nonumber\\ &= \lambda_1\boldsymbol{\chi}_1\boldsymbol{\psi}_1^H. \end{align}
This indicates that  $\hat {\boldsymbol {f}}_1$ contains all the forcing that is correlated with
 $\hat {\boldsymbol {q}}_1$.
As the target event we consider here is the forcing term in the resolvent framework, which satisfies (2.6), substituting (2.6) into (2.19), we can show that
 \begin{align} \boldsymbol{\psi}_p&=\frac{{\rm E}\{\tilde{\boldsymbol{\mathsf{R}}}\hat{\boldsymbol{f}}a_p^H\}}{\lambda_p}\nonumber\\ &=\tilde{\boldsymbol{\mathsf{R}}}\frac{{\rm E}\{\hat{\boldsymbol{f}}a_p^H\}}{\lambda_p} \nonumber\\ &=\tilde{\boldsymbol{\mathsf{R}}}\boldsymbol{\chi}_p, \end{align}
indicating that the correlated response and force modes are dynamically consistent, i.e. they satisfy (2.6).
As mentioned earlier, the relation between forcing and response becomes bijective for a non-singular resolvent operator; i.e. for a given response  $\boldsymbol {\psi }$, there is a unique forcing mode that satisfies (2.26) and (2.11). This implies that for the non-singular resolvent operator, the forcing mode identified by RESPOD becomes identical to the RBE mode predicted using (2.11). But for the case of a singular resolvent operator, RESPOD finds both the minimal-norm forcing (also predicted by RBE) necessary to generate the SPOD mode and the correlated-but-silent components of the nonlinear scale interactions.
2.3. Comparison of RBE and RESPOD using a simple model
As a toy model to illustrate the techniques, we consider two rank-3 resolvent operators,  $\boldsymbol{\mathsf{R}}_f$ and
 $\boldsymbol{\mathsf{R}}_s$, that are, respectively, full-rank and singular:
 \begin{equation} \boldsymbol{\mathsf{R}}_f=\begin{bmatrix} 3 & 0 & 0 \\ 0 & 2 & 0 \\ 0 & 0 & 1 \end{bmatrix},\quad \boldsymbol{\mathsf{R}}_s=\begin{bmatrix} 3 & 0 & 0 & 0 & 0 \\ 0 & 2 & 0 & 0 & 0 \\ 0 & 0 & 1 & 0 & 0 \end{bmatrix}. \end{equation}
Both systems are driven by random forcing vectors,  $\hat {\boldsymbol {f}}_f=[c_1,\,c_2,\,c_3]^{\text {T}}$ and
 $\hat {\boldsymbol {f}}_s=[c_1,\,c_2,\,c_3,\,3c_1,\,c_4]^{\text {T}}$, respectively, where
 $c_i$ is a random number with zero mean and unit variance. The random forcing realisations are generated using Matlab random number generator. The random number seeding is re-initialised for each simulation to ensure using the same random value series, which makes the results repeatable. The fourth and fifth components in
 $\hat {\boldsymbol {f}}_s$ project onto the null space of
 $\boldsymbol{\mathsf{R}}_s$, but the fourth component is fully correlated to the first since both contain the same random variable,
 $c_1$. Re-initialisation of the random number generator ensures that the first three components of
 $\hat {\boldsymbol {f}}_f$ and
 $\hat {\boldsymbol {f}}_s$, those that are observable through the corresponding resolvent operators, are identical. The responses obtained for the two systems are thereby identical. Two tests are carried out using 10 and 500 realisations, respectively. The leading SPOD mode for both singular and non-singular systems is obtained as
 $\boldsymbol {\psi }= [-0.9622, \, 0.2576, \, -0.0890]^{\text {T}}$ when 10 realisations are considered, and
 $\boldsymbol {\psi }= [-0.9943, \, -0.1056, \, 0.0148]^{\text {T}}$ with 500 realisations. As the forcing in the full-rank model problem is white, i.e.
 $\boldsymbol{\mathsf{P}}=\boldsymbol{\mathsf{I}}$, by inspection, one can see that the expected value for the leading SPOD mode is
 $\boldsymbol {\psi }=[1,\,0,\,0]^{\text {T}}$ (or its negative). The predictions based on realisations converge to the expected value with an algebraic convergence.
Using 10 realisations, the forcing modes computed using RBE and RESPOD, respectively  $\boldsymbol {\phi }_{f/s}$ and
 $\boldsymbol {\chi }_{f/s}$, are, for the full-rank system,
 \begin{equation} \boldsymbol{\phi}_f=\begin{bmatrix} -0.3207 \\ 0.1288 \\ -0.0890 \end{bmatrix}\quad \text{and}\quad \boldsymbol{\chi}_f=\begin{bmatrix} -0.3207 \\ 0.1288 \\ -0.0890 \end{bmatrix}, \end{equation}
while for the singular system we obtain
 \begin{equation} \boldsymbol{\phi}_s=\begin{bmatrix} -0.3207 \\ 0.1288 \\ -0.0890 \\ 0 \\ 0 \end{bmatrix}\quad \text{and}\quad \boldsymbol{\chi}_s=\begin{bmatrix} -0.3207 \\ 0.1288 \\ -0.0890 \\ -0.9622 \\ 0.0283 \end{bmatrix}. \end{equation}
The same results for the cases based on 500 realisations are given as
 \begin{align} \boldsymbol{\phi}_f=\begin{bmatrix} -0.3314 \\ -0.0528 \\ 0.0148 \end{bmatrix}, \quad \boldsymbol{\chi}_f=\begin{bmatrix} -0.3314 \\ -0.0528 \\ 0.0148 \end{bmatrix}, \quad \boldsymbol{\phi}_s=\begin{bmatrix} -0.3314 \\ -0.0528 \\ 0.0148 \\ 0 \\ 0 \end{bmatrix}\quad \text{and}\quad \boldsymbol{\chi}_s=\begin{bmatrix} -0.3314 \\ -0.0528 \\ 0.0148 \\ -0.9943 \\ 0.0066 \end{bmatrix}. \end{align}
As expected, the results obtained using RBE and RESPOD are identical in the full-rank system. The fourth component of  $\boldsymbol {\chi }_s$ is three times the first component, where this correlation information was included in the definition of
 $\hat {\boldsymbol {f}}_s$. Although the RBE method, which finds the minimal-norm forcing for a given response, and the RESPOD method, which finds the correlated forcing for a given response, ask different questions, their results are the same when the resolvent operator is full-rank. This is because for a full-rank resolvent operator, no silent forcing exists. When different numbers of realisations are considered, RBE and RESPOD yield identical results when the resolvent operator is full-rank; this is because the SPOD response mode and the RESPOD forcing mode have identical convergence in that case. This will be the case when the two methods are based on the exact same realisations, and the realisations are consistent, i.e. they satisfy (2.6). The results may differ if the database contains noise on the response and/or the forcing, which is outside the scope of this study.
For the singular case, the forcing predictions obtained using RBE and RESPOD differ in the silent forcing components. RBE, by construction, predicts zero forcing in these components, while RESPOD captures the correlated information between the first and fourth components, and the fifth component, which is uncorrelated with the response, tends to zero. In a more complicated system, involving turbulent flow for example, this additional information obtained from RESPOD may be expected to provide additional insight regarding the mechanisms that underpin the forcing.
Note that although the SPOD modes are unit vectors in the Euclidean norm, the associated forcing modes obtained using RESPOD or RBE are not unit vectors. In (2.23), we see that the RESPOD mode is normalised using the response eigenvalue, so a unit norm is not ensured. Similarly, (2.11) implies that for a unit SPOD vector, the associated forcing mode obtained using RBE is not necessarily a unit vector. The norm of the forcing mode obtained by RBE/RESPOD is related by the associated gain. In RBE, amplified forcing modes will have a smaller-than-unity norm, such that  $\boldsymbol{\mathsf{R}}\boldsymbol {\phi }$ will be unity. In RESPOD, besides the associated gain, the norm also depends on the correlated-but-silent parts.
3. Identifying wall-attached structures and their forcing in turbulent channel flow
We use the tools outlined above to analyse turbulent channel flow, our objective being to educe, from DNS data, wall-attached structures and the forcing by which they are driven. We investigate if these wall-attached structures are reminiscent of attached eddies discussed widely in the literature.
Attached eddies begin to dominate the one-dimensional energy spectrum of a wall-bounded flow only beyond a certain value of  $Re$ (
 $Re_\tau \sim 100\,000$) (Perry et al. Reference Perry, Henbest and Chong1986; Chandran et al. Reference Chandran, Baidya, Monty and Marusic2017). But it has been shown that structure-eduction techniques can be used to identify such structures at lower
 $Re$: structure functions were used by Davidson et al. (Reference Davidson, Krogstad and Nickels2006a,Reference Davidson, Nickels and Krogstadb) and Agostini & Leschziner (Reference Agostini and Leschziner2017), while Hellström et al. (Reference Hellström, Marusic and Smits2016) and Hellström & Smits (Reference Hellström and Smits2017) used POD. In our study, we analyse structures that are correlated to the wall shear in a turbulent channel flow at
 $Re_\tau =543$, our objective being to establish: (1) if these exhibit self-similar features consistent with attached eddies; and (2) if the associated forcing, identified using both RBE and RESPOD, also exhibits a self-similar organisation. The underlying aim is to lay the groundwork for a resolvent-based dynamic attached-eddy model, as discussed in the Introduction.
In the work of Yang & Lozano-Durán (Reference Yang and Lozano-Durán2017), wall shear in the flow direction was shown to manifest self-similarity along the log layer, reminiscent of attached eddies, and this was used to build a model for momentum cascade. Here, we use instead the wall shear in the spanwise direction as the reference quantity to detect wall-attached structures. Our attempt to use the streamwise wall shear did not yield clear self-similarity in the associated coherent structures, and thus is not reported here.
3.1. Database and definitions
The flow data are provided by DNS of the incompressible Navier–Stokes equations using the ‘ChannelFlow’ code (see www.channelflow.ch for details). The DNS details are provided in table 1, where  $T_{max}$ and
 $\Delta t$ denote the total simulation time and the time step, respectively, and
 $L_{x/y/z}$ and
 $N_{x/y/z}$ denote the domain and the grid size, respectively; the superscript
 $+$ denotes a near-wall unit. For dealiasing, a larger number of Fourier modes (
 $3/2$ times
 $N_x$ and
 $N_z$) was used in the simulations. The subscripts
 $x$,
 $y$ and
 $z$ denote the streamwise, wall-normal and spanwise directions, respectively. The mean velocities and the root-mean-square values of the DNS data used were compared against the literature (del Álamo & Jiménez Reference del Álamo and Jiménez2003) in Morra et al. (Reference Morra, Nogueira, Cavalieri and Henningson2021), and are therefore not presented here. To show the statistical convergence of the simulation, we check the balance in the mean momentum equation given as
 \begin{equation} 0 = \frac{1}{Re_\tau} + \frac{{\rm d}^2U_x^+}{{\rm d}{y^{+}}^2}-\frac{\overline{uv}^+}{{{\rm d} y}^+}, \end{equation}
where  $U_x$ denotes the mean streamwise velocity,
 $u$ and
 $v$ denote the velocity fluctuations in the streamwise and wall-normal directions, respectively, an overbar indicates temporal averaging, and the superscript
 $+$ denotes quantities in wall units (see Wei et al. (Reference Wei, Fife, Klewicki and McMurtry2005) for further details). Integrating (3.1) in
 $y^+$ yields
 \begin{equation} -y = \frac{{\rm d}U_x^+}{{\rm d}{y^{+}}}-\overline{uv}^+. \end{equation}
The terms in (3.2) are plotted in figure 1, where it is seen that the summation of  ${{\rm d}U_x^+}/{{\rm d}{y^{+}}}$ and
 $-\overline {uv}^+$ satisfies (3.2), hence the momentum balance is reached.
Momentum budget plot for the DNS of the channel flow.

Details of the DNS database.

The Fourier realisations are calculated using 128 fast Fourier transform (FFT) points with 80 % overlap between successive time blocks. The second-order exponential windowing function given in Martini et al. (Reference Martini, Cavalieri, Jordan and Lesshafft2019) is used to perform the Fourier transform. The forcing correction associated with the windowing function is added to the Fourier realisations of the forcing as described in Martini et al. (Reference Martini, Cavalieri, Jordan and Lesshafft2019) to ensure that the forcing and the response are related accurately to each other via the resolvent operator, as shown by Morra et al. (Reference Morra, Nogueira, Cavalieri and Henningson2021) and Nogueira et al. (Reference Nogueira, Morra, Martini, Cavalieri and Henningson2021).
The resolvent framework for incompressible isothermal viscous flows is given as follows. Defining  $\boldsymbol {u}_{tot}=\boldsymbol {U}+\boldsymbol {u}$ and
 $p_{tot}=P+p$ – where
 $\boldsymbol {U}=[U_x,\, 0,\, 0]^{\rm T}$ and
 $\boldsymbol {u}=[u,\, v,\, w]^{\rm T}$ are the mean and fluctuation velocities, respectively, defined in Cartesian coordinates ordered in streamwise, wall-normal and spanwise directions, and
 $P$ and
 $p$ are the mean and fluctuating pressure – the governing equations for momentum fluctuations are given as
 \begin{equation} \left. \begin{gathered} \partial_t\boldsymbol{u}+(\boldsymbol{U}\boldsymbol{\cdot}\boldsymbol{\nabla})\boldsymbol{u} +(\boldsymbol{u}\boldsymbol{\cdot}\boldsymbol{\nabla})\boldsymbol{U}={-}\boldsymbol{\nabla} p + \frac{1}{Re}\nabla^2\boldsymbol{u}+\boldsymbol{b}+\boldsymbol{f},\\ \boldsymbol{\nabla}\boldsymbol{\cdot}\boldsymbol{u}=0, \end{gathered} \right\} \end{equation}
where  $Re=U_{bulk}h/\nu$ denotes the Reynolds number,
 $\nu$ is the molecular viscosity,
 $\boldsymbol {f}=-(\boldsymbol {u}\boldsymbol {\cdot }\boldsymbol {\nabla })\boldsymbol {u}$ and
 $\boldsymbol {b}=-\boldsymbol {\nabla } P + Re^{-1}\nabla ^2\boldsymbol {U}-(\boldsymbol {U}\boldsymbol {\cdot }\boldsymbol {\nabla })\boldsymbol {U}$. Spatial derivative operators are given as
 $\boldsymbol {\nabla }=[\partial _x,\, \partial _y,\, \partial _z]^\textrm {T}$ and
 $\nabla ^2=\boldsymbol {\nabla }\boldsymbol {\cdot }\boldsymbol {\nabla }$. Defining the state vector
 $\boldsymbol {q}=[u,\,v,\,w,\,p]^\textrm {T}$, and taking the Fourier transform in all homogeneous dimensions (
 $x$,
 $z$ and
 $t$) with the ansatz
 $\hat {\boldsymbol {q}}(\alpha,y,\beta,\omega ) \exp ({\textrm {i}(\alpha x + \beta z - \omega t)})$, the governing equations given in (3.3) can be written in matrix form as
 \begin{equation} {\rm i}\omega\boldsymbol{\mathsf{M}}\hat{\boldsymbol{q}}-{\boldsymbol{\mathsf{A}}}\hat{\boldsymbol{q}}=\boldsymbol{B}\hat{\boldsymbol{f}}, \end{equation}
considering that  $\omega$,
 $\alpha$ and
 $\beta$ are not simultaneously zero, such that the
 $\boldsymbol {b}$ term, which varies only in
 $y$, has no contribution. Note that taking the Fourier transform in
 $x$ and
 $z$ allows an accurate and inexpensive explicit construction of the resolvent operator using pseudo-spectral methods.
Defining the transformation matrix  $\hat {\boldsymbol {u}}=\boldsymbol{\mathsf{C}}\hat {\boldsymbol {q}}$, we can write (3.4) in resolvent form as
 \begin{equation} \hat{\boldsymbol{u}}=\boldsymbol{\mathsf{R}}\hat{\boldsymbol{f}}, \end{equation}
where  $\boldsymbol{\mathsf{R}}=\boldsymbol{\mathsf{C}}(-\textrm {i}\omega \boldsymbol{\mathsf{M}}-\boldsymbol{\mathsf{A}})^{-1}\boldsymbol {B}$, and a hat denotes a Fourier-transformed variable. The matrices
 $\boldsymbol{\mathsf{A}}$,
 $\boldsymbol {B}$,
 $\boldsymbol{\mathsf{C}}$ and
 $\boldsymbol{\mathsf{M}}$ are given in explicit form in Appendix A.
To investigate the wall-attached structures, we will define a measurement matrix
 \begin{equation} \tilde{\boldsymbol{\mathsf{C}}}=[0\; 0\; \partial_z|_{y=0}\; 0], \end{equation}
which yields, when we left-multiply it with (3.5),
 \begin{equation} \tau_z=\tilde{\boldsymbol{\mathsf{C}}}\boldsymbol{\mathsf{R}}\hat{\boldsymbol{f}}, \end{equation}
where  $\tau _z=\partial _zw|_{y=0}$ is the spanwise wall shear. We choose to measure
 $\tau _z$ considering that it is strongly associated to quasi-streamwise vortices. We then apply the RESPOD to obtain the forcing that is correlated with the wall shear. Note that since
 $\tau _z$ is a scalar quantity, it has one SPOD mode that is also scalar, and the associated forcing is bound to be rank-1, which yields
 \begin{equation} \psi=\tilde{\boldsymbol{\mathsf{C}}}\boldsymbol{\mathsf{R}}\boldsymbol{\chi}. \end{equation}
The RESPOD mode  $\boldsymbol {\chi }$, when multiplied with the resolvent operator
 $\boldsymbol{\mathsf{R}}$, yields the velocity field that is correlated with
 $\tau _z$. The proof is provided in the following. Using the velocity vector
 $\hat {\boldsymbol {u}}$ as the target event in (2.23) instead of the forcing
 $\hat {\boldsymbol {f}}$, one can obtain the velocity field
 $\boldsymbol {\xi }$ that is correlated with
 $\tau _z$ as
 \begin{equation} \boldsymbol{\xi}=\frac{{\rm E}\{\hat{\boldsymbol{u}}a^H\}}{\lambda}, \end{equation}
where, for the particular case of  $\tau _z$ being a scalar,
 $a=\langle \tau _z,1\rangle$ and the eigenvalue
 $\lambda$ is obtained simply by
 ${\rm E}\{\tau _z\tau _z^H\}$. Substituting (3.5) into (3.9) gives
 \begin{equation} \boldsymbol{\xi}=\boldsymbol{\mathsf{R}}\boldsymbol{\chi}, \end{equation}
which proves the above statement. Since  $\boldsymbol {\xi }$, also rank-1, corresponds to all and the only parts in
 $\hat {\boldsymbol {u}}$ that are correlated with
 $\tau _z$ (see the discussion in § 2.2 or alternatively Borée (Reference Borée2003)), we consider it as the wall-attached part of
 $\hat {\boldsymbol {u}}$.
3.2. Power spectral densities
The DNS database is decomposed into Fourier modes in streamwise and spanwise directions. In figure 2, we show the power spectral density (PSD) of  $\tau _z$ at different
 $\alpha ^+$ and
 $\beta ^+$ values. Peak energy location is seen to move towards higher
 $\omega$ and
 $\beta$ for increasing
 $\alpha$ while the amplitude reduces. Attached eddies are expected to be the main energy-containing structures in the flow (Townsend Reference Townsend1976) and exhibit a self-similar organisation. Self-similarity implies that structures in the same hierarchy should have constant streamwise-to-spanwise and streamwise-to-wall-normal ratios. In a flow database that is decomposed into Fourier modes in the streamwise and spanwise directions, self-similarity can be investigated by imposing it in the horizontal plane by fixing the streamwise-to-spanwise aspect ratio (AR) and searching for it in the wall-normal direction, similar to Hellström et al. (Reference Hellström, Marusic and Smits2016) and Hellström & Smits (Reference Hellström and Smits2017). In what follows, we first set
 $\rm\lambda _x^+/\rm\lambda _z^+=6$, where
 $\rm\lambda _x$ and
 $\rm\lambda _z$ are the streamwise and spanwise wavelengths, and look for self-similar structures at this AR. We then extend our analysis to a range of ARs and provide an overall view of self-similarity for the given channel flow. We first investigate self-similarity of structures at frequencies with high spectral energy, which is followed by investigation of self-similarity in less energetic structures.
PSD map of  $\tau _z$ for different
 $\alpha ^+$ values.

Maximum-energy-containing frequency  $\omega _{max}$ for different
 $\alpha ^+$ values with
 $\textrm {AR}=6$ is shown in figure 3. We see that
 $\omega _{max}$ increases almost linearly with
 $\alpha ^+$. We approximate this trend with the red line shown in the figure, which is the best linear fit minimising
 $L_1$-norm error. The
 $L_1$-norm is chosen for the trend line to be less sensitive to outliers. The frequency corresponding to each
 $(\rm\lambda _x^+,\rm\lambda _z^+)$ pair is selected using this trend line.
Maximum-energy-containing frequency,  $\omega _{max}$, of spanwise wall shear
 $\tau _z$ for different Fourier-mode pairs with
 $\textrm {AR}=6$. The red dashed line indicates the best fit minimising
 $L_1$-norm error.

The accuracy of the forcing database in  $Re_\tau =543$ flow is verified by comparing the state
 $\hat {\boldsymbol {q}}$ to its resolvent-based prediction
 $\boldsymbol{\mathsf{R}}\hat {\boldsymbol {f}}$ in figure 4. Such an evaluation has already been performed by Morra et al. (Reference Morra, Nogueira, Cavalieri and Henningson2021) for two dominant structures, and it is here extended to a broader range of wavenumbers. As seen in the figure, the resolvent-based prediction of the response matches the DNS state data for the entire wavenumber span considered.
PSD of the response  $\hat {\boldsymbol {q}}$ (solid lines) in comparison to its resolvent-based prediction
 $\boldsymbol{\mathsf{R}}\hat {\boldsymbol {f}}$ (markers) at
 $\omega _{max}$ for different Fourier-mode pairs with
 $\textrm {AR}=6$. Wavelengths plotted are
 $\rm\lambda _x^+=487$, 569, 683, 853, 1137 and 1706.

The square root of PSD of the wall shear  $\tau _z$ calculated at
 $\omega _{max}$ is shown in figure 5. The amplitude is seen to decrease for increasing
 $\alpha ^+$ as expected from figure 2. The trend is almost linear for
 $\alpha ^+>7.4\times 10^{-3}$.
Amplitude spectral density of spanwise wall shear  $\tau _z$ at
 $\omega _{max}$ for different Fourier-mode pairs with
 $\textrm {AR}=6$.

3.3. Wall-attached coherent structures and associated forcing for  $\textrm {AR}=6$

We now focus on the wall-attached structures at the peak-energy frequency,  $\omega _{max}^+$, for each
 $(\rm\lambda _x^+,\rm\lambda _z^+)$ pair with AR fixed at 6. The modes are forced to be symmetric in
 $u$ and
 $w$ (and anti-symmetric in
 $v$) about the channel centre in the wall-normal direction by averaging the flow fields in the bottom and the upper halves of the channel (considering a minus sign in
 $v$), as in Abreu et al. (Reference Abreu, Cavalieri, Schlatter, Vinuesa and Henningson2020a). In figure 6, wall-shear-associated forcing modes obtained using RESPOD and RBE methods, respectively, and the velocity fields generated by these forcing modes, are shown. Note that the mode amplitudes are adjusted to have unit wall shear. The forcing from the RBE method,
 $\boldsymbol {\phi }$, shows that the spanwise and wall-normal components of forcing drive the wall-shear dynamics observed in the flow at this AR, while the streamwise component is almost not required. For the forcing from the RESPOD method,
 $\boldsymbol {\chi }$, on the other hand, the forcing mechanisms that generate wall shear involve to a large extent the streamwise component of forcing, although its overall contribution to wall-shear dynamics can be small, as suggested by the RBE results. This indicates strong cancellations among the responses to different forcing components, similar to the results in Morra et al. (Reference Morra, Nogueira, Cavalieri and Henningson2021). This will be investigated further at the end of this subsection. As discussed earlier, the response
 $\boldsymbol {\xi }=\boldsymbol{\mathsf{R}}\boldsymbol {\chi }$ yields the velocity field associated with the wall shear. Similarly,
 $\boldsymbol{\mathsf{R}}\boldsymbol {\phi }$ can be interpreted as best prediction of the correlated velocity field when no data for forcing are available. This amounts to flow estimation using low-rank measurements with the assumption of forcing CSD
 $\boldsymbol{\mathsf{P}}=\boldsymbol{\mathsf{I}}$, as discussed in Martini et al. (Reference Martini, Cavalieri, Jordan, Towne and Lesshafft2020). We see that the velocity modes associated with the wall shear are significantly overpredicted when RBE is used.
Comparison of the wall-shear-associated forcing modes obtained by RESPOD (a,e,i) and RBE (b, f,j), and the corresponding velocity fields ((c,g,k) and (d,h,l), respectively), at  $\rm\lambda _x^+=341$, 487, 682, 1137 and 1706, with
 $\rm\lambda _x^+/\rm\lambda _z^+=6$.

As mentioned above, the difference between the minimal-norm forcing  $\boldsymbol {\phi }$ and the wall-shear-correlated forcing
 $\boldsymbol {\chi }$ implies that contributions to
 $\tau _z$ from each component of
 $\boldsymbol{\mathsf{P}}_{\chi }=\boldsymbol {\chi }\boldsymbol {\chi }^H$ cancel each other to a significant extent. To understand the effect of a particular component of
 $\boldsymbol {\chi }$ (or
 $\boldsymbol {\phi }$), we calculate the wall shear using
 $\boldsymbol {\chi }$ (or
 $\boldsymbol {\phi }$) with that component masked. The resulting wall-shear PSDs for partially masked
 $\boldsymbol {\chi }$ and
 $\boldsymbol {\phi }$, respectively, are shown in figure 7. The forcing modes are scaled such that using the full forcing mode generates a wall shear with unit amplitude at each wavenumber pair. For the wall-shear-correlated forcing
 $\boldsymbol {\chi }$, we see that the wall-normal component has the least effect on the resulting
 $\tau _z$ amplitude at every wavenumber pair. In the case of minimal-norm forcing
 $\boldsymbol {\phi }$, on the other hand, the streamwise component has negligible effect on wall-shear dynamics. This implies that the mechanisms involved in the two forcing modes are indeed different, although amounting to the same overall response. For
 $\boldsymbol {\phi }$, wall shear is generated by a pure streamwise vortical forcing at every wavenumber. For
 $\boldsymbol {\chi }$, it is the streamwise and spanwise components that are important, with the latter being the main driving component. This implies that turbulence does not follow the optimal path to generate wall-shear fluctuations. The fact that masking
 $\chi _x$ increases
 $\sqrt {{\rm E}\{\tau _z\tau _z^*\}}$ implies that simultaneous presence of the streamwise and spanwise components causes some cancellation in the wall-shear fluctuation amplitude.
Square root of PSD of  $\tau _z$ obtained using partially masked
 $\boldsymbol {\chi }$ (a) and
 $\boldsymbol {\phi }$ (b) at different wavenumbers, with
 $\textrm {AR}=6$. Unmasked PSDs are all unity, shown by the dashed lines.

Note that the predictions from the RBE method can be improved using an eddy-viscosity model. The eddy viscosity is often used to enhance modelling properties of the resolvent operator (Morra et al. Reference Morra, Semeraro, Henningson and Cossu2019; Pickering et al. Reference Pickering, Rigas, Sipp, Schmidt and Colonius2019). It was used in Towne et al. (Reference Towne, Lozano-Durán and Yang2020) and was more effective to recover flow ( $\boldsymbol {q}$) statistics. As shown in Morra et al. (Reference Morra, Nogueira, Cavalieri and Henningson2021), the eddy viscosity embeds some of the forcing statistics in the resolvent operator, but not all (Amaral et al. Reference Amaral, Cavalieri, Martini, Jordan and Towne2021). A drawback of using eddy viscosity is that the forcing of an eddy-viscosity-based resolvent operator does not correspond to the actual nonlinear Navier–Stokes terms. Since we are interested in these nonlinear terms, we use the molecular-viscosity-based resolvent operator, as it allows us to probe directly the nonlinear terms via the forcing
 $\boldsymbol {f}$.
3.4. Self-similarity of wall-attached forcing and response structures for $AR=6$

Townsend's AEH states that the attached eddies scale in size with respect to their distance to the wall (Townsend Reference Townsend1976; Perry & Chong Reference Perry and Chong1982). We will assess the validity of this assumption for the wall-attached structures investigated in this study. As mentioned earlier, by keeping the AR fixed, we impose self-similarity in the streamwise and spanwise directions. Regarding the modes seen in figure 6, although the amplitudes show different trends, particularly for different forcing components, we see that the mode shapes exhibit to a certain extent a self-similar trend, except for the wall-normal component of the forcing mode  $\boldsymbol {\chi }$. The self-similarity can be made apparent by a proper scaling of the modes in the wall-normal direction and normalisation of each mode with its peak amplitude. To assess the self-similarity in the wall-normal direction, Hellström et al. (Reference Hellström, Marusic and Smits2016) proposed a scaling based on the peak of the POD modes. In a similar spirit, we propose a scaling based on the integral function
 \begin{equation} g(\alpha,y) = \int_0^{y} |{\xi}_x(\alpha,y,\beta(\alpha),\omega_{max}(\alpha))|\,{{\rm d} y}, \end{equation}
where  ${\xi }_x$ is the streamwise component of the wall-shear-correlated velocity mode
 $\boldsymbol {\xi }$, and we use this function to define a characteristic length scale
 $y_h$ such that
 $g(\alpha,y_h)=g(\alpha,H)/2$, where
 $H$ is the channel half-height. In other words,
 $y_h(\alpha )$ is the wall-normal position that divides the area under
 $|\xi _x|$ into two equal parts. The
 $\beta ^+$ dependence of
 $y_h^+$ is shown in figure 8. We repeat this analysis with
 ${\chi }_z$ instead of
 ${\xi }_x$ and show the results in the same figure. The component
 $\chi _z$ is chosen as it is the dominant component in generating wall shear, as shown in figure 7. Consistent with the attached-eddy hypothesis (Townsend Reference Townsend1976; Perry & Chong Reference Perry and Chong1982), the wall-attached structures with the same AR computed at the peak-energy frequency,
 $\omega _{max}$, follow a
 $\beta ^{-1}$ trend except for the very small scales (
 $\beta ^+>0.09$). The forcing modes also follow a similar trend, which again deviates from
 $\beta ^{-1}$ at small scales. The wall-attached structures scaling with
 $\beta ^{-1}$, consistent with the AEH, suggests a self-similar behaviour. The forcing modes following a similar trend suggests that the mechanisms that generate these structures may also be self-similar, i.e. dynamic self-similarity in addition to Townsend's kinematic self-similarity.
Mode centre  $y_h^+$ obtained using
 $\xi _x$ (square) and
 $\chi _z$ (triangle) at different wavenumbers, with
 $\textrm {AR}=6$. The dashed line shows the
 $1/{\beta ^+}$ trend.

The characteristic eddy length scale,  $y_h$, can now be used to normalise the structures seen in figure 6. We reconstruct the forcing and response modes in the
 $y$–
 $z$ plane, which corresponds to channel cross-section. Mode phases at each
 $(\rm\lambda _x^+,\rm\lambda _z^+)$ pair are shifted to have
 $\angle \tau _z=0$. We use
 $y_h$ based on
 ${\xi }_x$ to scale both the forcing and response modes in the
 $y$- and
 $z$-directions. We normalise the wall-normal and spanwise components of both forcing modes,
 $\boldsymbol {\chi }$ and
 $\boldsymbol {\phi }$, with
 ${\chi }_x$, and similarly those of the response modes with
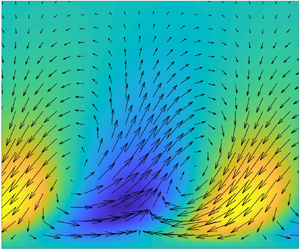
 ${\xi }_x$. The reconstructed modes, shown in figure 9, reveal self-similarity of the wall-attached structures and the associated forcing. The streaks and the streamwise vortices seen in the response modes
 $\boldsymbol {\xi }$ indicate that the wall shear
 $\tau _z$ is associated with the lift-up mechanism (Brandt Reference Brandt2014). As discussed earlier, the RBE method overpredicts the wall-shear-correlated velocity field. The modes are once again reminiscent of the lift-up mechanism, with the streaks and the streamwise vortices considerably more tilted in the spanwise direction. The optimal forcing
 $\boldsymbol {\phi }$, which is sufficient to create the wall shear observed in the flow, has a streamwise-vortex-like structure. This is consistent with the optimal forcing modes in Couette flow discussed in Hwang & Cossu (Reference Hwang and Cossu2010a). The forcing modes that actually take place in the flow, on the other hand, do not reveal immediately such a simple structure, although showing self-similarity in itself.
Reconstruction of wall-shear-associated forcing modes  $\boldsymbol {\chi }$ (a,e,i) and
 $\boldsymbol {\phi }$ (b, f,j), and the corresponding velocity fields ((c,g,k) and (d,h,l), respectively) in the
 $y$–
 $z$ plane at three wavenumbers (from top to bottom). Colour plots indicate the
 $x$-component, while vectors show
 $y$- and
 $z$-components. The domain is rescaled using
 $y_h$ for each wavenumber.

3.5. Extension of self-similarity analysis to other ARs
Given the self-similarity observed at the wall-attached structures with  $\textrm {AR}=6$, we now extend our analysis to other ARs ranging from 2 to 10. Once again we look for the dominant structures extracted by choosing the maximum-energy-containing frequency for each
 $(\rm\lambda _x^+,\rm\lambda _z^+)$ pair for a given AR. Figure 10 shows the peak-energy frequency
 $\omega _{max}^+$ versus wavenumber plots for different ARs, together with the linear trends minimising
 $L_1$-norm error. We see that all the trends for different ARs collapse onto the same line, given by
 $\omega ^+=9.04\alpha ^+ + 0.0166$. We use this linear trend to set the frequency for a given
 $(\rm\lambda _x^+,\rm\lambda _z^+)$ pair at a given AR.
Peak-energy-containing frequencies for different wavenumber pairs with fixed AR. Different markers indicate different AR values. The coloured dashed lines correspond to the best-fit lines for different ARs, using the same colour code.

We calculate the mode centre  $y_h$ and investigate its change with respect to the spanwise wavenumber
 $\beta$. Similar to the analysis conducted for the
 $\textrm {AR}=6$ case, we compute
 $y_h$ using
 ${\xi }_x$ and
 ${\chi }_z$, respectively, and show the results for different ARs in figure 11. Overall, we observe the
 $\beta ^{-1}$ trend for both the response and forcing structures at every AR, which imply that self-similarity may be present for all the dominant wall-attached structures and the associated forcing for a broad range of ARs. In general, the small-scale structures near the wall are seen to deviate from the
 $\beta ^{-1}$ trend for all the ARs. This deviation may be due to increasing viscous effects at this region. We see that at certain ARs, the largest forcing and/or response structures also deviate from the
 $\beta ^{-1}$ trend. This may be caused by these structures being affected by the other half-channel at the given
 $Re$.
Mode centre  $y_h^+$ obtained using
 $\xi _x$ (square) and and
 $\chi _z$ (triangle) at different wavenumbers. Each subplot shows results for a different AR. The dashed lines show the
 $1/{\beta ^+}$ trends.

To quantify self-similarity, we define the following measure. Given  $\zeta$ as any component of any response or forcing mode for a given
 $(\rm\lambda _x^+,\rm\lambda _z^+)$ pair at a given AR, we first normalise
 $\zeta$ with its peak value, given as
 $\zeta _n$, and then perform
 $y_h$ scaling as
 \begin{equation} \zeta_n(y)=\tilde{\zeta}_n(y/y_h), \end{equation}
to get  $\zeta _n$ in self-similar coordinates, where
 $y_h$ is calculated using
 ${\xi }_x$. After performing this analysis for all the wavenumber pairs at a given AR, we find the ‘mean’ self-similar mode by averaging these modes as
 \begin{equation} {\rm E}\{\tilde{\zeta}_n\}=\frac{1}{N}\sum_i^N\tilde{\zeta}_n^{(i)}, \end{equation}
where  $N$ denotes the total number of wavenumber pairs at that AR. We then compute the alignment of
 $\tilde {\zeta }_n^{(i)}$, which corresponds to the
 $i{\textrm {th}}$ wavenumber pair, with this mean self-similar mode as
 \begin{equation} \gamma_\zeta^{(i)}=\frac{|\langle\tilde{\zeta}_n^{(i)},{\rm E}\{\tilde{\zeta}_n\}\rangle|}{\sqrt{\langle\tilde{\zeta}_n^{(i)},\tilde{\zeta}_n^{(i)}\rangle}\sqrt{\langle {\rm E}\{\tilde{\zeta}_n\},{\rm E}\{\tilde{\zeta}_n\}\rangle}}. \end{equation}
According to (3.14),  $\gamma _\zeta ^{(i)}$ becomes 1 in case of perfect self-similarity, and 0 in case of no self-similarity. Assuming that a self-similar behaviour is present in all the data considered, the averaging process will clearly reveal the self-similar profile, with each data point showing small deviations from it. Note, however, that if self-similar behaviour is found in only a limited range of parameters, e.g.
 $\rm\lambda _z$, then including data points outside this range can mask the self-similar behaviour. That is, the approach used is prone to false negatives, being a conservative identification method.
In figure 12, we show the similarity maps  $\gamma _{\boldsymbol {\chi }}$,
 $\gamma _{\boldsymbol {\phi }}$ and
 $\gamma _{\boldsymbol {\xi }}$ for different ARs and
 $\alpha ^+$ values. White regions in the figure correspond to wavenumber pairs that are not contained in the database. In general, as all the modes have similar phase and the mode shapes are never too different from each other, for almost all the cases the self-similarity coefficient given in (3.14) takes values close to 1. However, we observed by visual inspection that self-similarity is sufficiently clear only for
 $\gamma >0.9$. Therefore, we set this as the lower limit in the maps shown in figure 12. The wall-attached structures given by
 $\boldsymbol {\xi }$ show strong self-similarity except the very-large-scale structures, which, once again, potentially are affected by the other half-channel. We see a slight reduction in the self-similarity of the smallest scales, particularly in the wall-normal and spanwise velocity components,
 $\xi _y$ and
 $\xi _z$, respectively. This reduced self-similarity is in agreement with the deviation of the small-scale structures from the
 $\beta ^{-1}$ trend as shown in figure 11.
Self-similarity maps  $\gamma _{\boldsymbol {\chi }}$ (a,d,g),
 $\gamma _{\boldsymbol {\phi }}$ (b,e,h) and
 $\gamma _{\boldsymbol {\xi }}$ (c, f,i), for different ARs and
 $\alpha ^+$ values. Panels (a–c), (d–f) and (g–i) correspond to the
 $x$-,
 $y$- and
 $z$-components, respectively.

Parallel to the wall-attached structures, the associated minimal-norm forcing,  $\boldsymbol {\phi }$ shows also self-similarity, although slightly reduced, in all its components except the large-scale structures. Note that the minimal-norm forcing
 $\boldsymbol {\phi }$ involves only the response and the resolvent operator. Given that the response is self-similar, this result implies that the resolvent operator induces self-similarity as well. This is in line with the findings of Hwang & Cossu (Reference Hwang and Cossu2010a), McKeon (Reference McKeon2017) and Sharma et al. (Reference Sharma, Moarref and McKeon2017).
Regarding the wall-shear-correlated forcing  $\boldsymbol {\chi }$, we observe self-similarity in the streamwise and spanwise components,
 $\chi _x$ and
 $\chi _z$, respectively, with that in
 $\chi _z$ being slightly higher. No such self-similarity is seen in the wall-normal component
 $\chi _y$. A potential reason for that may be the lower amplitude of forcing modes in the
 $y$-direction compared to other components, as illustrated in figure 6; statistical convergence for low-amplitude components is sufficiently harder, as
 $\chi _y$ is the smallest and the least effective forcing component in terms of wall-shear dynamics (see figure 7). Even being limited to
 $\chi _x$ and
 $\chi _z$, given that wall shear is determined mainly by these components, the self-similarity seen in
 $\boldsymbol {\chi }$ implies self-similar mechanisms associated with the wall-attached structures. The presence of such self-similar mechanisms may be beneficial for modelling wall-shear dynamics and attached eddies.
The mean self-similar modes of forcing and response for different ARs are shown in figure 13. The streamwise and wall-normal response components,  $\xi _x$ and
 $\xi _y$, respectively, have similar mode shapes for all ARs. The spanwise component has a double-peak structure, becoming more apparent with increasing AR, which implies that the streamwise vortex, and the lift-up mechanism, become more evident at higher AR. The double-peak in the spanwise component of the minimal-norm forcing
 $\phi _z$ seen at every AR indicates that the optimal forcing for wall shear always has a vortex-like structure. We do not see such a structure in the correlated forcing
 $\boldsymbol {\chi }$. Note that the correlated forcing contains both solenoidal and non-solenoidal parts, which may result in disappearance of the vortex shape. A similar observation was reported in Morra et al. (Reference Morra, Nogueira, Cavalieri and Henningson2021).
Mean self-similar modes for  $\boldsymbol {\chi }$ (a,d,g),
 $\boldsymbol {\phi }$ (b,e,h) and
 $\boldsymbol {\xi }$ (c, f,i). Panels (a–c), (d–f) and (g–i) correspond to the
 $x$-,
 $y$- and
 $z$-components, respectively.

The similarity analysis provided in this subsection involves only the mode shapes, ignoring any amplitude information. To investigate the trends in the mode amplitudes, we plot also the peak values for the absolute value of each mode component in figure 14, this time without normalising the modes to have unit wall shear. We see in figure 14 that mode amplitudes of correlated velocity decay with constant power with increasing  $\beta ^+$, with the decay rate being
 $\sim$2. The only exception is at
 $\textrm {AR}=2$, which is shown in red. The decay rate is nearly the same for all three components at all ARs from 3 to 10. Mode amplitude increases up to
 $\textrm {AR}=6$, and then saturates. In the minimal-norm forcing
 $\boldsymbol {\phi }$, the amplitude of the streamwise component is seen to be an order of magnitude smaller than the spanwise component. The amplitude difference increases with AR:
 $\phi _x$ becomes smaller, while
 $\phi _z$ remains unchanged. Similar to the minimal-norm forcing, wall-normal and spanwise components of wall-shear-correlated forcing,
 $\chi _y$ and
 $\chi _z$, respectively, have nearly the same amplitudes with increasing AR. The amplitude of the streamwise component
 $\chi _x$, on the other hand, increases up to
 $\textrm {AR}=6$ and saturates for higher AR, similar to the response mode.
Mode amplitudes for  $\boldsymbol {\chi }$ (a,d,g),
 $\boldsymbol {\phi }$ (b,e,h) and
 $\boldsymbol {\xi }$ (c, f,i) at different wavenumber pairs. Panels (a–c), (d–f) and (g–i) correspond to the
 $x$-,
 $y$- and
 $z$-components, respectively. ARs range from 2 to 10;
 $\textrm {AR}=2$ is shown in red, and the rest with greyscale. Dashed lines indicate the
 $1/(\beta ^+)^2$ trends.

3.6. Self-similarity at sub-dominant wall-attached structures
We will now investigate if the self-similarity observed in the dominant wall-attached structures extends to sub-dominant structures as well. To achieve this, we shift the trend line used to select the frequency for a given wavelength pair, as seen in figure 15. The ratio of the corresponding wall-shear spectra to that of the dominant structures investigated above is shown in figure 16. We see that when shifting to higher frequencies, the energy content at small wavenumbers drops significantly, while at high wavenumbers, it remains comparable to the energy in dominant structures.
Shifted trend line for  $\omega ^+$ corresponding to sub-dominant wall-shear structures.

Ratio of the amplitude of  $\tau _z$ calculated at sub-dominant frequencies to that calculated at
 $\omega _{max}$ at different wavenumbers.

We calculate mode centre  $y_h$ based on
 $\xi _x$ for these sub-dominant structures, and investigate its change with
 $\beta$ in figure 17. It is observed that the
 $\beta ^{-1}$ trend appears only at wavenumbers where
 $\tau _z$ contains energy at levels comparable to the dominant structures. Figure 18 shows the self-similarity maps
 $\gamma _{\boldsymbol {\chi }}$,
 $\gamma _{\boldsymbol {\phi }}$ and
 $\gamma _{\boldsymbol {\xi }}$ for these sub-dominant structures, similar to figure 12. Consistent with the
 $y_h$ versus
 $\beta$ trends in figure 17, we observe self-similarity only at wavenumbers that contain high energy. The analysis was repeated for different shift values for
 $\omega$, and similar results were obtained but are not presented here for brevity. These results imply that high-energy-containing wall-attached structures, even if sub-dominant, and the associated forcing show self-similarity at a wide range of wavenumbers and ARs. Parallel to the lack of self-similarity in the wall-normal component of the forcing, the reason for not observing self-similarity in the low-energy modes may once again be slower convergence rates for these modes.
Mode centre  $y_h^+$ obtained using
 $\xi _x$ (square) and and
 $\chi _z$ (triangle) at different wavenumbers at sub-dominant frequencies. Each subplot shows results for a different AR. The dashed lines show the
 $1/{\beta ^+}$ trends.

Self-similarity maps  $\gamma _{\boldsymbol {\chi }}$ (a,d,g),
 $\gamma _{\boldsymbol {\phi }}$ (b,e,h) and
 $\gamma _{\boldsymbol {\xi }}$ (c, f,i), for different ARs and
 $\alpha ^+$ values, obtained at sub-dominant frequencies. Panels (a–c), (d–f) and (g–i) correspond to the
 $x$-,
 $y$- and
 $z$-components, respectively.

4. Conclusions
We investigated the self-similarity of wall-attached structures in turbulent channel flows with a view to identifying attached eddies in the boundary layer. A flow database, obtained by direct numerical simulations (DNS), is considered with Reynolds number  $Re_\tau =543$. The analysis is based on the attached-eddy hypothesis (AEH) (Townsend Reference Townsend1976; Perry & Chong Reference Perry and Chong1982), which holds that attached eddies are high-energy-containing structures that dominate the logarithmic region of the boundary layer, and whose size is determined by their distance to the wall. Guided by this definition, we explore self-similarity by considering the wall-normal organisation of streamwise–spanwise Fourier-mode pairs associated with a fixed aspect ratio; we then identify flow structures and forcing modes associated with wall shear in the spanwise direction,
 $\tau _z$. Spanwise wall shear was chosen as the representative quantity for quasi-streamwise vortices. The single-point measurement considered here amounts to a rank-1 system, which allows, within the linear framework provided by the resolvent analysis (Hwang & Cossu Reference Hwang and Cossu2010a; McKeon & Sharma Reference McKeon and Sharma2010; Cavalieri et al. Reference Cavalieri, Jordan and Lesshafft2019; Lesshafft et al. Reference Lesshafft, Semeraro, Jaunet, Cavalieri and Jordan2019), identification of the flow structure associated with the wall shear, i.e. wall-attached structures, and the associated forcing. We used resolvent-based spectral proper orthogonal decomposition (RESPOD) to perform an identification of wall-attached response and forcing modes. The method was compared to the resolvent-based estimation (RBE) approach of Towne et al. (Reference Towne, Lozano-Durán and Yang2020), which yields the minimal-norm forcing to generate a given response. We observe that using a linear scaling between the frequency and the streamwise wavenumber, the resulting wall-attached structures exhibit self-similarity in line with the AEH for a wide range of wavenumbers and aspect ratios. The frequency scaling is determined regarding the linear trend observed in the peak frequency of the power spectral density (PSD) of
 $\tau _z$ with respect to the streamwise wavenumber. Keeping the slope of the linear scaling constant, we observe that self-similarity extends to structures at sub-dominant frequencies as well. Although we do not particularly seek energetic structures, it was shown in Cheng et al. (Reference Cheng, Li, Lozano-Durán and Liu2020), where a number of turbulent channels (including one at
 $Re=550$) were investigated, that the wall-attached structures are dominant regarding the energy that they contain. As we observe self-similarity in wall-attached structures in a wide range of frequencies and aspect ratios, we expect these structures to be relevant in terms of the AEH.
We extend the analysis to investigate such self-similarity for the forcing structures, again, associated with the wall-shear. Our findings reveal that both the minimal-norm forcing required to obtain the measured wall-shear dynamics (obtained by RBE) and the wall-shear-correlated forcing (obtained by RESPOD) that also drives the wall-attached flow structures exhibit self-similar behaviour.
The self-similarity of forcing modes obtained using RBE can be associated with the works of Hwang & Cossu (Reference Hwang and Cossu2010a), Moarref et al. (Reference Moarref, Sharma, Tropp and McKeon2013) and Sharma et al. (Reference Sharma, Moarref and McKeon2017), among others, where it was shown that self-similarity is a property of the resolvent operator. Given the SPOD modes that are self-similar, it may be expected that associated forcing modes predicted by RBE would be self-similar. But the demonstration of a forcing self-similarity using the RESPOD approach illustrates how that self-similarity is indeed present in the actual forcing data, suggesting a self-similar organisation of the nonlinear scale interactions that drive attached eddies. The self-similar forcing structures are shown to lead to elongated streaky structures, which are sustained by the lift-up mechanism, consistent with the discussion of Cossu & Hwang (Reference Cossu and Hwang2017) in which streaks and streamwise vortices participate in the lift-up mechanism as two interconnected elements of a single attached eddy.
The self-similar forcing educed from the DNS data may be used to construct dynamical models of attached eddies, following ideas similar to the works of Moarref et al. (Reference Moarref, Sharma, Tropp and McKeon2013), Hwang & Eckhardt (Reference Hwang and Eckhardt2020) and Skouloudis & Hwang (Reference Skouloudis and Hwang2021). These works superpose coherent structures obtained with the linearised Navier–Stokes operator such that the overall Reynolds stresses are obtained. As presented in this work, RESPOD is an appropriate technique to obtain the forcing that is coherent with a given flow response. The observed self-similarity of the forcing modes may be included in dynamic models of attached eddies for improved predictions of flow properties.
Another promising direction is the use of the identified self-similar forcing to build flow estimators from a limited number of sensors. Linear estimators require assumptions of the forcing, and the quality of predictions depends on the accuracy of the forcing statistics included in the estimation (Chevalier et al. Reference Chevalier, Hœpffner, Bewley and Henningson2006; Martini et al. Reference Martini, Cavalieri, Jordan, Towne and Lesshafft2020; Amaral et al. Reference Amaral, Cavalieri, Martini, Jordan and Towne2021). For wall turbulence, the specification of a self-similar forcing may be a viable approach to construct accurate estimators, especially for high Reynolds numbers for which one cannot obtain DNS data.
Studies of coherent structures in flows have benefited greatly from the analysis of the linearised Navier–Stokes operator, which, by its non-normality, leads to more amplified structures that are more likely observed in a turbulent flow. However, a more refined view is obtained if the actual nonlinear terms, which constitute a forcing in resolvent analysis, are used in the input. The framework developed in this work is not restricted to wall turbulence, and may be used in other flows to extract the properties of nonlinearities driving the observed coherent structures.
Funding
This work has received funding from the Clean Sky 2 Joint Undertaking under the European Union's Horizon 2020 research and innovation programme under grant agreement no. 785303. U.K. has received funding from TUBITAK 2236 Co-funded Brain Circulation Scheme 2 (project no. 121C061).
Declaration of interests
The authors report no conflict of interest.
Appendix A. Linear operators used in resolvent analysis of channel flow
The linear operators used in (3.5) are given as
 \begin{equation}
\boldsymbol{\mathsf{A}}=\begin{bmatrix} \mathcal{L}_k &
-\boldsymbol{\nabla} \\ \boldsymbol{\nabla}^{\rm T} & 0
\end{bmatrix},\quad \boldsymbol{B} =\boldsymbol{\mathsf{M}}=
\begin{bmatrix} \boldsymbol{\mathsf{I}} & 0 & 0 \\ 0 &
\boldsymbol{\mathsf{I}} & 0 \\ 0 & 0 & \boldsymbol{\mathsf{I}} \\ 0 & 0 & 0
\end{bmatrix} \quad \text{and}\quad
\boldsymbol{\mathsf{C}}=\begin{bmatrix} \boldsymbol{\mathsf{I}} & 0 & 0 & 0\\
0 & \boldsymbol{\mathsf{I}} & 0 & 0\\ 0 & 0 & \boldsymbol{\mathsf{I}} & 0
\end{bmatrix},
\end{equation}
where  $\mathcal {L}_k$ is the spatial linear Navier–Stokes operator (McKeon Reference McKeon2017) given as
 \begin{equation} \mathcal{L}_k=\begin{bmatrix} -{\rm i}\alpha U_x + \nabla^2/Re & -\partial_y U_x & 0 \\ 0 & -{\rm i}\alpha U_x + \nabla^2/Re & 0 \\ 0 & 0 & -{\rm i}\alpha U_x + \nabla^2/Re \end{bmatrix}, \end{equation}
where  $\boldsymbol {\nabla }=[\textrm {i}\alpha,\,\partial _y,\,\textrm {i}\beta ]^\textrm {T}$ and
 $\nabla ^2=\partial _y^2 - (\alpha ^2 + \beta ^2)$ are the gradient and Laplace operators, respectively.


 Open access

