Introduction
Risk for psychotic disorders is thought to exist on a continuum (van Os et al., Reference van Os, Linscott, Myin-Germeys, Delespaul and Krabbendam2009) ranging from schizophrenia, to an intermediate help-seeking Clinical High Risk (CHR) syndrome, and, at the lower end, a tendency for frequent subclinical positive symptoms called Psychotic-Like Experiences (PLEs). PLEs are observed in up to 17% of children and 7% of adolescents (Kelleher et al., Reference Kelleher, Connor, Clarke, Devlin, Harley and Cannon2012), but often end by adulthood. However, among those few who exhibit persistent PLEs, there is evidence of a four- to ten-fold increase for psychosis in adulthood (Dominguez et al., Reference Dominguez, Wichers, Lieb, Wittchen and van Os2011; Healy et al., Reference Healy, Brannigan, Dooley, Coughlan, Clarke, Kelleher and Cannon2019; McGrath et al., Reference McGrath, Saha, Al-Hamzawi, Andrade, Benjet, Bromet, Browne, Caldas de Almeida, Chiu, Demyttenaere, Fayyad, Florescu, de Girolamo, Gureje, Haro, ten Have, Hu, Kovess-Masfety, Lim, Navarro-Mateu, Sampson, Posada-Villa, Kendler and Kessler2016).
Recent cohort studies have provided replicated evidence of distinct PLE developmental trajectories during adolescence (Mackie et al., Reference Mackie, O’Leary-Barrett, Al-Khudhairy, Castellanos-Ryan, Struve, Topper and Conrod2013; Thapar et al., Reference Thapar, Heron, Jones, Owen, Lewis and Zammit2012; Yamasaki et al., Reference Yamasaki, Usami, Sasaki, Koike, Ando, Kitagawa, Matamura, Fukushima, Yonehara, Foo, Nishida and Sasaki2018). In a general population sample of 2,566 youths followed between the ages of 13 to 16, three trajectories were identified: 84% of adolescents (n = 2,152) presented a typical trajectory of low PLE levels that decreased further over time, 8% (n = 203) presented high PLE levels that subsequently decreased, and another 8% (n = 211) reported moderate PLE levels that increased (Bourque et al., Reference Bourque, Afzali, O’Leary-Barrett and Conrod2017). Our studies suggest that both trajectories can exhibit symptoms, with the increasing trajectory exhibiting more positive psychotic symptoms while the decreasing trajectory displays more negative symptoms (Reference Assaf, Ouellet, Bourque, Stip, Leyton, Conrod and Potvin2022a, Assaf et al., Reference Assaf, Ouellet, Bourque, Stip, Leyton, Conrod and Potvin2022b). These distinct clinical profiles support the use of PLE trajectories in the investigation of psychosis development before disease onset, with the additional benefit of limiting the confounding effects of antipsychotic medications. Further research is required to better characterize the neurocognitive markers and clinical outcomes of these risk trajectories.
The clinical presentation of psychotic disorders includes not only positive symptoms such as hallucinations and delusions, but also negative symptoms and deficits in social cognition such as impaired emotion processing, social perception, mentalizing, and attributional biases (Adolphs, Reference Adolphs1999; Green et al., Reference Green, Horan and Lee2019; Ochsner, Reference Ochsner2008; Picó-Pérez et al., Reference Picó-Pérez, Vieira, Fernández-Rodríguez, Barros, Radua and Morgado2022). In fact, deficits in social cognition are among the most pronounced impairments in youth at psychosis risk (Donkersgoed et al., Reference Donkersgoed, Wunderink, Nieboer, Aleman and Pijnenborg2015; Kozhuharova et al., Reference Kozhuharova, Saviola, Ettinger and Allen2020; Lee et al., Reference Lee, Hong, Shin and Kwon2015). Social cognition comprises multiple domains, including theory of mind, social perception, social knowledge, attributional bias, and emotion processing (Savla et al., Reference Savla, Vella, Armstrong, Penn and Twamley2013). In the context of neuroimaging, social cognition is shown to consist of two main subsystems: (1) socio-affective processes that shape the perception and integration of emotions relating to others, and (2) socio-cognitive processes that allow an understanding of others through mentalizing and self-generated cognition (Kanske et al., Reference Kanske, Böckler, Trautwein and Singer2015, Reference Kanske, Böckler, Trautwein, Parianen Lesemann and Singer2016; Schurz et al., Reference Schurz, Radua, Tholen, Maliske, Margulies, Mars, Sallet and Kanske2021). Within this framework, the socio-affective subsystem is thought to consist of the anterior insula (AI), the inferior frontal gyrus, the anterior and middle cingulate cortex, the supplementary motor area, the amygdala, and the thalamus (Alcalá-López et al., Reference Alcalá-López, Vogeley, Binkofski and Bzdok2019; Bzdok et al., Reference Bzdok, Schilbach, Vogeley, Schneider, Laird, Langner and Eickhoff2012; Kanske et al., Reference Kanske, Böckler, Trautwein and Singer2015), overlapping with the emotional salience network (SN). The socio-cognitive subsystem is thought to comprise the medial prefrontal cortex, the posterior cingulate cortex (PCC), the precuneus, the temporoparietal junction, the temporal pole, the superior temporal sulcus, and the inferior parietal lobule (Bzdok et al., Reference Bzdok, Schilbach, Vogeley, Schneider, Laird, Langner and Eickhoff2012; Kanske et al., Reference Kanske, Böckler, Trautwein and Singer2015; Schilbach et al., Reference Schilbach, Bzdok, Timmermans, Fox, Laird, Vogeley and Eickhoff2012), regions that correspond to the default-mode network (DMN).
Dysconnectivity of these large-scale resting-state networks has been associated with risk for psychosis and severity of psychotic symptoms (Dong et al., Reference Dong, Wang, Chang, Luo and Yao2018; Pelletier-Baldelli et al., Reference Pelletier-Baldelli, Andrews-Hanna and Mittal2018; Satterthwaite & Baker, Reference Satterthwaite and Baker2015). For instance, first-episode psychosis was shown to be associated with DMN within-network hypoconnectivity, SN to DMN hypoconnectivity, and hypoconnectivity between the SN and the central executive network (O’Neill et al., Reference O’Neill, Mechelli and Bhattacharyya2019). Other meta-analyses have showed within-network hypoconnectivity in the DMN, affective network, ventral attention network, thalamic network, and somatosensory networks, as well as between-network dysconnectivity (Dong et al., Reference Dong, Wang, Chang, Luo and Yao2018; Li et al., Reference Li, Hu, Zhang, Tao, Dai, Gong, Tan, Cai and Lui2019). One recent study of early onset psychosis found reduced DMN connectivity compared to healthy subjects (Hilland et al., Reference Hilland, Johannessen, Jonassen, Alnæs, Jørgensen, Barth, Andreou, Nerland, Wortinger, Smelror, Wedervang-Resell, Bohman, Lundberg, Westlye, Andreassen, Jönsson and Agartz2022). In at-risk individuals, a similar array of network dysconnectivity is reported, with a recent meta-analysis of CHR subjects highlighting hypoconnectivity most prominently within the salience network (Del Fabro et al., Reference Del Fabro, Schmidt, Fortea, Delvecchio, D’Agostino, Radua, Borgwardt and Brambilla2021).
Fewer studies have investigated resting-state alterations in non-clinical individuals reporting PLEs. One study showed an association between PLE level and global efficiency of the DMN (Sheffield et al., Reference Sheffield, Kandala, Burgess, Harms and Barch2016). Another study using principal independent-component analysis found that more severe positive psychotic experiences were associated with reduced cortico-striatal connectivity, while negative psychotic experiences were associated with increased striatal-motor connectivity (Sabaroedin et al., Reference Sabaroedin, Tiego, Parkes, Sforazzini, Finlay, Johnson, Pinar, Cropley, Harrison, Zalesky, Pantelis, Bellgrove and Fornito2019). In a longitudinal study following children at ages 9 and 11, higher PLE levels were associated with decreased within-network connectivity in the DMN, the SN, and the cingulo-parietal network, and increased connectivity between the cerebellum and the SN and the cingulo-parietal network (Karcher et al., Reference Karcher, O’Brien, Kandala and Barch2019). In summary, these studies show that PLEs are associated with a complex pattern of dysconnectivity involving mostly the SN and DMN networks. Indeed, we too have found that atypical PLE trajectories present task-based activation and connectivity changes in brain regions of the SN involved in emotional salience and regions of the DMN during self-other processing (Reference Assaf, Ouellet, Bourque, Stip, Leyton, Conrod and Potvin2022a, Assaf et al., Reference Assaf, Ouellet, Bourque, Stip, Leyton, Conrod and Potvin2022b).
In summary, the SN and DMN are widely investigated networks in the resting-state neuroimaging literature, and alterations of these networks have been identified in schizophrenia (Green et al., Reference Green, Horan and Lee2019; Picó-Pérez et al., Reference Picó-Pérez, Vieira, Fernández-Rodríguez, Barros, Radua and Morgado2022) and in at-risk individuals (Donkersgoed et al., Reference Donkersgoed, Wunderink, Nieboer, Aleman and Pijnenborg2015; Kozhuharova et al., Reference Kozhuharova, Saviola, Ettinger and Allen2020). However, resting-state functional connectivity of social cognition networks has not been assessed in pre-clinical atypical PLE trajectories. Therefore, the current study aimed to investigate changes in areas of the SN and the DMN at rest in PLE trajectories to determine whether these networks present connectivity changes that echo alterations observed during socio-emotional tasks. For this purpose, we evaluated within- and between-network connectivity in the socio-affective network and the socio-cognitive network during resting-state in the different PLE trajectories, considering that resting-state functional connectivity analyses are largely employed to investigate not only within-network but also between-network alterations (Li et al., Reference Li, Hu, Zhang, Tao, Dai, Gong, Tan, Cai and Lui2019; Menon et al., Reference Menon, Schmitz, Anderson, Graff, Korostil, Mamo, Gerretsen, Addington, Remington and Kapur2011).
Methods
Study design and recruitment
The Pro-Venture study, currently ongoing, is a longitudinal neuroimaging study that tracks adolescents who were identified through the PLE trajectories during 5 years of adolescence (12–17 years) (O’Leary-Barrett et al., Reference O’Leary-Barrett, Mâsse, Pihl, Stewart, Séguin and Conrod2017). In the Co-Venture cohort, 3,966 Grade 7 students from 31 high schools of the greater Montreal area participated in annual clinical assessments from 12 to 17 years of age. As previously described, to determine group-based trajectories, the 4-year data (from ages 12 to 16) was used with growth mixture models that were then fitted with different models ranging from one to four trajectories. Full Information Maximum Likelihood was used to handle missing data on PLE scores. The best-fitting model was determined using the Bayesian Information Criterion, the Akaike Information Criterion, the Lo-Mendell-Rubin Likelihood Ratio Test, and entropy. This approach identified three developmental trajectories of PLEs: a low-decreasing trajectory (control group, PLE-0), a high-decreasing trajectory (decreasing group, PLE-1), and a moderate-increasing trajectory (increasing group, PLE-2) (Bourque et al., Reference Bourque, Afzali, O’Leary-Barrett and Conrod2017).
The Pro-Venture sub-cohort comprises 92 adolescents (PLE-0 n = 44; PLE-1 n = 22; PLE-2 n = 26) aged 16 to 21 at entry (mean age 17.98, SD = 1.06; 55.4% girls). Co-Venture participants who had consented to being contacted for future research were identified from the three trajectories and recruited randomly. The results in the present manuscript are based on data collected during the first neuroimaging assessment. The study received ethical approval from the CHU Sainte-Justine Research Ethics Committee in Montreal. Participants gave written informed consent to the study procedures, and parental informed consent was obtained for minors.
Exclusion criteria
Participants were excluded from the study if they reported a DSM-5 psychiatric disorder, a family history of schizophrenia, taking antipsychotic medication, neurological disorders, an IQ < 70 or a contraindication to undergo MRI examination. A urinary drug screening test was administered to assess recent substance use, and participants who tested positive for alcohol, MDMA, cocaine or opioids were required to reschedule their neuroimaging session. Individuals who tested positive for cannabis metabolites but reported not having consumed cannabis within 24h and showed no sign of intoxication took part in testing since these metabolites can appear in urine samples up to 7 days after consumption.
Clinical and behavioral assessments
To determine the trajectories for adolescent PLEs, which include hallucinations, delusional beliefs, suspiciousness, strange experiences, and feelings of grandiosity, nine items were taken from the Adolescent Psychosis Screening Scale (Bourque et al., Reference Bourque, Afzali, O’Leary-Barrett and Conrod2017; Laurens et al., Reference Laurens, Hodgins, Maughan, Murray, Rutter and Taylor2007) and assessed every year from grade 4 to 10. Three of the questionnaire’s items were shown to have significant positive predictive power for psychotic experiences verified through interviews, with predictive accuracy ranging from 80% to 100% (Kelleher et al., Reference Kelleher, Harley, Murtagh and Cannon2011). During the first timepoint of the follow-up Pro-Venture study, the DEP-ADO questionnaire was used to determine substance use levels during the past 12 months (Landry et al., Reference Landry, Tremblay, Guyon, Bergeron and Brunelle2004), with participants rating their consumption of alcohol, tobacco, cannabis and other substances on a 6-level scale ranging from “never” to “everyday” (Bernard et al., Reference Bernard, Bolognini, Plancherel, Chinet, Laget, Stephan and Halfon2005). Additionally, the Community Assessment of Psychic Experiences (CAPE) questionnaire was used to measure positive psychotic symptoms, negative symptoms, and depression (Konings et al., Reference Konings, Bak, Hanssen, Os and Krabbendam2006).
Social cognition performance was also assessed using a mentalizing task and a facial emotion recognition task. The mentalizing (Theory of Mind) task was adapted from Achim et al, and included 30 stories (Achim et al., Reference Achim, Ouellet, Roy and Jackson2012). Participants were presented with stories in which one character has a false idea about another character’s beliefs (false beliefs), which served as a measure of second-order mentalizing, as well as items assessing nonsocial reasoning and first-order inference, and items controlling for inattention and false positives. The percentage of correct answers were determined for each category. To assess facial emotion recognition performance, we used the Penn Emotion Recognition task ER-40 during which participants are presented with 40 images of different facial emotions, with high and low emotion intensity, and have to correctly identify them (Gur et al., Reference Gur, Sara, Hagendoorn, Marom, Hughett, Macy, Turner, Bajcsy, Posner and Gur2002).
MRI acquisition parameters
Blood Oxygenated Level Dependent (BOLD) data were acquired using a 3-Tesla Prisma Fit scanner (Unité de Neuroimagerie Fonctionnelle de l’Institut de Gériatrie de l’Université de Montréal). High-resolution T1-weighted anatomical images were acquired (TR = 2300 ms; TE = 2.98 ms; FA = 9°; matrix size = 256x256; voxel size = 1 mm3; 176 slices). Resting-state functional imaging data were obtained during a ten-minute sequence using a T2-weighed multiband echo planar imaging (EPI) sequence (TR = 785 ms; TE = 30 ms; FA = 54°; matrix size 64x64, voxel size 3 mm3; 42 slices). The functional slices were angled to be parallel to the AC-PC line, with an inline retrospective motion correction algorithm during EPI image acquisition. The first 10 s of scanning were excluded to allow for magnetic stabilization.
fMRI preprocessing
The CONN-fMRI functional connectivity toolbox was used to process the neuroimaging data (www.nitrc.org/projects/conn) (Whitfield-Gabrieli & Nieto-Castanon, Reference Whitfield-Gabrieli and Nieto-Castanon2012). Functional data were realigned, corrected for motion artifacts with the artifact detection tools (Power, Reference Power2014) setting a threshold of 0.9 mm for framewise displacement and a global signal threshold of Z = 5 as recommended by Power et al., Reference Power, Barnes, Snyder, Schlaggar and Petersen2012. No more than 5% of acquired volumes were scrubbed for each subject, therefore no subjects were excluded from the analysis. Functional images were co-registered to the corresponding anatomical image. Anatomical images were segmented and normalized to Montreal Neurological Institute stereotaxic space. An 8-mm full width-at-half-maximum Gaussian kernel was used to smooth the functional images. Physiological noise caused by white matter and cerebrospinal fluid was removed from the BOLD timeseries (Chai et al., Reference Chai, Castañón, Öngür and Whitfield-Gabrieli2012) using the anatomical component-based noise correction method (CompCor) (Behzadi et al., Reference Behzadi, Restom, Liau and Liu2007). A band pass filter (0.008-0.09 Hz) was used to diminish the impact of low-frequency drifts and physiological high-frequency noise, and linear detrending was also implemented.
fMRI analyses
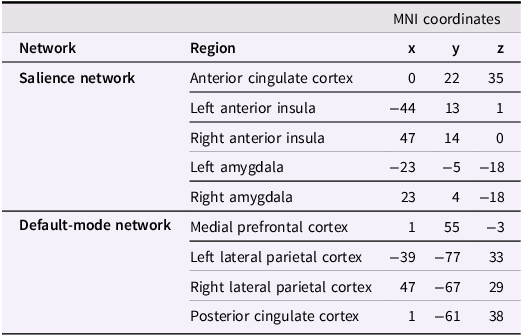
Regions of interests (ROIs) for the DMN and SN are listed in Table 3 and were based on the network atlas implemented in the CONN toolbox which is based on independent-component analysis of the Human Connectome Project (497 subjects) (Whitfield-Gabrieli & Nieto-Castanon, Reference Whitfield-Gabrieli and Nieto-Castanon2012) and provide a better reprensentaiton of functional networks compared to anatomical atlases. To study the extended emotional salience network, we added the amygdala using the ROIs from the Harvard Oxford atlas. ROIs for the SN were the anterior cingulate cortex, the right and left AI, and the bilateral amygdalae. ROIs for the DMN were the medial prefrontal cortex (mPFC), the right and left lateral parietal cortices, and the PCC.
In the first-level ROI-to-ROI analyses, bivariate correlation coefficients were calculated for each subject between the average time-courses for each ROI pair of the DMN, of the SN and of both networks. These correlation coefficients were transformed into Z-scores using the Fisher transformation, and then used for second-level analyses.
Within- and between-network connectivity were determined using the Matlab command line script conn_withinbetweenROItest, which extracted and exported single-subject correlation values. Between-group differences in these estimates were assessed using full ANOVAs.
Finally, seed-to-voxel analyses were also conducted, calculating correlation coefficients between the average time-course for the mPFC, the bilateral AI and the bilateral amygdala, and the time-courses of all other brain voxels. These regions were selected as seeds considering the key role they play in each of the DMN and SN networks (Alcalá-López et al., Reference Alcalá-López, Vogeley, Binkofski and Bzdok2019; Bzdok et al., Reference Bzdok, Schilbach, Vogeley, Schneider, Laird, Langner and Eickhoff2012; Schilbach et al., Reference Schilbach, Bzdok, Timmermans, Fox, Laird, Vogeley and Eickhoff2012). Between-group differences were evaluated using pairwise t-tests. For both the ROI-to-ROI and seed-to-voxels analyses, the statistical threshold was set at p < 0.05, corrected for the False Discovery Rate (FDR). The estimated parameters of regressors in the weighted GLM model were extracted for all significant results.
Statistical analyses
Between-group differences in continuous behavioral data, such as age, substance use, and clinical scores, were analyzed using ANOVAs (analysis of variance), and post-hoc analyses were conducted using Tukey’s Honestly Significant Difference test. For dichotomous data, such as sex and handedness, chi-square tests and pairwise comparisons were performed. Significance was set at p < 0.05. Bivariate Pearson correlation analyses were performed to examine the relationship between behavioral variables (e.g., substance use and behavioral scores) and connectivity strength estimates. These correlation analyses were conducted both across and within groups, with a significance threshold of p ≤ 0.05, Bonferroni corrected.
Results
Demographic and behavioral data
Demographic variables for the three trajectories are reported in Table 1. No significant group differences were found for age, sex, or handedness.
Demographic characteristics

SD = standard deviation; p-uncorrected.
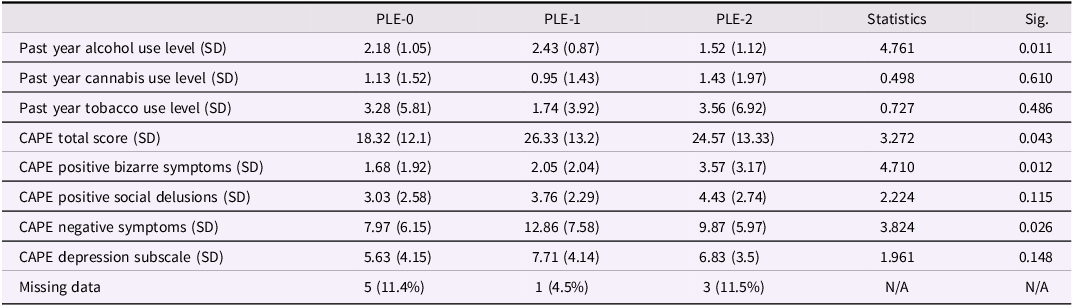
Substance use and behavioral questionnaires revealed some differences, as presented in Table 2. The increasing PLE-2 trajectory displayed slightly lower levels of past year alcohol use compared to the control PLE-0 and the decreasing PLE-1 trajectories, but no group differences were found for past year use level of cannabis or tobacco.
Behavioral measures

CAPE = community assessment of psychic experiences; SD = standard deviation; p-uncorrected.
As expected, group differences were evident for psychotic symptoms. As previously reported, the decreasing PLE-1 trajectory reported more negative symptoms compared to the control group. The increasing PLE-2 trajectory reported more positive bizarre symptoms compared to the control group.
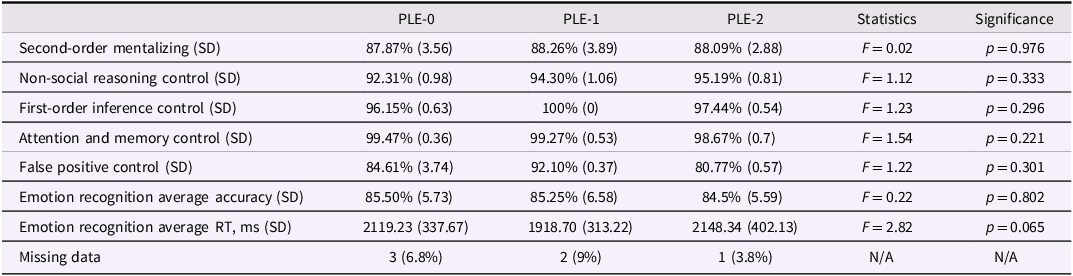
Finally, we did not find significant group differences in performance on the Theory of Mind task or facial emotion recognition task (Table 3).
Cognitive measures (theory of mind and facial emotion recognition tasks)

The theory of mind task measured second-order mentalizing, control items tested nonsocial reasoning, first-order inference, questions to control for attention and memory effect, and items to control for false positives; mean percentage of correct answers in each category; SD = standard deviation; RT = reaction time; p-uncorrected.
Functional connectivity data
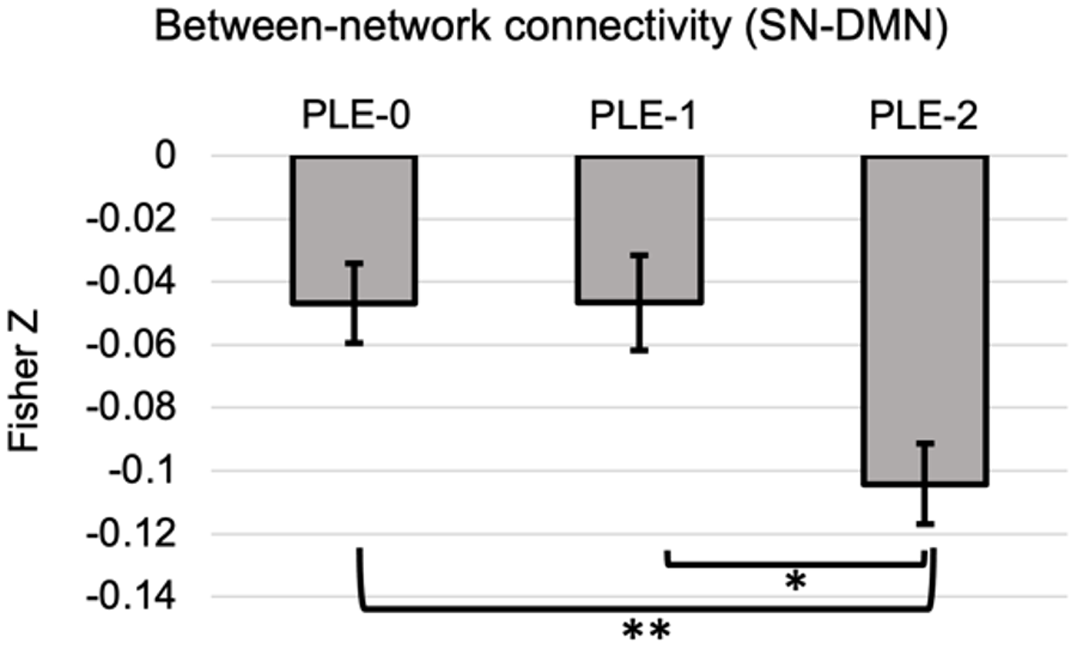
Network-level functional connectivity results for the SN and DMN are reported in Figure 1. Significant group differences were found in between-network connectivity, with the increasing trajectory displaying hypoconnectivity between the SN and DMN compared to the control PLE-0 (p < 0.01, passes the Bonferroni correction). At the voxel-level, no differences in within-network connectivity were observed between groups for either the DMN or SN.
Group differences in between-network connectivity scores. Bar graphs showing network functional connectivity between the salience network and default-mode network in the three trajectories (PLE-0 = control trajectory; PLE-1 = decreasing trajectory; PLE-2 = increasing trajectory). The bar graph show connectivity estimate scores and the standard error bars. * p < 0.05, ** p < 0.01 (passes the Bonferroni correction).

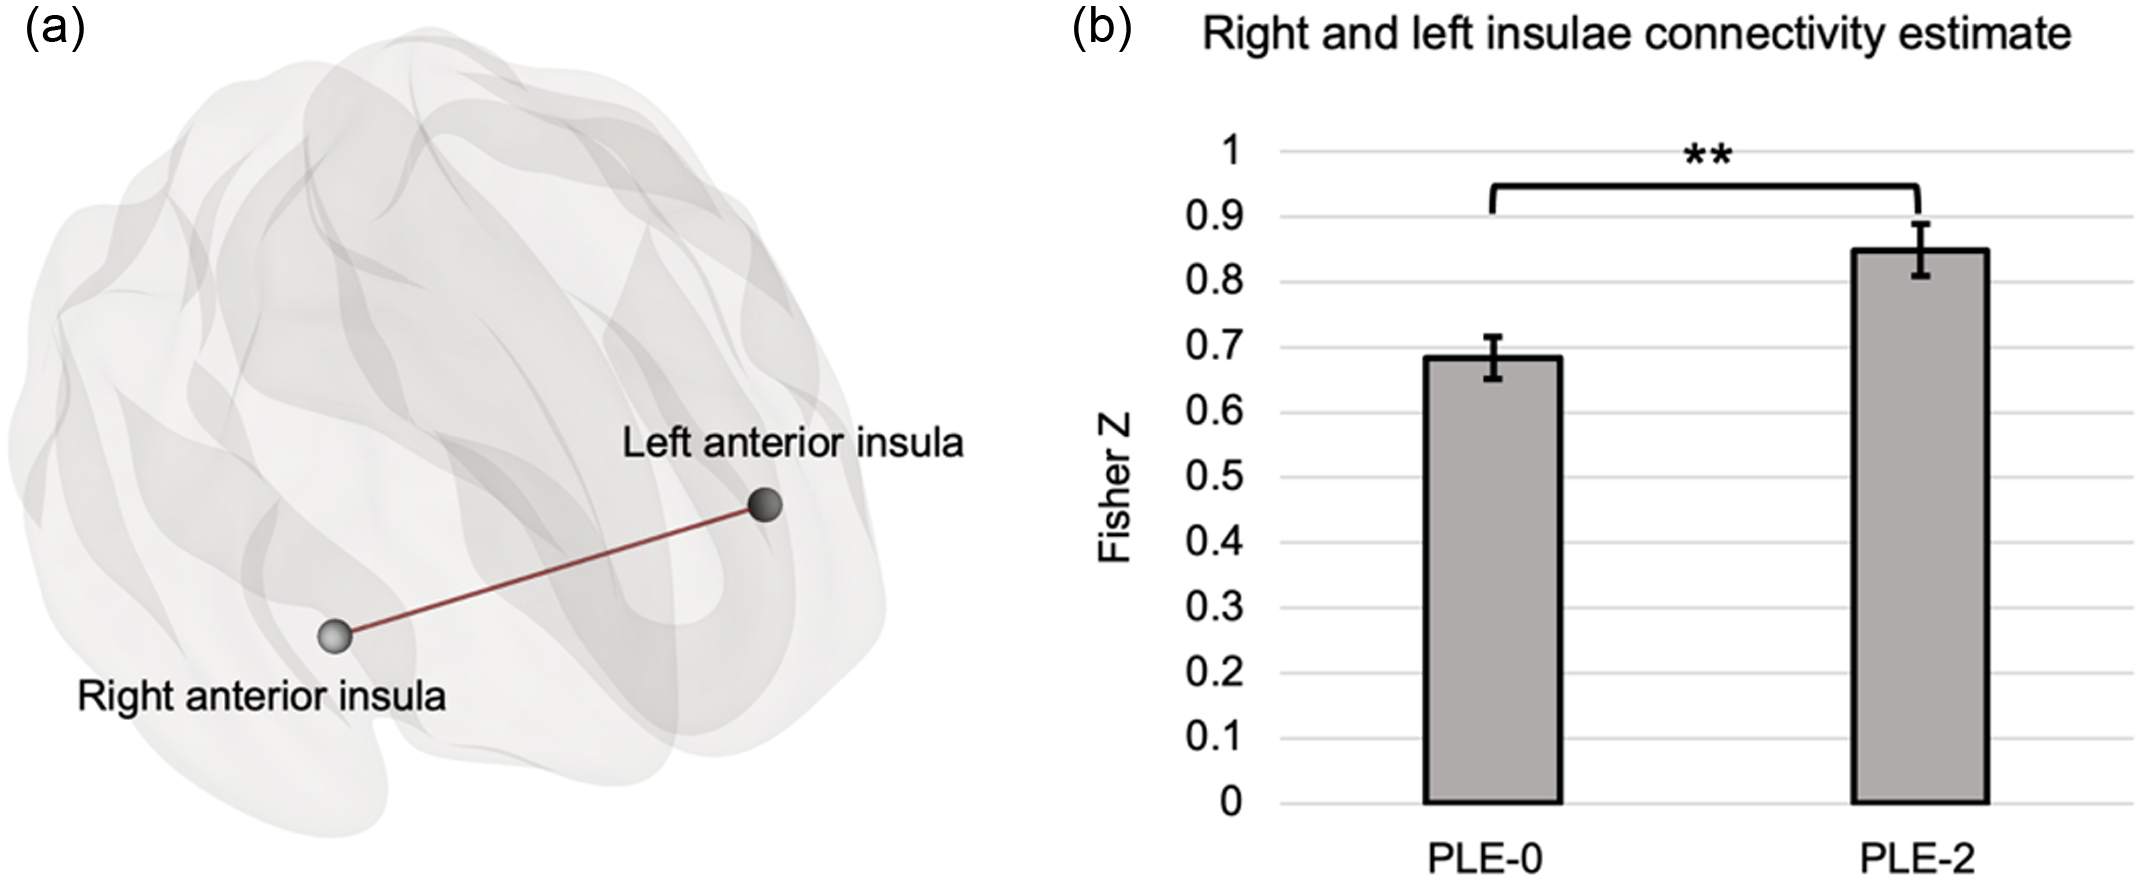
Consequently, ROI-to-ROI analyses were conducted with the nine SN and DMN ROIs (Table 4), to dissect the network-level alterations in the increasing PLE-2 trajectory in comparison to the control trajectory PLE-0 (connection threshold p-uncorrected < 0.01; cluster threshold p-false discovery rate (FDR) corrected < 0.05). This showed a significant difference in connectivity only between the left and right insulae (Figure 2a), reflecting hyperconnectivity in the increasing trajectory compared to the control group (Figure 2b). No significant difference was found between PLE-1 and the two other trajectories regarding the functional connectivity between the left and right insula.
Regions of interest (ROI)-to-ROI differences between the control (PLE-0) and increasing (PLE-2) trajectories. (a) ROI-based inference (parametric multivariate statistics): connection threshold p-uncorrected < 0.01; cluster threshold p-FDR corrected < 0.05. (b) Bar graph showing right and left insulae connectivity estimate score and standard error bars (PLE-0 = control trajectory; PLE-2 = increasing trajectory), ** p < 0.01.

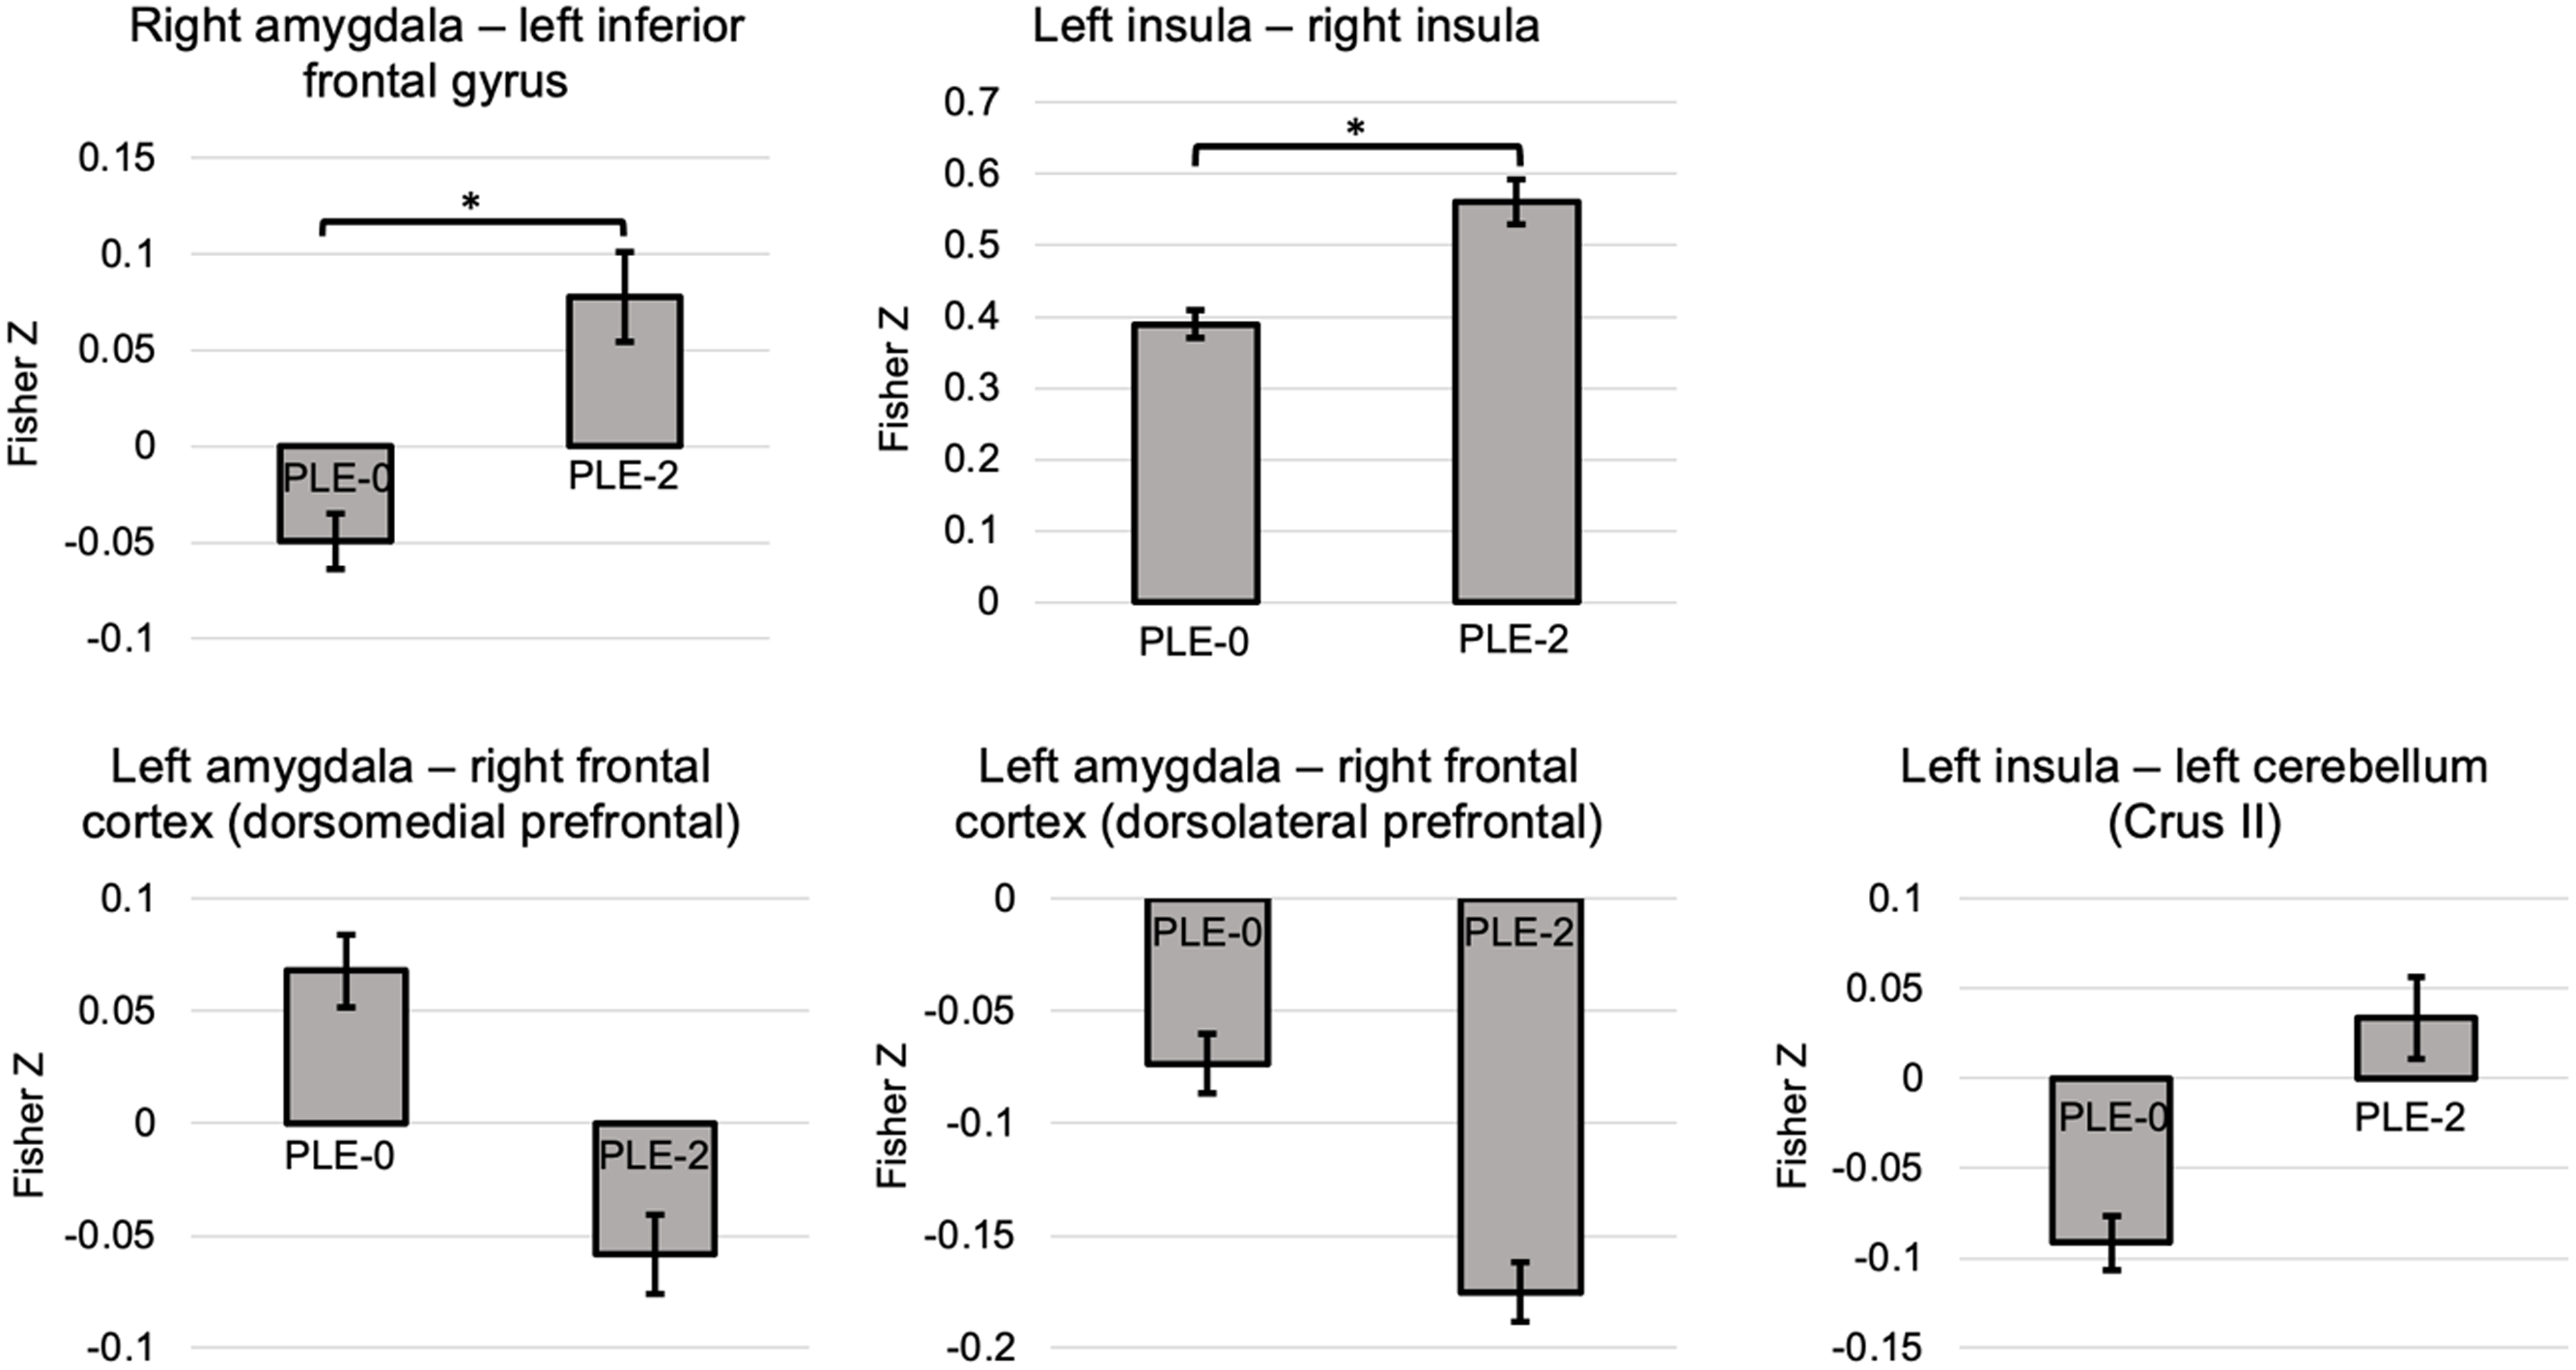
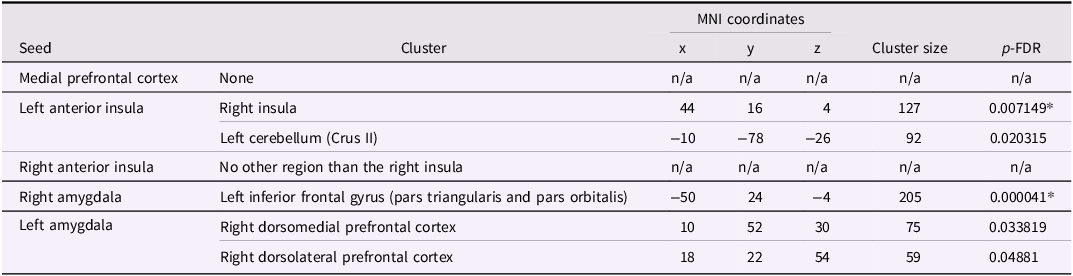
To further investigate the observed network-level differences, seed-to-voxel analyses were conducted using the mPFC, bilateral insula and bilateral amygdala as seeds (connection threshold p-uncorrected < 0.01; cluster threshold p-FDR corrected < 0.05). Results are reported in Table 4 and Figure 3. The mPFC and the right AI did not display significant differences in voxel-wide connectivity (Table 5). The increasing trajectory exhibited significantly increased connectivity between the right amygdala and the left inferior frontal gyrus, and between the left and right insula (Figure 3). These results survived a Bonferroni correction that accounted for multiple testing (e.g. 5 seeds, p-Bonferroni corrected < 0.05). Noteworthy, no differences were found between PLE-1 and the two other trajectories regarding these two connections. Other regions showed significant dysconnectivity that did not survive a Bonferroni correction, with hypoconnectivity between the left amygdala and the right dorsomedial prefrontal cortex and right dorsolateral prefrontal cortex, and hyperconnectivity between the left insula and left cerebellum crus II (Figure 3).
Seed-to-voxel connectivity scores between the control (PLE-0) and increasing (PLE-2) trajectories. Bar graphs showing network functional connectivity between the salience network and default-mode network in the three trajectories (PLE-0 = control trajectory; PLE-2 = increasing trajectory). The bar graph show connectivity estimate scores and standard error bars. * p-Bonferroni-corrected<0.05.

Salience and default-mode network Regions of interests definition

Correlation and covariance analyses
No significant correlations were found between functional connectivity measures and substance use (alcohol and cannabis), as well as demographic, behavioral and cognitive measures. Differences (ROIs-to-ROIs & seed-to-voxel) between PLE-2 and PLE-0 remained significant after including alcohol as a covariable.
Discussion
The current study showed that atypical PLE trajectories with different profiles of negative and positive psychotic symptoms have different resting-state network connectivity patterns. Specifically, the increasing PLE-2 trajectory is associated with (i) reduced network connectivity between the SN and DMN, (ii) altered functional connectivity within the SN including increased connectivity between the left and right insulae, and (iii) changes in seed-to-voxel connectivity from SN seeds.
SN-DMN between-network alterations
As postulated, we found network-level connectivity changes between the SN and DMN. The increasing PLE-2 trajectory displayed reduced SN-DMN connectivity, suggesting a dysfunction in large-scale between-network connectivity in this group. Since the SN is thought to play a role in coordinating network-switching in response to external and internal stimuli (Uddin, Reference Uddin2015), this could promote impairments to SN-DMN switching in the increasing PLE trajectory. Given the role of the SN in regulating the switch between the DMN and the Central Executive Network (V. Goulden et al., Reference Goulden, Khusnulina, Davis, Bracewell, Bokde, McNulty and Mullins2014; Menon & Uddin, Reference Menon and Uddin2010), this could also impair switching between these key networks. In line with our results, a meta-analysis of early psychosis showed reduced SN-DMN connectivity (O’Neill et al., Reference O’Neill, Mechelli and Bhattacharyya2019). Despite this, other analyses identified hyperconnectivity between these networks in schizophrenia (Dong et al., Reference Dong, Wang, Chang, Luo and Yao2018). Likewise, a meta-analysis of CHR individuals reported a positive correlation between symptom severity and SN-DMN connectivity, although this association was found with negative rather than positive symptoms (Del Fabro et al., Reference Del Fabro, Schmidt, Fortea, Delvecchio, D’Agostino, Radua, Borgwardt and Brambilla2021). Therefore, the literature suggests that SN-DMN connectivity is altered along the psychosis continuum, but the direction of change is not well defined, probably due to the heterogeneity of clinical phenotypes.
SN within-network alterations
Based on findings of hypoconnectivity within the SN and DMN in the schizophrenia literature (Dong et al., Reference Dong, Wang, Chang, Luo and Yao2018; O’Neill et al., Reference O’Neill, Mechelli and Bhattacharyya2019), we expected to find a similar within-network reduction of connectivity in the increasing PLE-2 trajectory. Although the increasing trajectory did not display network-level changes within the two networks at the voxel-wise level, we did find altered connectivity within the SN at the level of ROI-to-ROI connectivity analyses, with hyperconnectivity being observed between the bilateral anterior insulae. It is worth noting that while the meta-analysis of CHR subjects found hypoconnectivity within the SN, this was at an uncorrected-significance level (Del Fabro et al., Reference Del Fabro, Schmidt, Fortea, Delvecchio, D’Agostino, Radua, Borgwardt and Brambilla2021). The results observed here could indicate a more specific insular alteration. The AI has been shown to play a role not only in the representation of peripheral autonomic states (Critchley et al., Reference Critchley, Corfield, Chandler, Mathias and Dolan2000) but also in social cognition through interoception and the representation and understanding of bodily and emotional states relevant to the self and others (Chen et al., Reference Chen, Schloesser, Arensdorf, Simmons, Cui, Valentino, Gnadt, Nielsen, Hillaire-Clarke, Spruance, Horowitz, Vallejo and Langevin2021; Craig, Reference Craig2009; Lamm & Singer, Reference Lamm and Singer2010). The AI is also thought to play a role in the development of psychosis: its volume is reduced in schizophrenia and several task-based fMRI studies have shown functional alterations in this region in different socio-emotional contexts (Sheffield et al., Reference Sheffield, Rogers, Blackford, Heckers and Woodward2020; Sheffield et al., Reference Sheffield, Huang, Rogers, Blackford, Heckers and Woodward2021; Wylie & Tregellas, Reference Wylie and Tregellas2010).
SN seed-to-voxel connectivity
Seed regions from the SN displayed additional functional connectivity changes in the increasing PLE-2 trajectory. In fact, we noted increased connectivity between the right amygdala and the left inferior frontal gyrus, pars triangularis extending to the orbital part. While the left inferior frontal gyrus is well-known to play a key role in language processing (e.g. production and comprehension) (Friederici et al., Reference Friederici, Opitz and von Cramon2000; Heim et al., Reference Heim, Eickhoff, Friederici and Amunts2009), its rostroventral/orbital part has been consistently implicated in emotion regulation (Kohn et al., Reference Kohn, Eickhoff, Scheller, Laird, Fox and Habel2014). Likewise, the increasing PLE trajectory was associated with impaired functional connectivity between the left amygdala and the right dorsolateral prefrontal cortex (dlPFC). A meta-analysis of amygdala-prefrontal connectivity highlighted that the amygdala exhibits altered connectivity with the dorsolateral PFC during emotion regulation in healthy volunteers (Berboth & Morawetz, Reference Berboth and Morawetz2021). The dlPFC plays a critical role in superior executive functions (Brunoni & Vanderhasselt, Reference Brunoni and Vanderhasselt2014) and has been shown to be impaired in several fMRI studies in schizophrenia, as well as in individuals at risk for psychosis (Andreou & Borgwardt, Reference Andreou and Borgwardt2020; Baker et al., Reference Baker, Holmes, Masters, Yeo, Krienen, Buckner and Öngür2014; Niendam et al., Reference Niendam, Lesh, Yoon, Westphal, Hutchison, Daniel Ragland, Solomon, Minzenberg and Carter2014; Smucny et al., Reference Smucny, Dienel, Lewis and Carter2022). Taken together, these functional connectivity alterations may suggest that the increasing PLE trajectory presents impairments in emotion regulation, supporting our findings of impairments in functional activation and connectivity during facial emotion processing (Assaf et al., Reference Assaf, Ouellet, Bourque, Stip, Leyton, Conrod and Potvin2022b). Notably, the left amygdala showed decreased connectivity with the right dorsomedial PFC, a key region of the DMN which is involved in the processing of social information (Wittmann et al., Reference Wittmann, Kolling, Faber, Scholl, Nelissen and Rushworth2016, Reference Wittmann, Trudel, Trier, Klein-Flügge, Sel, Verhagen and Rushworth2021) and displays functional alterations in schizophrenia (Potvin et al., Reference Potvin, Gamache and Lungu2019). Additionally, we found that the left AI displayed increased connectivity with the left cerebellum (Crus II), a region that is involved in social mentalizing (Van Overwalle et al., Reference Van Overwalle, Ma and Heleven2020). These latter results could indicate impaired salience attribution during mentalizing at rest, complementing our previous findings of altered mentalizing during self-other processing in this increasing PLE trajectory (Assaf et al., Reference Assaf, Ouellet, Bourque, Stip, Leyton, Conrod and Potvin2022a). Together, these findings suggest that the increasing trajectory is associated with functional alterations in the socio-affective and socio-cognitive processing networks at rest, similar to what we have previously reported with social cognition tasks in both schizophrenia patients and individuals at risk for psychosis.
Limitations
This study presents some limitations. Notably, it included a limited number of participants from the three PLE trajectories. This may be due to the fact that youth in this age group, and especially at-risk youth, can be more difficult to recruit and are less likely to take part in research. While this study’s results showed between-network differences in functional connectivity at the voxel-level, we did not find any significant individual ROI-to-ROI differences that could account for these differences. This may suggest that there are smaller ROI-to-ROI connectivity differences that additively lead to the detection of the network-level alteration. Additionally, we did not find significant correlations between clinical or behavioral measures and SN-DMN connectivity scores. This could be explained by the fact that at this early age, this general population sample does not yet exhibit psychotic symptoms that are severe or persistent enough to show a correlation with brain connectivity measures. In the future, youth on the atypical trajectories may show worsening symptoms relating to the reported functional changes. Nevertheless, this study showed that the increasing adolescent PLE trajectory presents significant functional connectivity alterations that may be relevant to the development of psychosis.
In conclusion, the present study showed that youth on the increasing PLE trajectory display altered resting-state SN-DMN connectivity, similar to what the literature has shown in schizophrenia, and to a lesser extent, in CHR individuals. These findings suggest that this atypical trajectory presents functional alterations in networks involved in social cognition. Since social cognition is known to be altered in schizophrenia both at a neural and behavioral level, our results support the proposition that functional changes in this domain may be occurring during the prodromal stage before the onset of clinical symptoms. Furthermore, these resting-state results echo our previous findings of task-based functional changes in networks of social cognition, suggesting a consistent pattern of alterations across different functional paradigms and contexts. Together, these findings highlight the relevance of studying atypical PLE trajectories to investigate the early development of psychosis. Future studies should investigate the evolution of functional changes in at-risk youths to further characterize the early developmental stages of psychotic disorders. More specifically, further research could also focus on anterior insular connectivity, examining the role of the different insular subdivisions since there is emerging evidence to suggest that these play complementary roles in the underlying mechanisms of psychosis. Additionnaly, it would be interesting to investigate changes in other neural networks, including auditory and language networks, as well as the complex neural networks involved in neurocognitive processes.
Seed-to-voxel differences between the control PLE-0 and increasing PLE-2 trajectories

*p-Bonferroni corrected < 0.05.
Data availability statement
The data are not publicly available as they contain information that could compromise research participant privacy/consent. The data that support the findings of this study are available upon reasonable request from the corresponding author SP but are only redistributable to researchers engaged in Institutional Review Board (IRB) approved research collaborations.
Acknowledgments
SP is holder of the Eli Lilly Canada Chair on schizophrenia research; JB is holder of a postdoctoral fellowship from the Canadian Institutes of Health Research; PC is supported through a senior research fellowship from the Fonds de recherche du Québec – Santé, and the following research chair: Fondation Julien/Marcelle et Jean Coutu en Pédiatrie Sociale en Communauté de l’Université de Montréal.
Author contribution
SP, PC, and JB designed the study; RA and JO acquired the clinical and neuroimaging data; RA and SP performed the analyses; RA, SP, and ML wrote the manuscript. SP, PC, ML, and ES secured funding; JO, JB, ES, and PC provided critical comments. All authors approved the final version of the manuscript.
Funding statement
This study was funded by two grants from the Canadian Institutes of Health Research (FRN148561; FRN114887).
Competing interests
None.