1. Introduction
The experimental study of phonological learning has developed rapidly in recent years, providing a new kind of data about the biases that guide learning. As our knowledge has progressed, it has become clear that many experiments, results and models in phonological learning have close parallels in work on non-linguistic learning (Finley & Badecker Reference Finley, Badecker, Ohlsson and Catrambone2010; Lai Reference Lai2012; Moreton Reference Moreton2012; Pater & Moreton Reference Pater and Moreton2012; Pertsova Reference Pertsova2012; Moreton & Pater Reference Moreton and Pater2012a,Reference Moreton and Paterb; Moreton & Pertsova Reference Moreton, Pertsova, Scott and Waughtal2016; Moore-Cantwell et al. Reference Moore-Cantwell, Pater, Staubs, Zobel and Sanders2017; Moreton et al. Reference Moreton, Pater and Pertsova2017). This creates the opportunity – and the imperative – for systematic comparative study of human inductive learning across domains.
The present study focuses on one particular comparison. We ask whether phonological learning in the lab is like non-linguistic learning in the lab in that learners may use either or both of two distinct processes, one implicit, the other explicit, which are engaged by different learning situations, have different inductive biases, and have different algorithmic architectures.
This study exploits two under-used sources of information. One is detailed analysis of post-experiment debriefing questionnaires in order to collect participants’ reports about their own approach to, and experience of, learning the experimental language, and in order to compare that report with objective measures of performance. The other is evaluation, not just of end-state performance, but of how performance changes over time (learning curves), in order to compare it with the predictions of different learning models. Experiments 1 and 2 focus on identifying correlates of implicit vs. explicit learning modes using single-feature assertions (‘Type I’ patterns, in the terminology of Shepard et al. Reference Shepard, Hovland and Jenkins1961). Experiments 3–5 ask whether the two modes have different inductive biases, by comparing their success in acquiring two-feature if-and-only-if (‘Type II’) and three-feature family-resemblance (‘Type IV’) patterns.
This study goes beyond previous work on phonotactic learning by testing the two-systems hypothesis. It goes beyond previous work on the two-systems hypothesis in non-linguistic learning by applying that hypothesis to complex phonological stimuli to facilitate cross-domain comparison. It goes beyond both by uniting so many indices of learning mode in a single study.
This article is aimed at two audiences simultaneously. One is phonologists who know about phonological learning and are interested in how it relates to learning in other domains, or in how participants approach phonological tasks. The other is cognitive scientists who know about concept learning and are interested in how it relates to learning phonological patterns, which inhabit a much more complex stimulus space than is typically studied.
2. Implicit and explicit concept learning
Studies of inductive learning of featurally defined non-linguistic patterns (also called ‘concepts’ or ‘categories’; e.g., ‘blue and triangular’) have led many psychologists to hypothesise two concurrent learning processes, which here we will call the explicit system and the implicit system (Kellogg Reference Kellogg1982; Ashby et al. Reference Ashby, Alfonso-Reese, Turken and Waldron1998; Love Reference Love2002; Maddox & Gregory Ashby Reference Maddox and Gregory Ashby2004; Smith et al. Reference Smith, Berg, Cook, Murphy, Crossley, Boomer, Spiering, Beran, Church, Gregory Ashby and Grace2012, Reference Smith, Zakrzewski, Herberger, Boomer, Roeder, Gregory Ashby and Church2015). The two systems correspond approximately to the familiar notions of reasoning and intuition. Each is characterised by a set of putatively co-occurring properties. Several variants of this two-systems hypothesis exist; for critical reviews, see Osman (Reference Osman2004), Evans (Reference Evans2008), Keren & Schul (Reference Keren and Schul2009) and Newell et al. (Reference Newell, Dunn, Kalish and Ross2011).Footnote 1
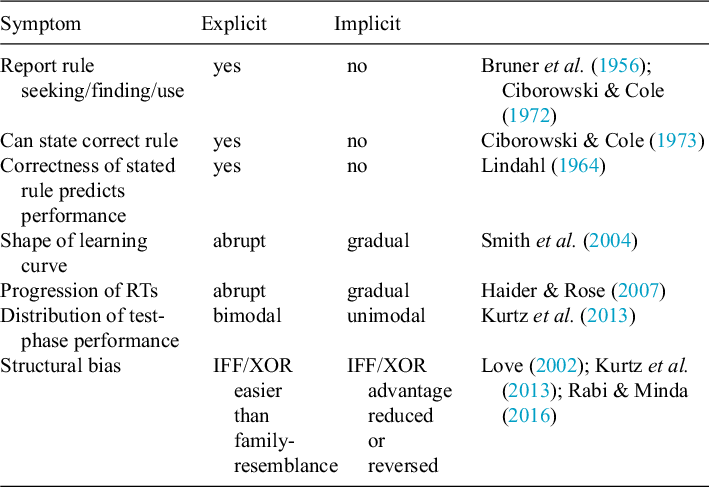
The explicit system is hypothesised to be effortful, conscious and demanding of attention and working memory. It is proposed to have a ‘rule-based’ architecture, that is, it can be modelled as serial testing of verbalisable hypotheses; hence, learning is abrupt (as one hypothesis ousts another; Bower & Trabasso Reference Bower, Trabasso and Atkinson1964), open to introspection and subject to inductive biases which make it better for patterns which depend on fewer features. Proposals differ as to how the fewer-relevant-features bias arises out of the learning model; for example, RULEX (Nosofsky et al. Reference Nosofsky, Palmeri and McKinley1994b) serially tests candidate rules in order of increasing feature count, whereas the mental-model model (Goodwin & Johnson-Laird Reference Goodwin and Johnson-Laird2013) begins with a set of parochial rules for each instance, which it then progressively amalgamates by detecting and eliminating irrelevant features. Another conjectured source is a preference for rules that are shorter when expressed in natural language (Shepard et al. Reference Shepard, Hovland and Jenkins1961; Ciborowski & Cole Reference Ciborowski and Cole1973; Greer Reference Greer1979; Maddox et al. Reference Maddox, Filoteo and Lauritzen2007).Footnote 2 The process generating the bias will become relevant in a post hoc analysis (§9); until then, we will simply hypothesise that fewer relevant features mean faster and more accurate explicit learning.
The implicit system, by contrast, is proposed to be effortless, unconscious and undemanding of attention or working memory. Architecturally, it is proposed to be ‘cue-based’, that is, the learning model involves incremental weight update on an array of property detectors which are functionally analogous to weighted constraints in linguistic theory (Rescorla & Wagner Reference Rescorla, Wagner, Black and Prokasy1972; Gluck & Bower Reference Gluck and Bower1988; Nosofsky et al. Reference Nosofsky, Palmeri and McKinley1994b; Ashby et al. Reference Ashby, Paul, Todd Maddox, Pothos and Willis2011).Footnote 3 Hence, learning is gradual rather than abrupt, closed to conscious introspection and faster for patterns which are supported by multiple overlapping cues than for those that are supported by a small number of disjoint cues.
Each system is associated with a distinct syndrome of predicted behavioural effects. Since the explicit system is conscious and effortful, participants are predicted to be aware of whether they are using it or not. Since the end product of explicit learning is an explicit rule that governs the learner’s classification responses, explicit learners should show a tight link between classification performance and ability to accurately verbalise the target rule. In an experiment where a partly correct rule is no help, explicit learners are predicted to fall into two groups at the end of training: those who achieve a high level of classification accuracy and are able to accurately verbalise the target rule, and those who are near chance and state an inaccurate rule or no rule. If trial-by-trial responses are collected during training, an abrupt jump from near-chance to near-perfect performance, and from slow to fast reaction times, might coincide with the discovery of the correct rule and the participant’s transition from rule-seeking to rule-using.
In the hypothesised implicit system, on the other hand, the product of learning is a set of continuous-valued weights on an array of property detectors; hence, implicit learning should not facilitate accurate verbalisation of the target rule. Since the weights are updated incrementally and automatically, and since responses are smoothly related to the weights, changes in response probabilities and reaction times should be gradual over time and similar across participants.
The dependence of the explicit system on working memory is hypothesised to bias it in favour of rules that involve simple relations between a small number of features, such as two-feature biconditionals (if-and-only-if and exclusive-or patterns, e.g., ‘either green or square, but not both’), whereas the parallelism of the implicit system facilitates detection of patterns which are supported by multiple overlapping cues, such as multi-feature family-resemblance patterns (e.g., ‘differs by at most one feature value from a small green square’). Evidence for the occurrence of these symptoms in non-linguistic learning is summarised in Table 1.
Behavioural signatures of explicit vs. implicit learning in experiments on non-linguistic learning.

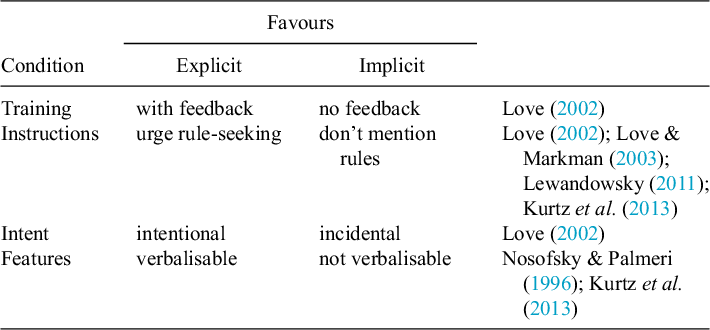
Different experimental conditions facilitate the use of one or the other learning mode. Corrective feedback, instructions to seek a rule and easily verbalisable stimulus features elicit more behavioural signatures of explicit learning, while training without feedback, instructions that do not mention rules, and features that are hard to verbalise favour implicit learning (Table 2).
Conditions favouring explicit vs. implicit learning in experiments on non-linguistic learning.

Each system is proposed to be domain-general, that is, to apply to any concept regardless of the real-world features which define it. The concepts ‘blue and triangular’, ‘feverish and sniffly’, ‘furry and oviparous’ and so forth are all grist for the same two mills. Though the verbalisability of the features, or the perceptual separability of their physical instantiations, might affect learning (Nosofsky & Palmeri Reference Nosofsky and Palmeri1996; Minda et al. Reference Minda, Desroches and Church2008; Kurtz et al. Reference Kurtz, Levering, Stanton, Romero and Morris2013; Zettersten & Lupyan Reference Zettersten and Lupyan2020), the processes themselves are proposed to be general-purpose. It follows that both processes ought to be applicable to language, and indeed, both implicit and explicit processes have been found to be involved in language learning (Ellis Reference Ellis1994; for reviews, see Lichtman Reference Lichtman2013; Rebuschat Reference Rebuschat2013).Footnote 4 A widespread view is that child L1 learning is implicit and domain-specific, while adults learning L2 rely on explicit domain-general problem-solving abilities (Bley-Vrooman Reference Bley-Vrooman1990; DeKeyser Reference DeKeyser, Doughty and Long2003; Paradis Reference Paradis2004). This is an oversimplification, as there is evidence of implicit morphosyntactic grammar learning in both naturalistic (non-classroom) L2 acquisition (Krashen Reference Krashen1982; Green & Hecht Reference Green and Hecht1992) and in artificial-language experiments (Reber Reference Reber1989; Lichtman Reference Lichtman2012).
There has been little, if any, study contrasting implicit vs. explicit learning of natural first- or second-language phonotactics.Footnote 5 Studies of phonological learning in artificial languages are mainly aimed at explaining natural-language typology, and therefore assume – usually tacitly – that all participants use a single implicit inductive learning process, identical to the one that underpins natural language acquisition and shapes natural-language typology. Criticisms of ‘artificial-language’ methodology as contaminated by explicit learning (e.g., Zhang & Lai Reference Zhang and Lai2010) have not presented evidence that it actually is so contaminated. Experimenters may design their experiments to minimise explicit learning (e.g., Do et al. Reference Do, Zsiga and Havenhill2016; Glewwe Reference Glewwe2019), or exclude data from participants who correctly verbalise the pattern (e.g., Zellers et al. Reference Zellers, Post and Williams2011; Moreton Reference Moreton2012; Chen Reference Chen2020; Lin Reference Lin2023), but, with some recent exceptions (Kimper Reference Kimper, Hansson, Farris-Trimble, McMullin and Pulleyblank2016; Moreton & Pertsova Reference Moreton, Pertsova, Scott and Waughtal2016; Chen Reference Chen2021; Moreton et al. Reference Moreton, Prickett, Pertsova, Fennell, Pater, Sanders, Bennett, Bibbs, Brinkerhoff, Kaplan, Rich, Handel and Cavallaro2021), they rarely analyse implicit and explicit learners separately, nor distinguish wholly implicit learners from failed explicit learners.
Lack of knowledge about the learning-mode variety of phonological learning is an obstacle to progress. Despite their growing importance to phonological theory, we do not know what artificial-language experiments are ‘about’. Are participants really all applying the same processes as each other? Are they applying the same processes as natural L1 or L2 learners? Are there experimental manipulations that encourage the kind of learning the experimenters want to study? Are there ways to distinguish different kinds of learners in the analysis? Do differences in how participants learn lead to differences in what kinds of pattern they learn better?
This study asks whether the inductive learning of phonotactics in the lab is served by implicit and explicit processes like the ones proposed for non-linguistic inductive concept learning. The research strategy is simple: using phonological patterns rather than non-linguistic ones, to vary the conditions in Table 2, observe the effects on the symptoms in Table 1, and compare the results to the predictions of the two-system model.
2.1 Approaches to implicit vs. explicit learning in related areas
This study, motivated by the parallels between the concept-learning literature in psychology and the phonotactic-learning literature in phonology, focuses on the empirical area where those parallels are strongest, namely, experiments in which adult participants classify stimuli on the basis of a featurally defined pattern. There are two other neighbouring areas in which debate is ongoing as to the relative contributions of implicit and explicit knowledge, and which have been studied in connection with non-linguistic analogues.
One is the learning of phonologically unpatterned wordlike chunks from speech-stream segmentation (‘statistical learning’, e.g., Saffran et al. Reference Saffran, Newport and Aslin1996). Participants are exposed to an uninterrupted stream of concatenated pseudo-words sampled with repetition from a fixed set, and are then tested on their ability to recognise the pseudo-words in isolation and distinguish them from foils. The statistical dependencies that make it possible to parse out the pseudo-words are phonologically arbitrary dependencies between specific syllables or segments (e.g., Newport & Aslin Reference Newport and Aslin2004). Here, both implicit and explicit processes seem to contribute something non-negligible (Batterink et al. Reference Batterink, Reber, Neville and Paller2015, Reference Batterink, Paller and Reber2019). Analogous visual experiments have found predominantly implicit learning (Kim et al. Reference Kim, Seitz, Feenstra and Shams2009), but with some role for deliberate attention (Turk-Browne et al. Reference Turk-Browne, Isola, Scholl and Treat2008).
Another approach involves speech errors occurring during speeded production of sequences of syllables (Dell et al. Reference Dell, Adams and Meyer2000). The oft-replicated finding is that a consonant which is restricted by the experimental pattern to a specific syllable position (onset vs. coda) stays in that position when moved to a different syllable by an error more often than a consonant whose position is not so restricted (Anderson & Dell Reference Anderson and Dell2018). Participants usually show signs of implicit learning, such as insensitivity to instructions that reveal the pattern and inability to report it afterwards (reviewed in Dell et al. Reference Dell, Kelley, Hwang and Bian2021), but that is not always the case (Taylor & Houghton Reference Taylor and Houghton2005: Experiment 1). Recently, Smalle et al. (Reference Smalle, Muylle, Szmalec and Duyck2017) and Muylle et al. (Reference Muylle, Smalle and Hartsuiker2021) have found that children’s and older adults’ errors on position-restricted consonants are like those of younger adults, but that, unlike younger adults, children and older adults have no tendency to preserve the syllable positions of unrestricted consonants in errors. Muylle et al. (Reference Muylle, Smalle and Hartsuiker2021) speculate that this might be because younger adults have better explicit cognition than the other two groups, whereas implicit learning ability is constant across the lifespan. In button-pressing analogues in which fingers played the role of consonants and thumbs those of vowels, it was found that, although errors respected position in the syllable-analogues as in the language versions, there was no tendency for unrestricted consonant-analogues to preserve position (Anderson & Dell Reference Anderson and Dell2018; Rebei et al. Reference Rebei, Anderson and Dell2019) – that is, younger adults in the button-pressing task behaved like children and older adults in the speech task. If Muylle et al.’s (Reference Muylle, Smalle and Hartsuiker2021) speculation is correct, that could mean that the button-pushing task is entirely implicit, whereas the speech task engages some explicit processing in younger adults.
How concept learning, statistical learning and production learning are related to each other and to natural first- or second-language acquisition will be a difficult knot to unpick. One approach would be to compare how the same pattern is learned across all three experimental paradigms, and that can hardly be done without clarifying the role of implicit and explicit processes in each one.
3. Experiment 1
In Experiment 1, the conditions in Table 2 were varied to see if they had the effects in Table 1.Footnote 6 The Implicit-Promoting condition was based on a common paradigm in which participants are familiarised using only pattern-conforming instances, then tested on their ability to choose a novel pattern-conforming item when paired with a nonconforming foil (e.g., Carpenter Reference Carpenter2006; Moreton Reference Moreton2008; Kuo Reference Kuo2009; Carpenter Reference Carpenter2010; Skoruppa & Peperkamp Reference Skoruppa and Peperkamp2011; Moreton Reference Moreton2012; Lai Reference Lai2015; Greenwood Reference Greenwood2016; Carpenter Reference Carpenter2016; Moreton et al. Reference Moreton, Pater and Pertsova2017; Gerken et al. Reference Gerken, Quam and Goffman2019). The Explicit-Promoting condition differed in that training trials consisted of choosing the conforming member of a conforming–nonconforming pair, a condition which encourages explicit learning in non-linguistic experiments because it asks for explicit judgements and provides explicit corrective feedback (see §2).
In the above-cited experiments corresponding to the Implicit-Promoting condition (Carpenter Reference Carpenter2006, etc.), the familiarisation task was explained to participants as listening to ‘words’ in a ‘language’, and the test task as distinguishing novel words of the language from nonwords. Using that task here would have meant familiarising our Explicit-Promoting participants by training them to choose words over nonwords, a task which has no analogue in natural language learning. To improve ecological validity in the Explicit-Promoting condition, participants in both conditions of Experiment 1 were instead told that they would be learning to distinguish words of the target gender from words of another gender. Many natural languages assign gender at least partly on the basis of arbitrary phonological properties (Corbett Reference Corbett1991: 51–62), and guessing the gender of a new word is something that speakers of such languages must sometimes do in real life, making use of phonological cues among others (Zubin & Köpcke Reference Zubin and Köpcke1984; Onysko et al. Reference Onysko, Callies and Ogiermann2013; Franco et al. Reference Franco, Zenner and Speelman2018). Each participant’s ‘language’ assigned nouns feminine or masculine gender based on a visual or phonological feature chosen randomly from a larger set. Participants were trained, tested and then given a post-experiment debriefing questionnaire.
3.1 Methods
3.1.1 Stimuli
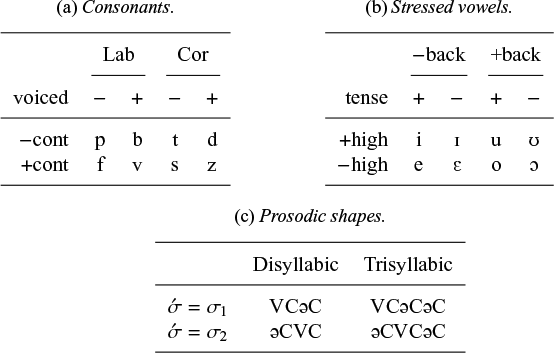
The audio stimuli (fictitious nouns) were American English nonwords with the prosodic shapes [ ] and [
 ]. Main stress fell on the first or second syllable; other syllables’ vowels were reduced to
 .Footnote
7
The stressed vowel was one of
 . The consonants were one of
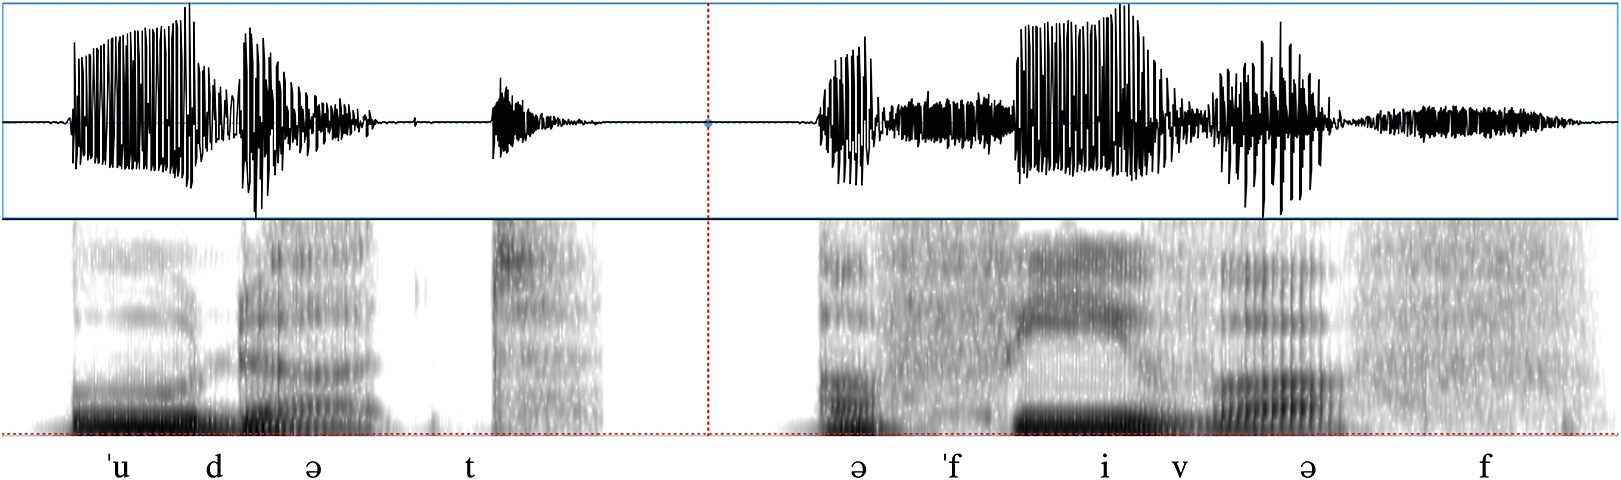
 . The schema is shown in Table 3. Examples are shown in Figure 1.
Schema used to construct the auditory nonword stimuli for all experiments.

Examples of audio stimuli, shown in Praat (Boersma & Weenink Reference Boersma and Weenink2021). Dimensions: 2.21 s
 $\times $
 $\pm 0.93$
uncalibrated units (waveform) or 5,000 Hz (spectrogram).

Six phonological variables were chosen based on the authors’ expectations that each would be individually highly salient, that is, would result in high learning performance in a Type I pattern. Three were chosen with the expectation that they would be easy for linguistically naïve participants to verbalise: two vs. three syllables, first- vs. second-syllable stress, and all consonants different vs. all consonants identical. The other three were chosen with the expectation that they would be hard to verbalise: stressed vowel is front (and unrounded) vs. stressed vowel is back (and rounded), all consonants are fricatives vs. all consonants are stops, and all consonants are labial vs. all consonants are coronal. The reason for making all consonants share the property was to make the rule findable regardless of which consonant position or positions the participant happened to focus their attention on. The six variables were crossed to create 64 cells, each of which was filled with eight randomly generated nonwords to create a pool of 512 nonwords. We will refer to these variables as ‘features’ henceforth, using the word in its everyday sense rather than in the technical sense of an element in a theory of distinctive features (Jakobson et al. Reference Jakobson, Gunnar, Fant and Halle1952).
Each stimulus was recorded in isolation by a male native speaker of American English from the Upper Midwest at a 44.1-kHz sampling rate. Using Praat (Boersma & Weenink Reference Boersma and Weenink2013), they were high-pass filtered with a 10-Hz rolloff at 100 Hz to remove low-frequency noise, and normalised to have the same peak amplitude. The resulting high-resolution WAV-format files were lossily compressed to MP3 and Ogg Vorbis format for use in the actual experiment. The pictures were collected from public-domain sources found on the World Wide Web. Each depicted a familiar object on a white background.
3.1.2 Participants and procedure
Participants were recruited for a study on learning grammatical gender in an artificial language using Amazon Mechanical Turk (Sprouse Reference Sprouse2011). A total of 211 participants completed the experiment. Of these, 20 were excluded from analysis (5 reported a non-English L1, 7 reported taking written notes, 6 reported choosing test-phase responses that were maximally unlike what they were trained on, 2 fell below the minimum performance criterion of at least 10 correct answers out of 32 in the test phase),Footnote 8 leaving 191 valid participants. In addition to the six phonological-feature conditions described above, there were also three visual-feature conditions which will not be discussed here (but see Pertsova & Becker Reference Pertsova and Becker2021 for some discussion). That left 137 valid participants in the phonological conditions (63 Explicit-Promoting and 74 Implicit-Promoting). No participant, in this or any other experiment, participated in more than one of the experiments reported in this article.Footnote 9
The experiment was preceded by a sound check, in which potential participants were asked to listen to a single word and type it. Those who were unable to hear the audio were asked not to participate further. Participants were then randomly assigned to one of 24 groups defined by crossing Training Group with Critical Feature and Target Gender.
A unique ‘language’ was randomly generated for each participant, consisting of 128 word–picture pairs, randomly divided into 32 conforming and 32 nonconforming items for the training phase, and another 32 and 32 for the test phase. Grammatical gender was explained as follows:
This artificial language is like Spanish or French in that it has grammatical gender: All nouns are grammatically either feminine or masculine, even if they refer to things like clouds or sidewalks that have no biological sex.
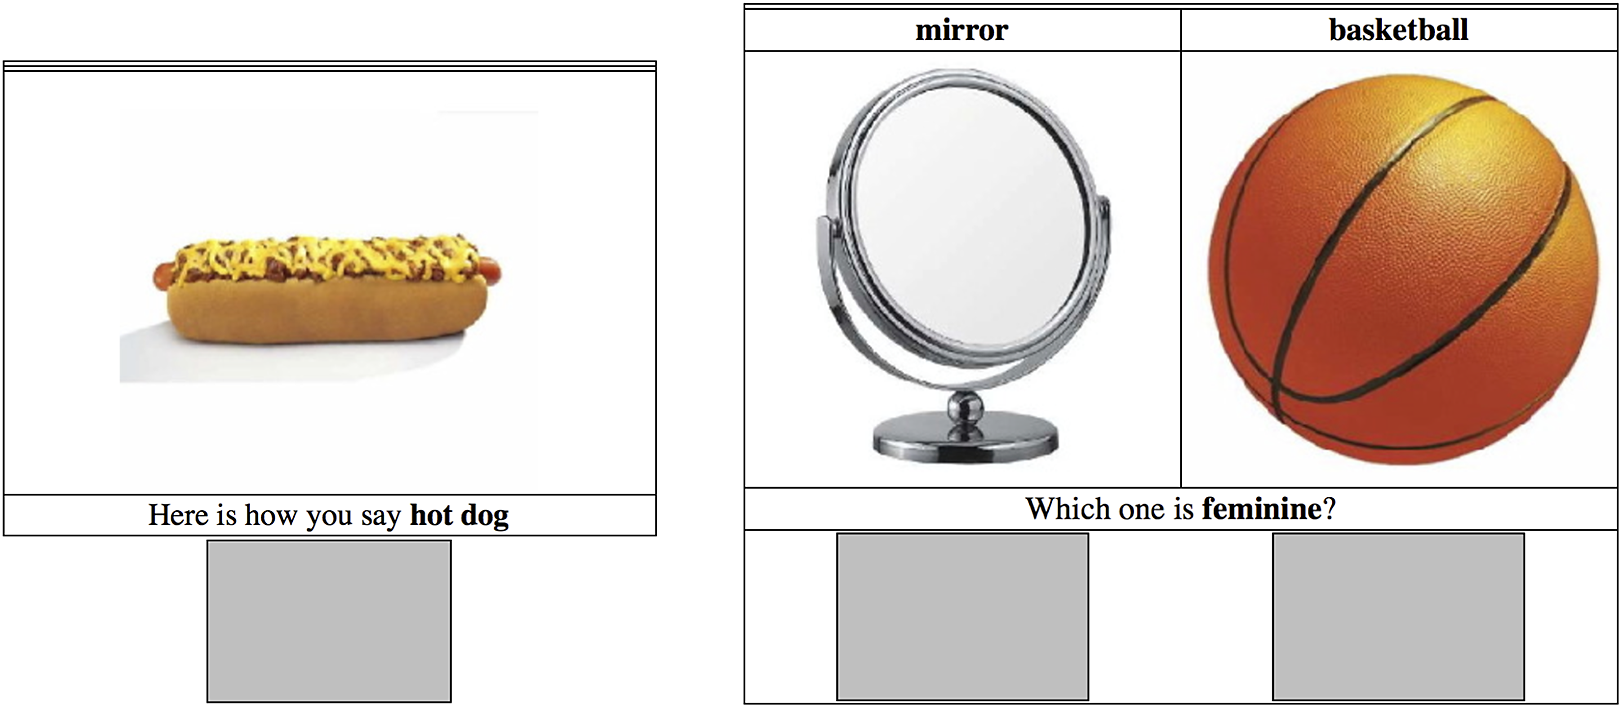
Participants in the Implicit-Promoting group were instructed that all of the words they were to learn would belong to the Target Gender. On each training trial, the participant saw a picture, captioned with its English name, with a button below it (Figure 2, left panel). Mousing over the button played the correct word for that picture in the artificial ‘language’. Clicking the button triggered the next trial after a 250-ms delay. All 32 pattern-conforming stimuli were presented in random order, then again in a different random order and so on until they had been presented four times over. The random order was constrained to consist of four-trial blocks such that each trial within a block came from a different one of the four bins that corresponded to pattern-conforming feature values.
Participant view of a trial in Experiment 1. Left panel: Training phase, Implicit-Promoting condition. Right panel: Training phase, Explicit-Promoting condition, and test phase, both conditions.

Participants in the Explicit-Promoting group were instructed that they would learn to tell whether a word belonged to the Target Gender by trial and error; and there were systematic differences between the feminine and masculine words which were reliable guides to the right answer. On each training trial, participants saw two pictures, each with a button below it which played the correct word when moused over (Figure 2, right panel). The task was to choose the picture–word pair that had the Target Gender. The response was followed, after 500 milliseconds, by feedback. For a correct response, this was the sound of a desk bell. One second after the onset of the bell, the correct response was played again, and 2 seconds after the onset of that stimulus, the next trial began. Following an incorrect response, the feedback was a sad two-note sequence played on a trumpet, after which the software waited for the participant to click on the correct button before proceeding to the next trial. After all 32 conforming–nonconforming pairs had been presented, they were re-paired, reordered and re-presented, until they had been presented four times (‘timed out’), or until the participant had responded 100% correctly on four consecutive four-trial blocks (‘reached criterion’).
Participants in both conditions were instructed to pronounce the audio stimuli aloud before responding. A timestamp was recorded by the server when a trial was transmitted to the participant, and another when the server was notified that the trial had ended, using the time function in the Time::HiRes module in Perl (Wegscheid et al. Reference Wegscheid, Schertler, Hietaniemi and Aas2015). Since response times were measured at the server, they include transmission time to and from the participant’s computer, as well as the time required to render the page and play the sound files, which add variability to the durations (Høiland-Jørgensen et al. Reference Høiland-Jørgensen, Ahlgren, Hurtig, Brunstrom, Markopoulou, Faloutsos, Sekar and Kostic2016).
The last training trial was followed by the test-phase instructions, identical for both Training Groups. The procedure was identical to the training phase of the Explicit-Promoting group, except that the novel pattern-conforming and nonconforming test items were used, and there was no feedback; either response was followed, after 250 milliseconds, by the next trial. Each of 32 conforming–nonconforming test pairs was presented once.
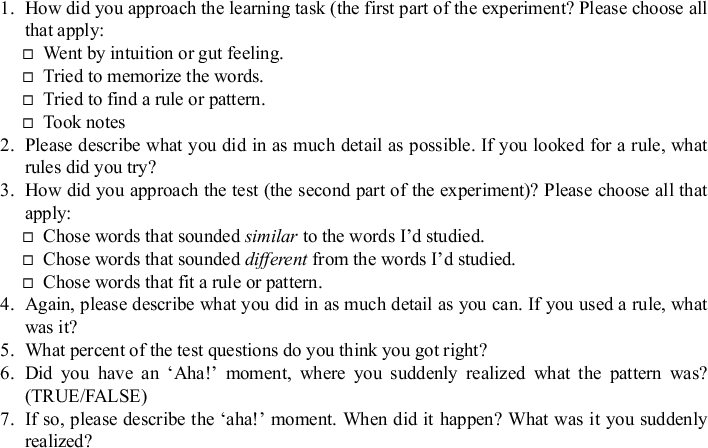
The experiment was followed by a debriefing questionnaire. In addition to questions about age, gender and linguistic background, the questionnaire asked the participant to introspect about the learning process and the outcome of learning. The questions asked are shown in Table 4.
Post-experiment debriefing questions (1–5: all experiments; 6 and 7: Experiments 2 and 5).

3.1.3 Questionnaire coding
Self-report can be used in many different ways to assess implicit vs. explicit learning (Tunney & Shanks Reference Tunney and Shanks2003), but there is no way to cleanly divide participants into one group that used exclusively implicit processes, and another that used exclusively explicit ones, because of the possibility of inaccurate self-report and the probability that many participants use some of each. We can only sort participants into more- and less-explicit groups, that is, groups that are likely to contain a higher or lower proportion of people who relied more on explicit or more on implicit processes. Questionnaire responses were coded according to the following criteria:
-
Feature stating : Did any of the answers mention any of the critical phonological features of the target rule by description (rather than by, e.g., listing letters)?
-
Rule stating : Did any of the answers state an explicit property of the audio or visual stimulus, and say or imply that the participant’s training or test responses were guided by it at any point in the experiment? (Rules that the participant said they tried and abandoned were included when scoring rule-stating.)
-
Rule correctness : Did the participant report the correct rule? If not, did they report an approximation, a rule that was more than 50% correct? (Rules that the participant said they tried and abandoned were not included in scoring rule correctness.)
-
Listing : Did any of the answers list sounds, syllables or letters?
The answers to the free-response questions (Questions 2, 4 and 7) were merged into a single answer for scoring. This was necessary because participants often answered each question, at least partly, in the other question’s response box.
Participants’ answers to the free-response questions were coded by two of the experimenters using software custom written by Josh Fennell. To minimise criterion drift across experiments, the questionnaires from all of the experiments reported in this article were coded together, with individual participants’ questionnaires occurring in random order so that questionnaires from different experiments were intermixed. Since the only unstressed vowel was schwa, there was no principled distinction between specifying stress location in terms of where schwa was found, and specifying it in by listing the vowel sounds that appeared in a particular position; hence, both response types were arbitrarily scored as feature-stating rather than letter-listing.
Cohen’s
 $\kappa $
statistic for inter-rater reliability was calculated using the kappa2 function of the irr package in R (Gamer et al. Reference Gamer, Lemon, Fellows and Singh2019). All of the
 $\kappa $
s were above 0.8, a level which is typically regarded as indicating high reliability (Cohen Reference Cohen1960; Landis & Koch Reference Landis and Koch1977; Munoz & Bangdiwala Reference Munoz and Bangdiwala1997; McHugh Reference McHugh2012).
3.2 Hypotheses and planned analyses
If the explicit system is in fact open to conscious introspection and under voluntary control, then questionnaire responses about the use of that system should reflect performance of its users in the training and testing phases with better-than-chance accuracy. In order to make concrete predictions, participants were classified based on their scored questionnaire responses according to the following schema:
-
Rule-Seeker : Checked box ‘Tried to find a rule or pattern’ with reference to the training phase.
-
Rule-Stater : In at least one of their free-response responses, stated a rule. Subdivided into Correct Rule-Staters, Approximately Correct Rule-Staters, and Incorrect Rule-Staters as scored (see §3.1.3).
-
Memoriser : Checked box ‘Tried to memorise the words’ with reference to the training phase.
-
Intuiter : Checked box ‘Went by intuition or gut feeling’ with reference to the training phase.
In training conditions where feedback was given, the training phase yields a learning curve, on the basis of which participants were additionally classified according to whether they met the stopping criterion:
-
Solver : In a condition with feedback, someone who met criterion (four consecutive correct four-trial blocks).
A participant who reported using multiple approaches was coded TRUE for each of the relevant categories.
If use of the explicit vs. implicit system is facilitated by the same factors as in visual pattern learning, then more Explicit-Promoting than Implicit-Promoting participants should be Rule-Seekers and Rule-Staters (Hypothesis 1).
If a participant states a correct explicit rule, that rule is likely to be the source of their test-phase responses: Correct Rule-Staters should perform near 100%. Participants who did not state a correct rule – the Non-Staters, Incorrect Staters and Approximate Staters – may be a more heterogeneous group. Their responses could be based on an approximately correct explicit rule, an outright wrong explicit rule, an implicitly-learned intuition about the pattern, similarity to memorised training stimuli, or even a correct explicit rule that they omitted to state on the questionnaire. Hence, Non-Staters should show a wide distribution of somewhat above-chance performance, and Correct Staters should outperform Approximate Staters (Hypothesis 2).
By comparing Solvers with each other, we can compare participants who achieved high performance by different routes to see if differences in the learning curve correspond to differences in self-report. A participant who becomes a Solver by serial hypothesis-testing alone would show near-chance performance until finding the correct rule, whereupon performance would improve to near-perfection and stay there. Once the correct rule is found, the participant can respond to a trial after hearing just one of the two stimuli. Hence, among Solvers, Correct Staters are predicted to be more likely than other Solvers to show abrupt improvement in two-alternative forced-choice performance (Hypothesis 3) and a decrease in response times (Hypothesis 4) after the last error.
3.3 Results
3.3.1 Questionnaire responses
Participants reported behaving in ways that have received little or no attention in the artificial-phonology-learning literature to date. To illustrate the contrast between what is often assumed to occur in a phonological-learning experiment and what our participants reported, we quote their own words before proceeding to a quantitative analysis.
Naïve participants, that is, those who reported not having studied linguistics, were able to discover phonetic properties and invent ways to verbalise them, even for some properties which often take time and effort for Linguistics 101 students to grasp. Out of the 137 valid participants in this experiment, 36 (26%) did this. For example, the continuancy distinction (fricatives vs. stops) was intended by the experimenters to be non-verbalisable, but some participants recognised the feature and coined their own terminology:
The feminine words used harsher consonant sounds and it was pretty clear from the beginning. Consonants p,d,t,etc were feminine whereas z,s,v, etc. sounds were masculine.
(Participant fUlgjM, Explicit-Promoting, fricatives/stops)
The words that ended more sharply seemed masculine than the feminine words. I followed the same rules as the first round here and looked for the same sounds.
(Participant pzyaXQ, Explicit-Promoting, fricatives/stops)
The experimenters likewise intended place of articulation (labial vs. coronal) to be non-verbalisable, but one participant reported:
The words had consonant sounds that were formed using the lips and front of the mouth. All of the studied words used ‘v,’ ‘p,’ ‘b,’ and ‘f’ sounds, which are made with the lips and front of the mouth, so I chose the words that used those sounds
(Participant XABNEW, Implicit-Promoting, labial/coronal)
Many participants verbalised a rule in the form of a list of letters, for example,
I found that feminine words did not usually end in a t, z, or s. It usually ended with either an o or a u as the second to last letter, with usually an f or p as the last letter.
(Participant PjMFZY, Explicit-Promoting, labial/coronal)
I noticed that most of the words were pronounced starting with an o or a sound and often had a u sound somewhere in it.
(Participant OUzBea, Implicit-Promoting, front/back)
All words that I chose started with the ‘ah’ sound.
(Participant Mdantx, Implicit-Promoting, initial/second-syllable stress)
Then, I noticed that when the second syllable was stressed I got the bell.
(Participant SyzluI, Explicit-Promoting, initial/second-syllable stress)
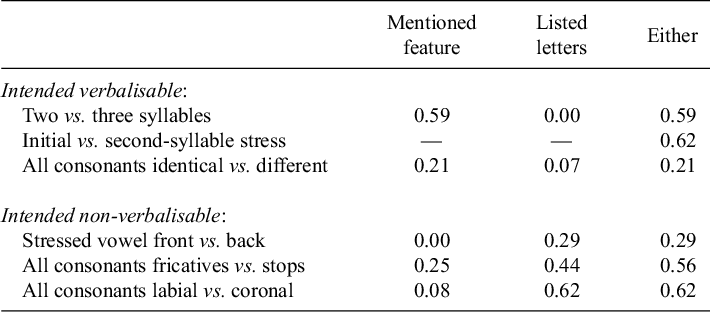
Instead of three easily verbalisable and three non-verbalisable features, as intended, the experiment turned out to have used one feature that was frequently verbalised as a feature (two vs. three syllables), two features that were frequently verbalised as letter lists (fricatives vs. stops and labials vs. coronals), one feature that was frequently verbalised ambiguously as a feature or a letter (initial vs. second-syllable stress; see §3.1.3) and two that were rarely verbalised (same vs. different consonants and front vs. back vowel). Summary statistics are shown in Table 5.
Empirical verbalisability of features in Experiment 1: proportion of all Rule-Seekers who mentioned the critical feature or listed letters in a correct or approximately correct rule. (Every correct or approximately correct rule either mentioned the feature, listed letters or both; therefore, the ‘Either’ column is also the proportion of Correct or Approximate Rule-Staters among the Rule-Seekers.) Report of stress location did not distinguish description from listing; see text.

Thus, despite experimenters’ intentions, naïve participants may reason explicitly about phonetic properties, which they can discover during the experiment and for which they can invent phonetically non-arbitrary names to facilitate explicit reasoning. Additionally, even when the phonological stimuli are audio-only, as these were, participants may be mentally spelling them to facilitate explicit reasoning.
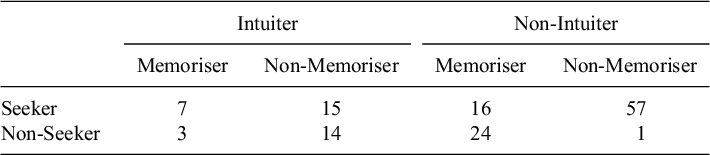
Nor do all participants report doing the experiment the same way (Table 6). Participants described a variety of approaches to the learning problem, and it often happened that an individual participant reported switching approaches during the experiment. Some examples follow.
Self-reported learning strategies (check-box responses), Experiment 1.

-
Pure intuition : I went by mostly similar sounds or letters used. No rules followed here just gut feeling.
(Participant SaUkjT, Implicit-Promoting same/different consonants)
-
Pure sequential hypothesis testing : I considered different aspects of each word, such as number of syllables, the sounds of syllables, and what letters were used, and finally determined that for masculine words the last three letters were a consonant, a vowel, and the same consonant repeated, whereas with feminine words the last three letters were a consonant, a vowel, and then a different consonant.
(Participant tIPXWj, Explicit-Promoting, all consonants same/different)
-
Intuition and sequential hypothesis testing : I started mainly by intuition while trying to find patterns in apparent suffixes and prefixes. I also tried to find other patterns until I realised that the number of syllables appeared to denote the gender. I followed the pattern where two syllables equaled feminine and more than two equaled male.
(Participant YnlqOd, Explicit-Promoting, two/three syllables)
-
Intuition and rule of unknown origin : I tried vowel placement and sound but I don’t know if thats how it works. So I went with my gut mostly. It seems the masculine is usually longer and sometimes with a long vowel in the middle with a lot of emphasis.
(Participant RvWrHh, Explicit-Promoting, two/three syllables condition)
-
Memorisation : I just tried to memorise the words by saying them out loud. Based on the words I was able to learn, I went off of those and chose words that sounded similar.
(Participant DRrbim, Implicit-Promoting, labial/coronal)
-
Tried rule-seeking but switched to memorisation : In the end, I just gave up and memorised which words were feminine and which weren’t. I tried to find a pattern, for example, if words ended with a certain consonant, or if there were shorter or longer vowels and similar stuff, but honestly, there were no patterns I could discern. I didn’t take any notes. I wasn’t sure if you were allowed to. That might’ve been a good idea. I just tried to remember which words sounded feminine, even though I did not recognise a pattern.
(Participant gbBIqh, Explicit-Promoting, same/different consonants)
-
Focused attention on specific parts of the word : I first listened to the ending of the words to see if there was a pattern. Then, I noticed that when the second syllable was stressed I got the bell. The second syllable was stressed.
(Participant SyzluI, Explicit-Promoting, first/second syllable stress)
The reports differ from one participant to the next, even within a single condition, giving at least an initial impression that participants are sampled from a very mixed distribution. How seriously that impression is to be taken depends of course on how accurate self-report is, a question to which we now turn in the quantitative analysis. Self-report of cognitive processes is often viewed sceptically (Nisbett & Wilson Reference Nisbett and Wilson1977; Berry & Broadbent Reference Berry and Broadbent1984), but it is often corroborated by objective behavioural measures, especially in intentional problem-solving tasks (Ericsson & Simon Reference Ericsson and Simon1980; Morris Reference Morris and Antaki1981; Kellogg Reference Kellogg1982; White Reference White1988). One goal of this experiment series is to test the validity of self-report in phonological learning. The analysis, and the rest of this article, will focus on rule-seeking and rule-stating, the bases of our hypotheses, rather than on memorisation.
3.3.2 Hypothesis 1: Rule-seeking and rule-stating are influenced (but not wholly determined) by instructions, feedback and/or intention to learn
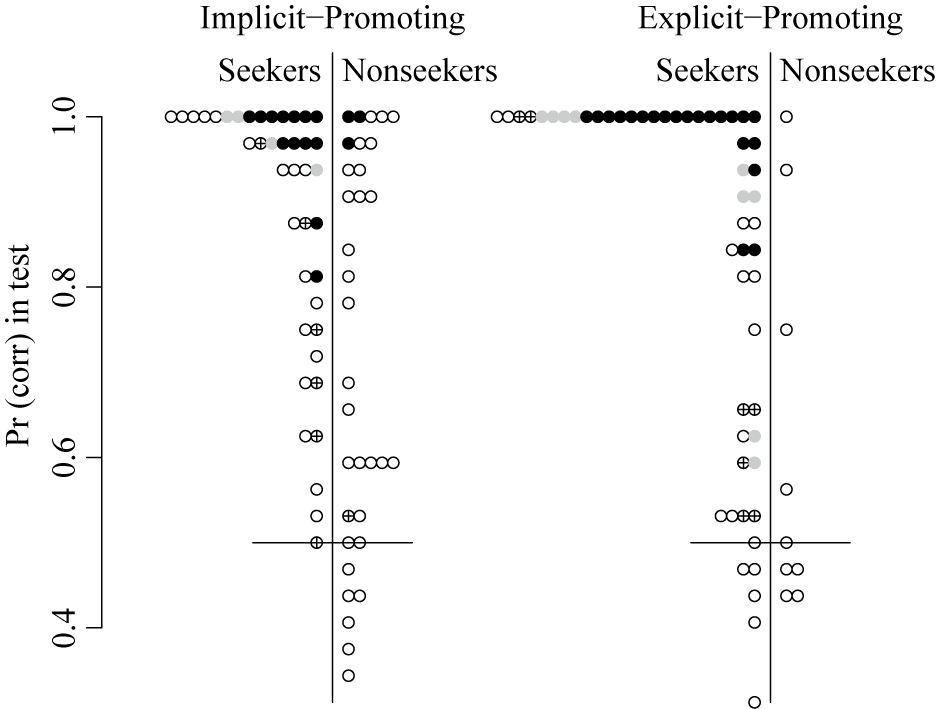
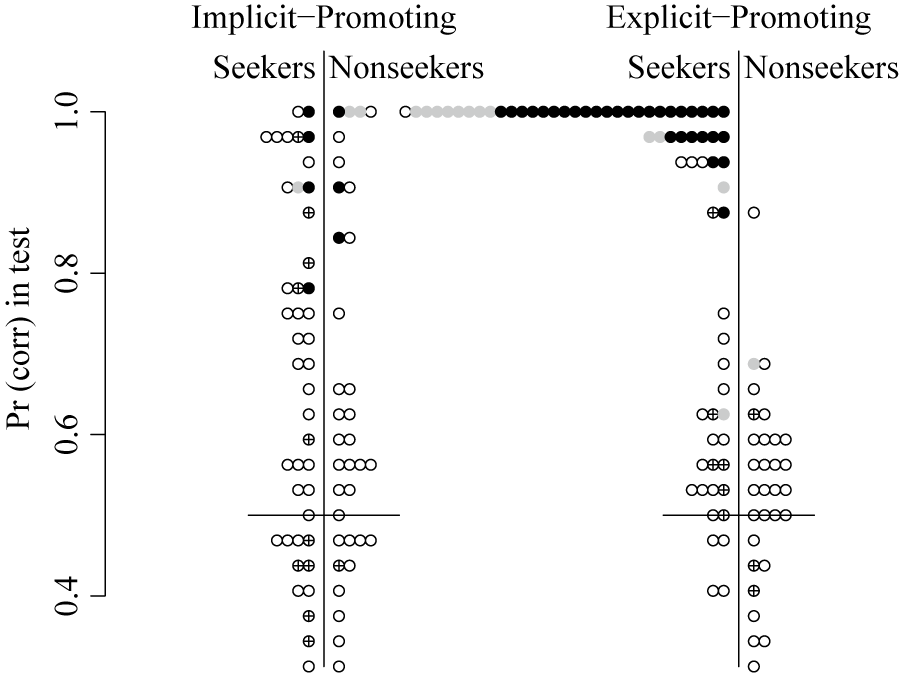
Results from all participants are plotted in Figure 3. Participants in the Explicit-Promoting condition were indeed significantly more likely than those in the Implicit-Promoting condition to be Rule-Seekers and Rule-Staters (
 $p = 0.0001643$
and
 $0.01053$
, respectively, by Fisher’s exact test, two-sided). A couple of Incorrect Staters performed well on the generalisation test, and so must have been basing their responses on something other than the incorrect rule they stated, perhaps intuition.Footnote
10
Test-phase performance as a function of training condition, rule-seeking and rule-stating, Experiment 1. Plotting symbols: Black circle = Correct Stater; grey circle = Approximate Stater; crossed circle = Incorrect Stater; white circle = Non-Stater. A horizontal line segment marks the chance performance level of 50%.

3.3.3 Hypothesis 2: Stating a correct rule predicts better generalisation performance
Figure 3 also shows that participants tend to fall into two groups: Correct or Approximately Correct Staters, who perform nearly perfectly on the generalisation test (black and grey circles), and Non-Staters or Incorrect Staters (empty and crossed circles), whose performance is widely distributed. In fact, most Correct or Approximately Correct Staters (35/52) gave a pattern-conforming response on every single one of the 32 test trials, and most of those who gave 100% pattern-conforming responses (35/48) were Correct or Approximately Correct Staters.
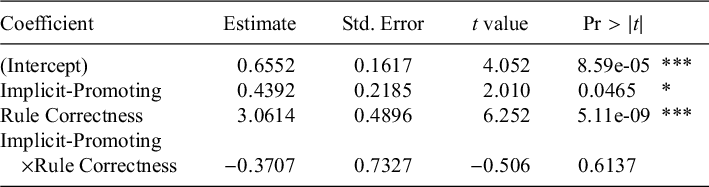
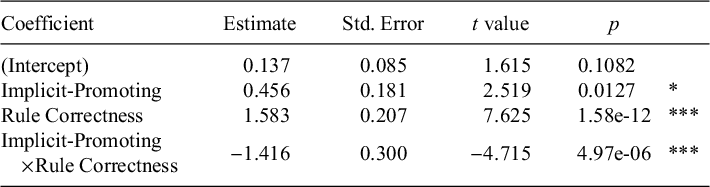
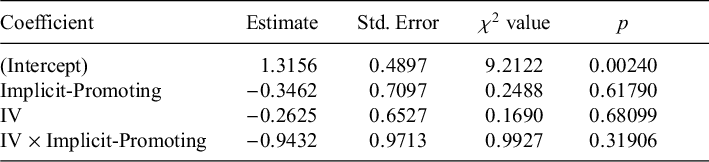
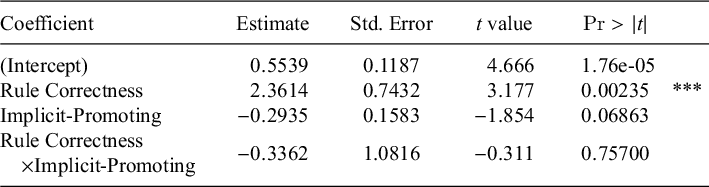
The effect of rule discovery on generalisation performance was quantified using complex survey design logistic regression with a two-stage sampling mode. This procedure, also known as a ‘population average model’ or ‘sampler’s model’, treats each participant in the experiment as a cluster in a survey (e.g., a sample of size 100 voters in each U.S. State), and each 2AFC trial as a participant in the survey (e.g., an individual voter, responding to a single yes/no survey question). Complex survey design logistic regression is an alternative way of taking into account within-participant dependency (Bieler & Williams Reference Bieler and Williams1995; Williams Reference Williams2000; Lumley & Scott Reference Lumley and Scott2017) while avoiding convergence problems encountered when trying to fit mixed-effects logistic regression models to individual 2AFC responses. (The authors are indebted to Chris Wiesen of the Odum Institute for Social Science Research at the University of North Carolina, Chapel Hill, for suggesting this method.) Complex survey design logistic regression was used for all repeated-measures data in this article. The models were fit using the R package survey (Lumley Reference Lumley2004; Lumley & Scott Reference Lumley and Scott2017; Lumley Reference Lumley2019) with Training Group (0 = Explicit-Promoting, 1 = Implicit-Promoting), Rule Correctness (1 for Correct Staters, 0.5 for Approximate Staters, and 0 for others) and their interaction as fixed effects. The dependent variable was Correctness of each trial response (1 = pattern-conforming, 0 = nonconforming). The fitted model is shown in Table 7. The significant and positive intercept term means that even Incorrect Staters and Non-Staters performed above chance in the Explicit-Promoting condition, and the significantly positive coefficient for Implicit-Promoting means that they performed better in the Implicit-Promoting condition. The large, highly significant coefficient for Rule Correctness, and the near-zero interaction term, mean that Correct and Approximate Staters did perform much better than Incorrect Staters and Non-Staters regardless of the training condition.
Summary of complex survey design logistic-regression model for pattern-conformity of generalisation-test responses, Experiment 1 (4,384 responses from 137 participants).

3.3.4 Hypotheses 3 and 4: Correct rule-stating is associated with more-abrupt learning curves and with response-time acceleration after the last error
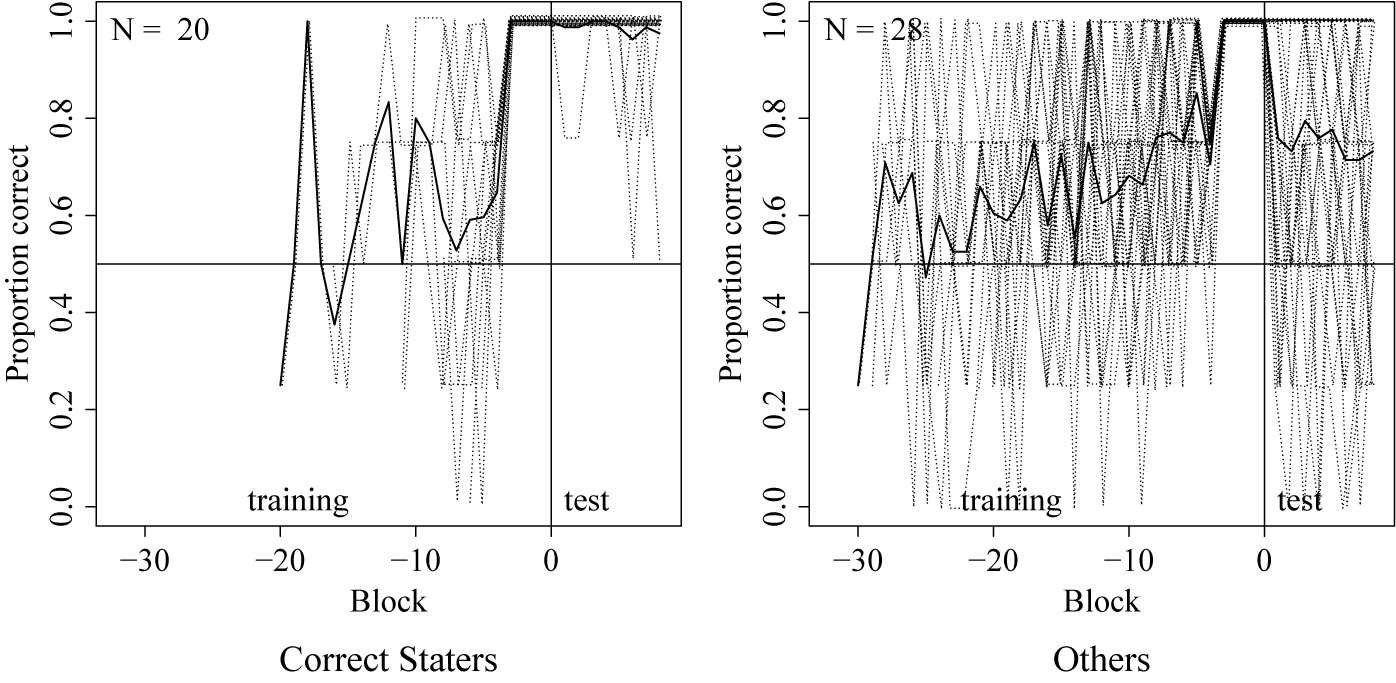
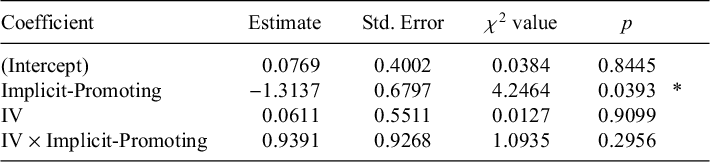
The Explicit-Promoting condition yielded a learning curve for each participant, showing performance (proportion conforming responses) as a function of trial number. The curves for the Solvers (those who met the criterion of 4 consecutive correct four-trial blocks before the end of the training phase) are shown in Figure 4. Performance in the 16-trial window preceding the last error was significantly lower for Correct and Approximate Staters than for other Solvers, as shown by the negative coefficient for Rule Correctness in the model of Table 8 (fitted using svyglm, as above, because of the repeated measure on Participants). This is as predicted by Hypothesis 3: Both the Correct Staters and the others learned the pattern to the same ultimate criterion level of 100%, but the transition was more abrupt (started from a lower baseline) for participants who stated a correct or partly correct rule. Figure 4 also illustrates how near-perfect training performance in the test phase collapses when the participant does not state a correct rule (Hypothesis 2, above).
Learning curves for Solvers in the Explicit-Promoting condition of Experiment 1, aligned to the last training error. (Since they are Solvers, the last training error precedes a four-block sequence of correct responses.) Dashed lines are individuals, and the solid line is the mean across participants. Each point is the average of a block of four consecutive trials.

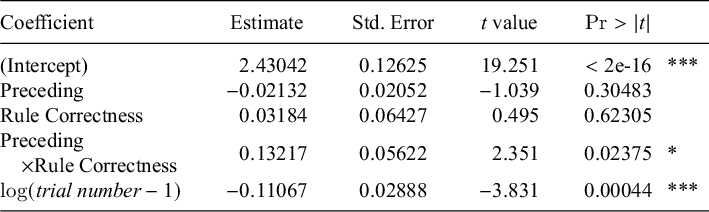
Summary of the complex survey design logistic-regression model for pattern-conformity of training-phase responses in the 16-trial window preceding the last error before the 16-trial criterion run, for Solvers in the Explicit-Promoting condition of Experiment 1 (575 responses from 43 participants, excluding 5 more participants who either never made an error, or who only made an error on their first trial).

Hypothesis 4 was tested using trial-duration data from correct responses by Solvers in the Explicit-Promoting condition. Only responses which occurred within 16 trials before or after the last error were analysed. Since response times on the very first trial of the experiment tended to be two or three times as long as on the second and subsequent trials, the very first trial was dropped if it occurred within the 16-trial radius. Durations of less than 4 seconds or more than 30 seconds were excluded, which eliminated the most extreme 10% of responses. A general linear model was then fit using the same complex survey design used in other repeated-measures data in this article via the R method svyglm, with log trial duration as the dependent variable. The critical predictors were Preceding (
 $1$
for trials preceding the last error, 0 for trials following it), Rule Correctness (1 for Correct Staters, 0.5 for Approximate Staters, else 0), and their interaction. Since Correct Staters’ last error tended to occur earlier than other Staters’, a nuisance variable,
 $\log (\textit {trial number}-1)$
, was included to model out the overall shortening of response times after the (dropped) very first trial as the experiment progressed.Footnote
11
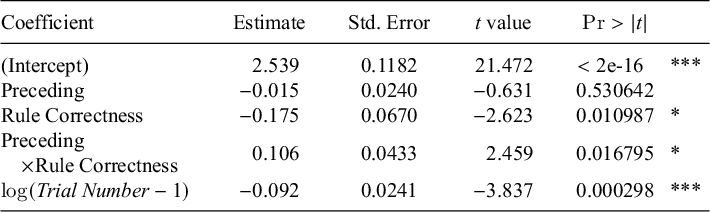
The fitted model is shown in Table 9. The intercept of about 2.5 and significant Log trial number coefficient mean that for Solvers who were not Correct or Approximate Staters, the time required to make a correct response shortened in a decelerating curve from about 12 seconds on Trial 2 to a little less than 7 seconds by Trial 128. The small, non-significant negative coefficient for Preceding means that for these participants, the 16 trials following the last error were not faster than those preceding it; if anything, they were a little slower, once the overall effect of Log trial number is corrected for. The small and nonsignificant effect of Rule Correctness means that when the other factors are controlled for, correctness of the stated rule had no significant effect on response time. Finally, the significant positive coefficient for the interaction between Preceding and Rule Correctness means that the more correct the stated rule was, the bigger the drop in response time between the trials preceding the last error and those following it. This is consistent with the effect described in non-linguistic learning by Haider & Rose (Reference Haider and Rose2007), in which rule discovery enables the participant to respond correctly after listening to only one of the two stimuli.
Summary of the complex survey design general linear model for log trial duration, correct responses from Solvers in the Explicit-Promoting condition within 16 trials of their last error (1,118 observations from 45 participants).

3.4 Discussion
These results support the hypothesis that phonotactic patterns, like visual ones, can be induced using both implicit and explicit processes. The experiment also found learning-mode variety among participants. Although signs of explicit learning were rarer in the Implicit-Promoting condition than in the Explicit-Promoting condition, Rule-Seekers and Rule-Staters were found in substantial numbers in both conditions, and some participants reported using a mix of approaches. Many spontaneously used the alphabet or self-invented phonetic terminology to facilitate explicit learning.
4. Experiment 2
It is possible that Experiment 1 was not representative of phonological learning, either in the lab or in nature, and that it had characteristics that made both conditions especially favourable to explicit learning. Experiment 2 therefore differed from Experiment 1 in multiple ways. Where the gender-assignment scenario in Experiment 1 simulated learning to distinguish lexical classes within a language, Experiment 2 used a different scenario, vocabulary learning, to construct a situation in which participants could be asked to tell possible (well-formed) from impossible (ill-formed) words. Where the Implicit- and Explicit-Promoting conditions of Experiment 1 differed in instructions, feedback and number of stimuli per trial, those of Experiment 2 differed only in whether each trial presented two well-formed stimuli (Implicit-Promoting) or one well-formed and one ill-formed (Explicit-Promoting). That made the feedback in the Implicit-Promoting condition of Experiment 2 useless for testing hypotheses about the pattern. One might therefore expect that the paradigm used in Experiment 2 would reduce or abolish the explicit learning observed in Experiment 1.
4.1 Methods
Participants in both conditions of Experiment 2 were trained to associate pictures with their (pattern-conforming) names, and were then shown novel pictures and asked to choose between novel pattern-conforming and nonconforming names for them. Instructions and feedback were the same in both training conditions. The only difference between the conditions was that the foil (incorrect choice) on each training trial was pattern-conforming in the Implicit-Promoting condition, and pattern-nonconforming in the Explicit-Promoting condition. A training trial is shown in Figure 5.
Participant view of a training and/or test trial in Experiment 2.

The critical feature was chosen from two/three syllables, first-/second-syllable stress and stops/fricatives, features which had all yielded high test-phase performance in Experiment 1. The training-phase instructions said nothing to either group about a pattern; participants where simply asked to learn which word went with which picture. Both training conditions in Experiment 2 used two-alternative choice trials with feedback. On each training trial, a positive word–picture pair (a picture plus a pattern-conforming word stimulus) was matched with a negative word–picture pair (a different picture plus a nonconforming word stimulus). The participant saw only the positive picture, with two buttons below it. Mousing over one button played the name of the picture (the positive stimulus); mousing over the other played a foil (the negative stimulus). After all 32 positive and all 32 negative pairs had been presented, the positive word–picture pairs were randomly re-matched with negative word–picture pairs for the next cycle (thereby changing, on average, all but one matching; Zager & Verghese Reference Zager and Verghese2007). The only difference between the training conditions was that the foils were pattern-conforming in the Implicit-Promoting condition, but nonconforming in the Explicit-Promoting condition.
The test phase for both groups was like the training phase for the Explicit-Promoting group, except that no feedback was given. Both groups were instructed to make their test-phase decision ‘based on which choice sounds more like it would be a word in the artificial language’. The Implicit-Promoting condition thus resembled other ‘artificial language’ paradigms in which participants are familiarised on pattern-conforming items, then asked to choose between novel conforming and nonconforming items (e.g., Carpenter Reference Carpenter, Brugos, Clark-Cotton and Han2005; Moreton Reference Moreton2008; Kuo Reference Kuo2009; Finley Reference Finley, Carlson, Hoeschler and Shipley2011; Cristiá et al. Reference Cristiá, Mielke, Daland and Peperkamp2013; Myers & Padgett Reference Myers and Padgett2014; Linzen & Gallagher Reference Linzen, Gallagher, Kingston, Moore-Cantwell, Pater and Staubs2014; Lai Reference Lai2015; Moreton et al. Reference Moreton, Pater and Pertsova2017; Greenwood Reference Greenwood2016; Chong Reference Chong2021). Questionnaires were scored as in Experiment 1.
Of 229 participants who completed the experiment, 53 were excluded from analysis (4 reported a non-English L1, 5 reported taking written notes, 27 reported choosing test-phase responses that were maximally unlike what they were trained on, 1 fell below the minimum performance criterion of at least 10 correct answers in the test phase and 16 were excluded for two or more of these reasons), leaving 176 valid participants, 99 in the Explicit-Promoting condition and 77 in the Implicit-Promoting condition.Footnote 12
4.2 Results
4.2.1 Hypothesis 1: Rule-seeking and rule-stating are influenced (but not wholly determined) by instructions, feedback and/or intention to learn
Rule-Seekers and Rule-Staters were again found in both training conditions (Figure 6). Participants in the Explicit-Promoting condition were numerically more likely than those in the Implicit-Promoting condition to be Rule-Seekers, but the difference was only marginally significant (
 $p = 0.08193$
by Fisher’s exact test, two-sided). Participants in the Explicit-Promoting condition were again significantly more likely to be Rule-Staters (
 $p = 0.0006625$
, respectively, by Fisher’s exact test, two-sided).
Test-phase performance as a function of training condition, rule-seeking, and rule-stating, Experiment 2. Plotting symbols: Black circle = Correct Stater; grey circle = Approximate Stater; crossed circle = Incorrect Stater; white circle = Non-Stater. A horizontal line segment marks the chance performance level of 50%.

4.2.2 Hypothesis 2: Stating a correct rule predicts better generalisation performance
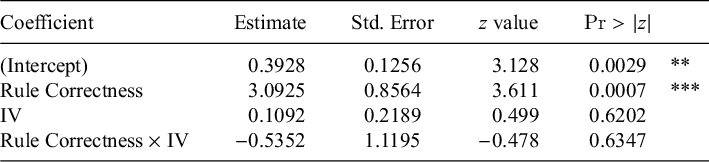
The data were analysed using complex survey design, as in Experiment 1. Table 10 shows that Incorrect Staters and Non-Staters performed above chance in the Implicit-Promoting condition. Correct and Approximate Staters did much better than Incorrect Staters and Non-Staters in the Explicit-Promoting condition, but the benefit of rule correctness vanished in the Implicit-Promoting condition, as shown by the significant negative coefficient for Implicit-Promoting
 $\times $
Rule Correctness.
Summary of fixed effects in the complex survey design logistic-regression model for pattern-conformity of generalisation-test responses, Experiment 2 (5,632 responses from 176 participants).

4.2.3 Hypotheses 3 and 4: Correct rule-stating is associated with more-abrupt learning curves and with response-time acceleration after the last error
In the Explicit-Promoting condition, where attending to pattern-conformity could help performance, Correct Stater Solvers showed a more-abrupt performance jump across the last error, and their good performance persisted throughout the test phase. Others (Non-Staters, Incorrect Staters and Approximate Staters) showed more-gradual improvement which tended to relapse in the test phase. The effect of Correct Stating on abruptness is confirmed statistically using the same model as in Experiment 1 (Table 11). The response-time acceleration at the last error as a function of Rule Correctness was replicated here (Table 12). Complex survey design was used as in Experiment 1 because of the repeated measure on Participant.
Summary of the complex survey design logistic-regression model for pattern-conformity of training-phase responses in the 16-trial window preceding the last error before the 16-trial criterion run, for Solvers in the Explicit-Promoting condition of Experiment 2 (815 responses from 64 participants, excluding 3 more participants who either never made an error, or who only made an error on their first trial).

Summary of the complex survey design general linear model for log response time, correct responses from Solvers in the Explicit-Promoting condition within 16 trials of their last error (1,646 observations from 66 participants).

4.3 Discussion
The vocabulary-learning scenario of Experiment 2 produced nearly the same results as the gender-learning scenario of Experiment 1. The change in learning scenario thus did not affect the availability of implicit and explicit processes.
Unlike in Experiment 1, however, the two training conditions did not differ significantly in the rate of rule-seeking (perhaps because the instructions, task and feedback were the same in both), and Correct and Approximate Stating, which in Experiment 1 occurred frequently in both training conditions, was in Experiment 2 confined almost entirely to the Explicit-Promoting condition. It thus appears that the opportunity to compare conforming and nonconforming stimuli on the same trial tends to facilitate successful explicit learning (not altogether surprisingly, since explicit learning relies on working memory; see §2).
5. Discussion: Experiments 1 and 2
The first two experiments asked whether human inductive learning of phonotactic patterns showed evidence for distinct implicit and explicit systems similar to that observed in inductive learning of non-linguistic patterns (§2).
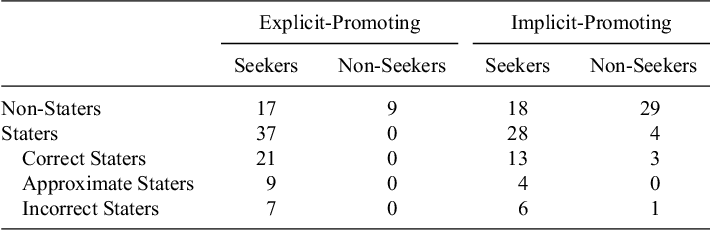
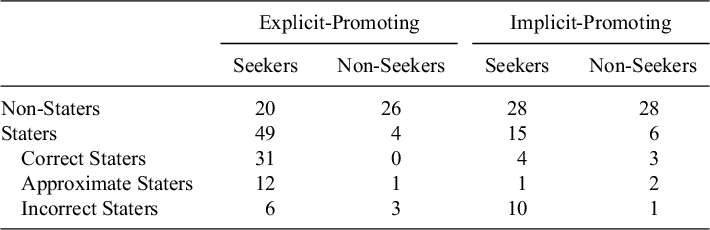
Hypothesis 1: Rule-seeking and rule-stating are influenced (but not wholly determined) by instructions, feedback and/or intention to learn. This hypothesis was supported by differences between the Explicit- and Implicit-Promoting conditions in Experiments 1 and 2. However, in both experiments, Rule-Seekers were in the majority even in the Implicit-Promoting conditions, which were designed to discourage rule-seeking in the first place, to misdirect rule-seeking away from the actual pattern if attempted, and to render rule-seeking futile even if correctly directed. It may seem incredible that those who reported rule-seeking in either of the Implicit-Promoting conditions could have been doing anything that would benefit their performance in the generalisation test. And yet they were: Even in the Implicit-Promoting conditions, Rule-Seekers were significantly more likely than Non-Seekers to be Staters and to be Correct Staters (Tables 13 and 14; the four tables with the associated statistical tests, which were done using Firth-penalised logistic regression in order to reduce the risk of inflated significance due to empty or near-empty cells, are omitted for reasons of space).
Rule-Stating and correctness of stated rule as a function of Rule-Seeking, Experiment 1.

Rule-Stating and correctness of stated rule as a function of Rule-Seeking, Experiment 2.

We can only speculate as to why there were so many Rule-Seekers in the Implicit-Promoting conditions, and what they were doing that could possibly have improved test-phase performance. Some may have only begun to look for a rule once the test phase started, but (mis)reported rule-seeking during training. However, it seems likely to us that many were simply doing what many of us would have been doing in their place, namely, trying to figure out what the experiment was really about. Even though the task made the search unhelpful for the training phase, participants may have noticed shared properties of the stimuli which they then used as the basis for a rule once the test phase started and they were confronted with nonconforming foils.
Hypothesis 2: Stating a correct rule predicts better generalisation performance. In both experiments, Correct and Partly Correct Staters gave significantly more pattern-conforming responses on the generalisation test than did Non-Staters or Incorrect Staters. The effect was particularly clear among Solvers. All Solvers, by definition, finished the Explicit-Promoting training phase with sixteen consecutive correct responses, but the Correct Stater Solvers’ high performance continued into the generalisation test, while that of the other Solvers fell sharply (see Figure 4).Footnote 13 Participants’ rule reports were therefore largely accurate descriptions of their own response behaviour. The straightforward interpretation is that participants responded by applying their stated rule.
Hypothesis 3: Correct rule-stating is associated with a more-abrupt learning curve. Solvers in the Explicit-Promoting condition had significantly lower performance immediately before their last error when they stated a correct rule than when they did not.
Hypothesis 4: Correct rule-stating is associated with response-time acceleration after the last error. This hypothesis was borne out. A straightforward interpretation of the two positive results is that rule discovery did have a shortening effect on response times, similar to that found in for non-linguistic learning by Haider & Rose (Reference Haider and Rose2007). Since two audio stimuli were presented on each training trial, one positive and one negative, rule discovery could have allowed a participant to respond after listening to only one of them.
6. Experiment 3
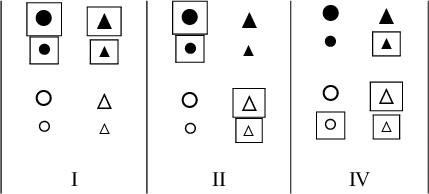
The implicit and explicit systems are hypothesised to have different architectures and hence different inductive biases: The rule-based explicit system is faster for patterns which depend on fewer features, while the cue-based implicit system is faster for patterns which are supported by multiple overlapping cues (see above, §2). Empirical support for this view comes from studies of visual pattern-learning involving the contrast between Shepard et al.’s (Reference Shepard, Hovland and Jenkins1961) ‘Type II’ and ‘Type IV’ patterns. A Type II pattern is an if-and-only-if relationship between two features, for example, ‘circle if and only if black’. A Type IV pattern is defined by resemblance to a three-feature prototype, for example, ‘at most one feature different from a small white triangle’ (Figure 7). The typical finding is that Type II patterns are easier for humans to learn inductively than Type IV (Shepard et al. Reference Shepard, Hovland and Jenkins1961; Nosofsky et al. Reference Nosofsky, Gluck, Palmeri, McKinley and Gauthier1994a; Smith et al. Reference Smith, Minda and Washburn2004; Vigo Reference Vigo2013).Footnote 14 Changing the experimental conditions so as to encourage implicit learning reduces performance on Type II relative to Type IV (Nosofsky & Palmeri Reference Nosofsky and Palmeri1996; Love Reference Love2002; Minda et al. Reference Minda, Desroches and Church2008; Kurtz et al. Reference Kurtz, Levering, Stanton, Romero and Morris2013; Rabi & Minda Reference Rabi and Minda2016; Zettersten & Lupyan Reference Zettersten and Lupyan2020).
Examples of visual Type II and Type IV patterns.

Several proposals have been advanced in the psychology literature to explain the observed advantage of Type II over Type IV. They are based on the idea that explicit rule learning is biased towards hypotheses that involve fewer relevant features. As noted in §2, the proposals differ as to how this bias comes about, a point which will become relevant in the post hoc discussion (§9); for the nonce, we hypothesise merely that, since only two features are relevant for Type II, whereas three are relevant for Type IV, Type II has an advantage in explicit learning (Shepard et al. Reference Shepard, Hovland and Jenkins1961; Nosofsky et al. Reference Nosofsky, Palmeri and McKinley1994b; Feldman Reference Feldman2000; Mathy & Bradmetz Reference Mathy and Bradmetz2004; Feldman Reference Feldman2006; Lafond et al. Reference Lafond, Lacouture and Mineau2007; Bradmetz & Mathy Reference Bradmetz and Mathy2008; Vigo Reference Vigo2009; Kurtz et al. Reference Kurtz, Levering, Stanton, Romero and Morris2013).
The two-systems hypothesis thus predicts that explicit learners will show an advantage for Type II over Type IV which will be reduced or reversed for implicit learners. If phonotactic learning uses the same two systems, the same effect of implicit versus explicit learning on the relative difficulty of Type II vs. Type IV ought to be observed. Some indication that this might be the case comes from studies by Moreton et al. (Reference Moreton, Pater and Pertsova2017) and Gerken et al. (Reference Gerken, Quam and Goffman2019), which found better performance on Type IV than Type II in adult phonotactic learning, perhaps (we conjecture) because the participants were learning implicitly. Those experiments did not, however, distinguish implicit from explicit learners, so we take up that task now.
Experiment 3 is like Experiment 1 except that, instead of all patterns being Type I (a single-feature affirmation), each participant receives either a Type II or a Type IV pattern. The two-systems theory predicts that participants who report explicit learning (rule-seeking) ought to show relatively better performance on Type II than Type IV as compared to participants who do not report explicit learning (Hypothesis 5).
6.1 Methods
The critical features were chosen from among two/three syllables, stops/fricatives and labials/alveolars. For each participant in the Type II condition, every phonological feature was randomly paired with a unique dimension of the Type II example in Figure 7; for example, for one participant, stops/fricatives would be paired with black/white; for another, stops/fricatives might be paired with white/black, or with large/small, or with square/triangle. For each participant in the Type IV condition, the same was done with the Type IV example. Of 112 participants who completed the experiment, 31 were excluded from analysis (4 reported a non-English L1, 11 reported taking written notes, 7 reported choosing test-phase responses that were maximally unlike what they were trained on, none fell below the minimum performance criterion of at least 10 correct answers in the test phase and 2 were excluded for two or more of these reasons), leaving 88 valid participants, 19 in the Type II Implicit-Promoting condition, 16 in the Type IV Implicit-Promoting condition, 25 in the Type II Explicit-Promoting condition and 28 in the Type IV Explicit-Promoting condition.
6.2 Results
Since no significant results were found in the analyses of Hypothesis 3 and Hypothesis 4 in this or in any subsequent experiment, the corresponding sections are omitted.
6.2.1 Hypothesis 1: Rule-seeking and rule-stating are influenced (but not wholly determined) by instructions, feedback and/or intention to learn
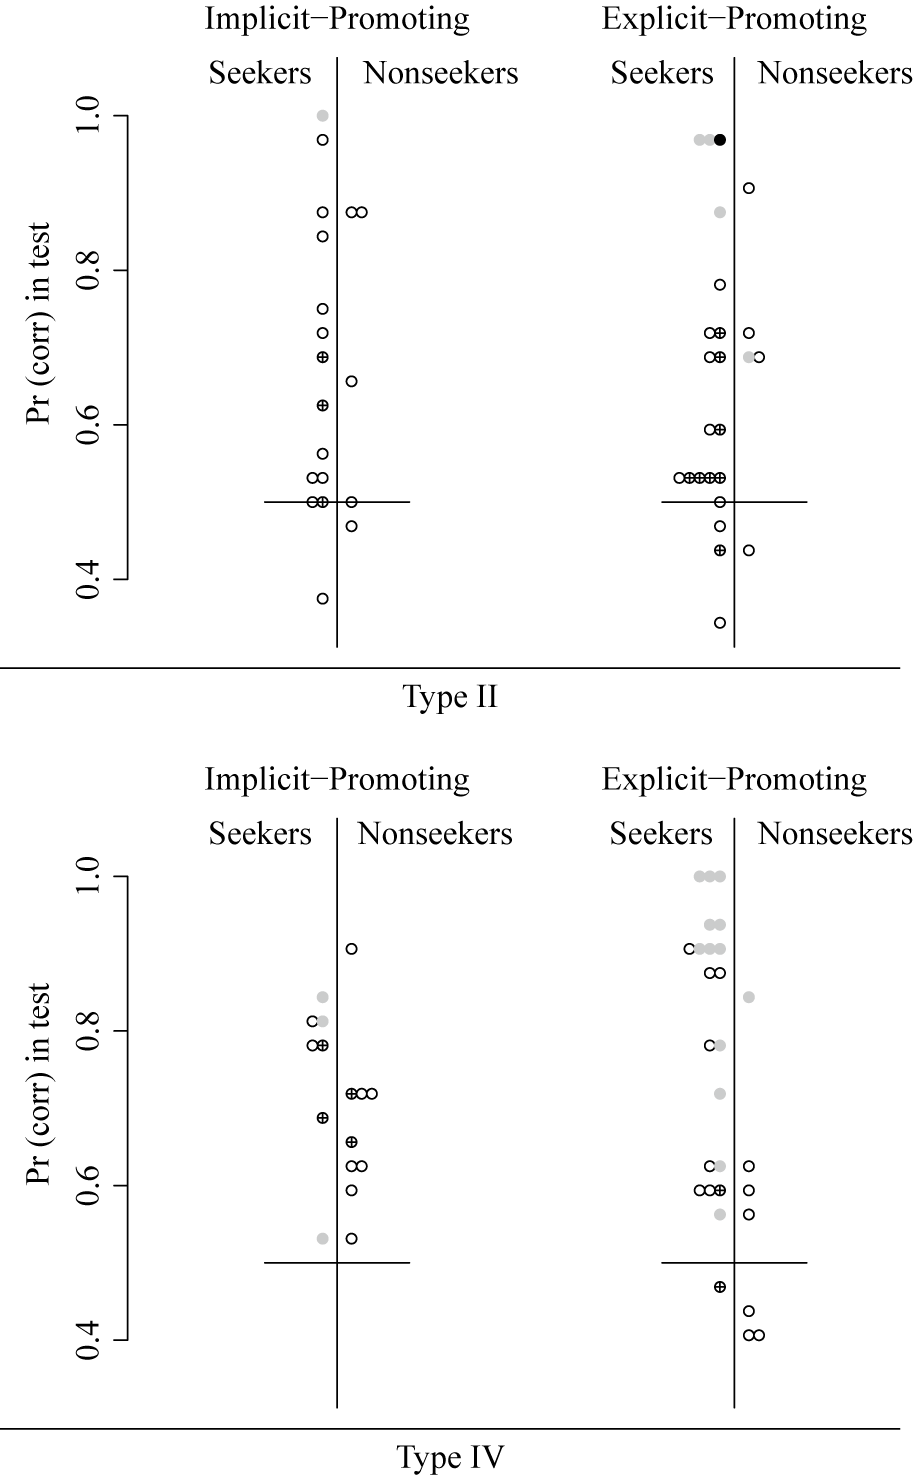
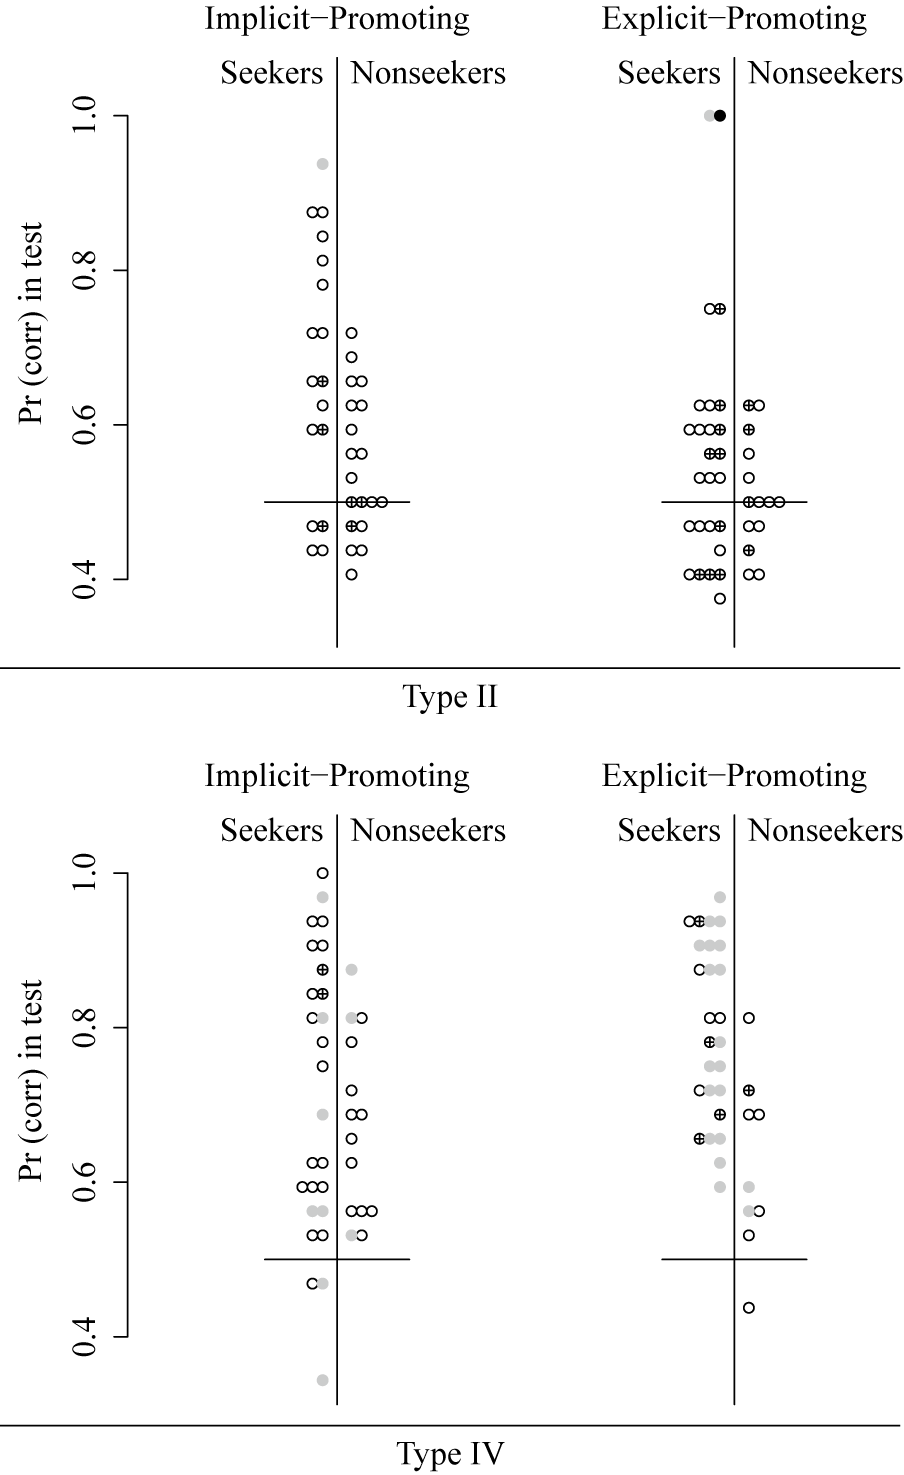
Rule-seeking and rule-stating occurred in both training conditions (Figure 8). Fisher’s exact test could no longer be used as it was in Experiments 1 and 2, because the additional Type (II vs. IV) factor meant that the data no longer formed a two-dimensional contingency table. In order to reduce the risk of false positives that arises when ordinary logistic regression is applied to data sets which have some cells with few observations in them, Firth-penalised logistic regression was used instead, fit using the logistf method in R’s logistf package (Firth Reference Firth1993; Heinze & Ploner Reference Heinze and Ploner2018). Seeker was the dependent variable and Training Condition and Type were predictors. No significant effect of either predictor was found and no interaction (Table 15). However, in the Type II condition, Rule-Staters were significantly rarer in the Implicit-Promoting group as shown by the significant negative coefficient of Implicit-Promoting in Table 16. No significant effects of or interactions with Type were found (Table 16).
Test-phase performance as a function of training condition, rule-seeking and rule-stating, Experiment 3. Plotting symbols: Black circle = Correct Stater; grey circle = Approximate Stater; crossed circle = Incorrect Stater; white circle = Non-Stater. A horizontal line segment marks the chance performance level of 50%.

Fitted Firth-penalised logistic-regression model for Rule-Seeking as a function of Training Condition and Type, Experiment 3.

Fitted Firth-penalised logistic-regression model for Rule-Stating as a function of Training Condition and Type, Experiment 3.

6.2.2 Hypothesis 2: Stating a correct rule predicts better generalisation performance
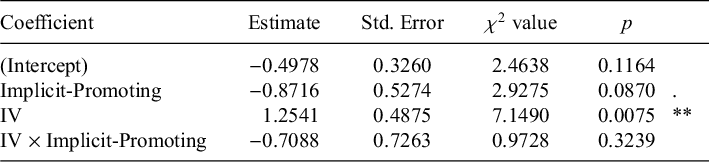
There were so few Correct and Approximate Staters in the Implicit-Promoting condition, particularly in Type II, that a model with Rule Correctness as a predictor could not be fit. The analysis was therefore restricted to the Explicit-Promoting condition alone. Pattern type was coded with Type II as 0 and Type IV as 1. Complex survey design logistic regression was used as in Experiment 1. The fitted model is shown in Table 17. Participants in the Type II condition who were not Correct or Approximate Staters nonetheless chose pattern-conforming responses at above-chance levels, as shown by the significantly positive intercept. Those who were Correct or Approximate Staters were very much more likely to respond in conformity with the pattern, as shown by the large and significant positive coefficient for Rule Correctness. Participants in Type IV did not differ significantly from those in Type II.
Summary of fitted complex survey design logistic-regression model for pattern-conformity of generalisation-test responses, Experiment 3, Explicit-Promoting condition only. Type II is the reference category (1,696 responses from 53 participants).

6.2.3 Hypothesis 5: Rule-seeking is associated with better IFF/XOR and/or worse Family-resemblance performance
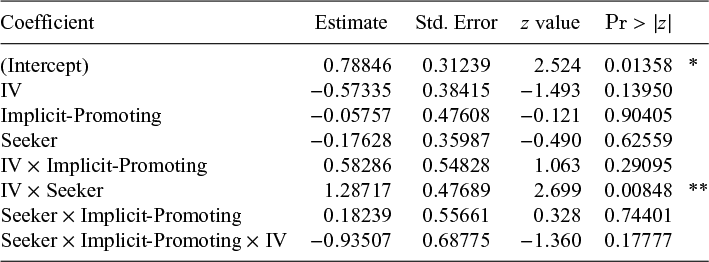
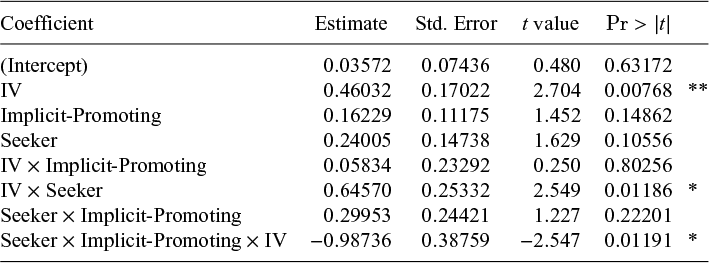
Previous experiments with non-linguistic patterns have found that performance on Type II patterns is typically better than on Type IV, and that conditions which favour explicit learning improve performance on Type II relative to Type IV (Love Reference Love2002; Kurtz et al. Reference Kurtz, Levering, Stanton, Romero and Morris2013). Figure 8 shows that in both the Explicit-Promoting and Implicit-Promoting groups, Seekers perform better than Non-Seekers on Type IV, but not on Type II. That is, Type II, the pattern type that in the past has been found to benefit the most from an explicit learning approach, actually benefited the least. Among Seekers in both training conditions, performance on Type II is well below that on Type IV. These observations are confirmed by a mixed-effects logistic-regression model (Table 18), in which the only significant terms are the intercept and the interaction IV
 $\times $
Seeker. The hypothesis is therefore merely not supported, but outright contradicted by the results.
Summary of fixed effects in the fitted logistic-regression model for pattern-conformity of generalisation-test responses, Experiment 3. Type II is the reference category (2,816 responses from 88 participants).

6.3 Discussion
The learning-mode variety found with Type I patterns in Experiments 1 and 2 was replicated here: Rule-seeking and rule-stating occurred in both training conditions and for both Type II and Type IV target patterns, and the Explicit-Promoting condition facilitated rule-stating. Moreover, learning mode affected, not just the absolute, but the relative difficulty of the two pattern types: Self-reported rule-seeking improved performance on Type IV so much that it exceeded performance on Type II. Learning mode is thus confirmed to vary between participants and to affect inductive bias. The direction of the effect (explicit learning favouring Type IV) contradicts the prediction of Hypothesis 5, being unexpected under models of rule-based learning which incorporate a bias towards patterns that depend on fewer features (§2). A post hoc explanation for this surprising reversal is deferred to §9 below.
The Correct Staters, who in the earlier experiments formed a mode at 100% in the distribution of test-phase performance, were absent from Experiment 3, presumably because the correct rules were harder to find or to state. The Approximately Correct Staters did show better generalisation performance than Non-Staters and Incorrect Staters, as before. However, no significant effect of Rule Correctness on abruptness or response time was found. That could simply be because Rule Correctness only ranged up to 0.5, that is, any helpful effect of Rule Correctness was coming from a less-helpful partially-correct rule. More interestingly, it could instead be a sign that multi-feature rules are found incrementally rather than all at once: If rule discovery occurs in successive stages (e.g., with the identification of one relevant feature at a time), then each stage would bring with it a increment in accuracy and a decrement in response time, so that any comparison of performance just before and just after a single trial would find only a small difference. The lack of a Rule Correctness effect on abruptness or response time could also mean that multi-feature rules, once found, are harder to apply, such that the difference in accuracy or speed between having no rule at all and having a correct rule is smaller when the correct rule is hard to apply than when it is easy to apply.
7. Experiment 4
The results of Experiment 3 were surprising enough that Experiment 4 was done to see if they would replicate. In Experiment 3, some of the Type II patterns, and all of the Type IV patterns, involved the two features fricatives/stops and labial/coronal, which were both realised on the consonants. That meant that some Type II patterns could be learned correctly by focusing on the consonants and learning only the consonant inventory, whereas no Type IV pattern could be learned correctly without integrating features that were spread across the stimulus. To remove this asymmetry between Type II and Type IV, Experiment 4 used first- vs. second-syllable stress in place of Experiment 3’s labial vs. coronal consonants. Otherwise the two experiments were the same.
7.1 Methods
The stimuli, instructions and procedure were identical to those of Experiment 3. Of 173 participants who completed the experiment, 4 were subsequently excluded for reporting a non-English L1, 1 for reporting deliberately choosing test-phase items that sounded different from the training items, 7 for reporting taking written notes and 2 for falling below the 10-out-of-32 criterion. That left 151 valid participants, 36 in the Explicit-Promoting Type II condition, 40 in the Implicit-Promoting Type IV condition, 40 in the Explicit-Promoting Type II condition and 35 in the Explicit-Promoting Type IV condition.
7.2 Results
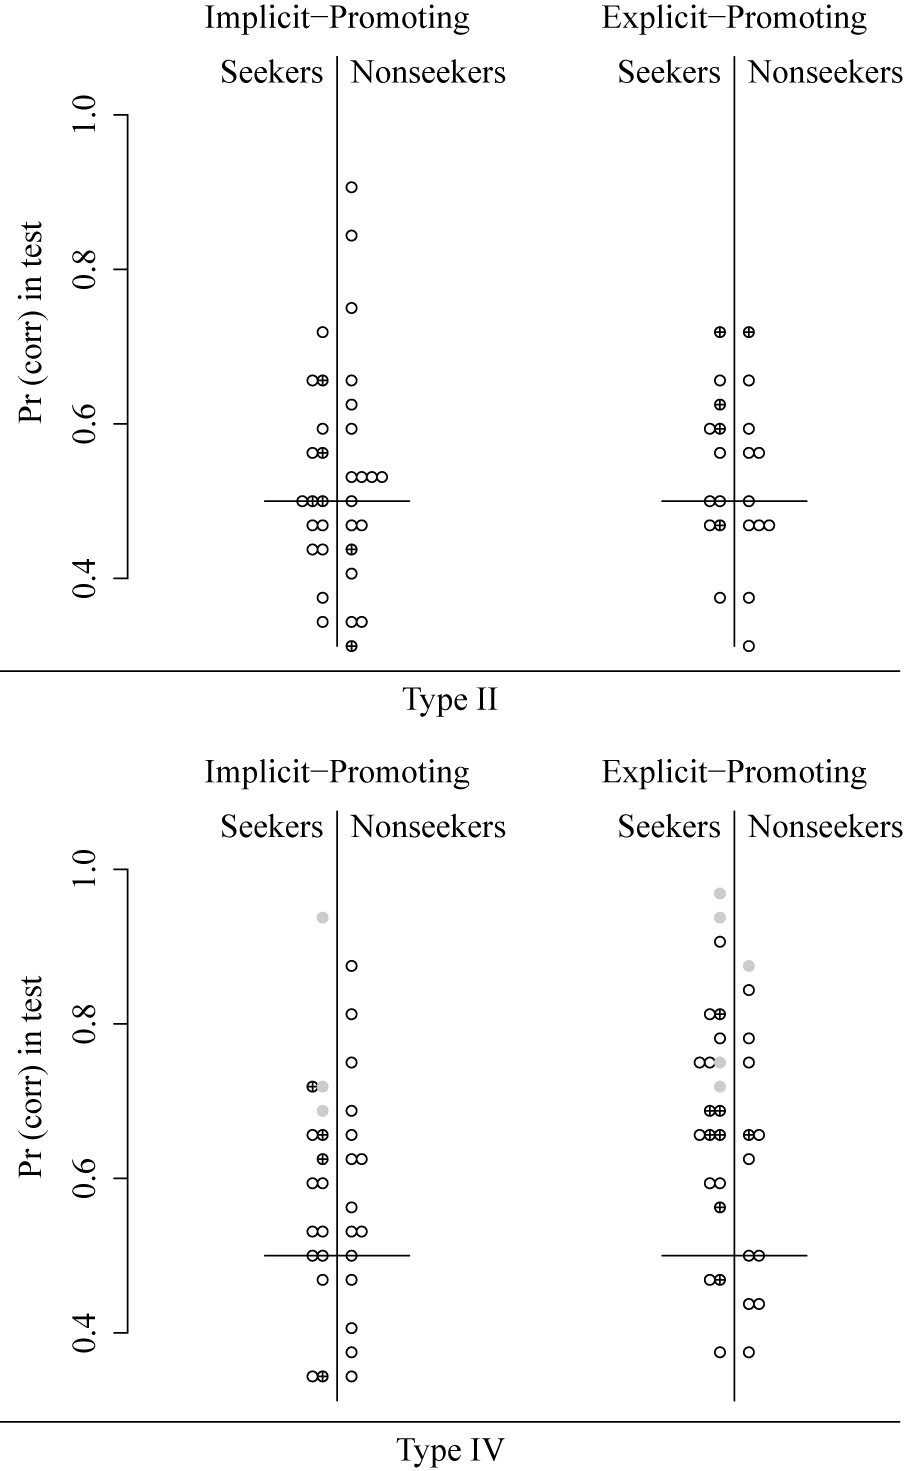
7.2.1 Hypothesis 1: Rule-seeking and rule-stating are influenced (but not wholly determined) by instructions, feedback and/or intention to learn
As in all previous experiments, rule-seeking and rule-stating occurred in both training conditions and in both pattern-type conditions (Figure 9). A Firth-penalised logistic-regression model with Seeker as the dependent variable and Training Condition and Type as predictors was used, for the same reasons explained in §6.2.1, and found no significant effect of either predictor and no interaction (table omitted to save space). Implicit-Promoting Type II participants were numerically less likely than Explicit-Promoting Type II participants to state a rule, but the difference was only marginally significant (Table 19). Participants in the Type IV Explicit-Promoting condition were much more likely to be Staters than those in the Type II Explicit-Promoting condition, and those in the Type IV Implicit-Promoting condition did not differ significantly from those in the Type IV Explicit-Promoting condition.
Test-phase performance as a function of training condition, rule-seeking and rule-stating, Experiment 4. Plotting symbols: Black circle = Correct Stater; grey circle = Approximate Stater; crossed circle = Incorrect Stater; white circle = Non-Stater. A horizontal line segment marks the chance performance level of 50%.

Fitted Firth-penalised logistic-regression model for Rule-Stating as a function of Training Condition and Type, Experiment 4.

7.2.2 Hypothesis 2: Stating a correct rule predicts better generalisation performance
The mode at 100% pattern-conforming generalisation responses which was found in Experiments 1 and 2, and which disappeared with the switch to more-complex pattern types in Experiment 3, was again absent here. There were not enough Correct or Approximate Staters in the Type II condition for the model to be fit accurately, so only the Type IV condition was analysed. A complex survey design logistic-regression model was used because of the repeated measure on Participant. Neither Rule Correctness nor Training Condition had any significant influence on test-phase performance (table omitted to save space). The ineffectiveness of Rule Correctness may be due in part to its small range: Since there were no Correct Staters, the experiment could only measure the (smaller) difference between Approximately Correct Staters and others.
7.2.3 Hypothesis 5: Rule-seeking is associated with better IFF/XOR and/or worse Family-resemblance performance
The fitted model is shown in Table 20. In the Explicit-Promoting condition, Seekers do not outperform Non-Seekers in the Type II condition (as shown by the small and non-significant coefficient for Seeker), but do so in the Type IV condition (large and significant coefficient for IV
 $\times $
Seeker). This much is consistent with what was found in Experiment 3. In the Implicit-Promoting condition, however, this interaction is significantly reduced (the large and significantly nonzero coefficient for the three-way interaction is numerically larger than the coefficient for IV
 $\times $
Seeker).
Summary of fitted complex survey design logistic-regression model for pattern-conformity of generalisation-test responses, Experiment 4. Type II is the reference category (4,832 responses from 151 participants).

7.3 Discussion
The outcome of Experiment 4 was very much like that of Experiment 3. In particular, the same novel effect seen in Experiment 3 is replicated in Experiment 4: In the Explicit-Promoting condition, self-reported rule-seeking benefits Type IV performance more than it does Type II performance, contrary to previous theoretical proposals and unlike previous experimental results. This is true even though no Seekers in the Type IV condition succeeded in stating a wholly correct rule, and even though Approximate Stating did not significantly improve generalisation performance. These results again directly contradict Hypothesis 5.
8. Experiment 5
This experiment sought to replicate the rule-seeking effect on the Type IV advantage over Type II using the vocabulary-learning paradigm of Experiment 2.
8.1 Methods
The stimuli, instructions and procedure were identical to those of Experiment 2, except that each participant was randomly assigned a Type II, or Type IV pattern, stated in terms of two or three of the properties disyllabic/trisyllabic, first-/second-syllable stress and stop/fricative consonants. A total of 176 participants completed the experiment. Eight were subsequently excluded for reporting a non-English L1, 31 for reporting deliberately choosing test-phase items that sounded different from the training items, 7 for reporting taking written notes, 3 for falling below the 10-out-of-32 criterion and 8 for multiple reasons. That left 119 valid participants, 33 in the Implicit-Promoting Type II condition, 31 in the Implicit-Promoting Type IV condition, 22 in the Explicit-Promoting Type II condition and 33 in the Explicit-Promoting Type IV condition.
8.2 Results
8.2.1 Hypothesis 1: Rule-seeking and rule-stating are influenced (but not wholly determined) by instructions, feedback and/or intention to learn
As in all previous experiments, both rule-seeking and rule stating were found in both training conditions (Figure 10). However, as in Experiment 2, training condition did not affect either of these two variables significantly (tables omitted to save space).
Test-phase performance as a function of training condition, rule-seeking, and rule-stating, Experiment 5. Plotting symbols: Black circle = Correct Stater; grey circle = Approximate Stater; crossed circle = Incorrect Stater; white circle = Non-Stater. A horizontal line segment marks the chance performance level of 50%.

8.2.2 Hypothesis 2: Stating a correct rule predicts better generalisation performance
Because there were no Correct or Approximate Staters in the Type II condition, the effects of Rule Correctness on pattern-conformity of test-phase responses were analysed only for Type IV. A complex survey design logistic-regression model with the pattern-conformity of each generalisation-test response as the dependent variable and Rule Correctness and Training Condition was fit as shown in Table 21. The large and highly significant coefficient for Rule Correctness shows that Correct and Approximate Stating increased the chances of a pattern-conforming test-phase response in the Explicit-Promoting condition. Incorrect Staters and Non-Staters in the Explicit-Promoting condition were marginally less likely to give a pattern-conforming response, but the coefficient for the interaction between Training Condition and Rule Correctness was small and non-significant, indicating that Correct and Approximate Stating facilitated pattern-conforming test-phase responses in both training conditions.
Summary of fitted logistic-regression model for pattern-conformity of generalisation-test responses, Experiment 5, Type IV only (2,048 responses from 64 participants).

8.2.3 Hypothesis 5: Rule-seeking is associated with better IFF/XOR and/or worse Family-resemblance performance
Rule-seeking had no significant effect on test-phase pattern-conformity of Type II vs. Type IV in either training condition. There was a non-significant numerical trend in the same direction as in Experiments 3 and 4 (table omitted to save space).
8.3 Discussion
The results of Experiment 5 did not directly contradict Hypothesis 5 the way Experiments 3 and 4 did, but Experiment 5 did not support Hypothesis 5 at all. The nonsignificant numerical trend went in the ‘wrong’ direction for Hypothesis 5, that is, to the benefit of Seekers over Non-Seekers in the Type IV condition but not in the Type II condition.
9. Discussion: Experiments 3–5
Participants in the Type II/IV experiments (Experiments 3–5), like those in the Type I experiments (Experiments 1 and 2), showed evidence of using both implicit and explicit learning. Rule-seeking and rule-stating were found in every condition of every experiment, and were facilitated in the Explicit-Promoting condition in Experiments 3 and 4 relative to the Implicit-Promoting condition. Some findings of the Type I experiments were not replicated. Correct Staters were much rarer; the generalisation test no longer showed a mode at or near 100% corresponding to Correct and Approximate Staters; and Correct or Approximate Stating no longer resulted in significantly more-abrupt learning curves or faster response times among Solvers. These differences from the Type I experiments can be traced to the same source: Since the completely correct rule is harder to find and state explicitly in the Type II/IV experiments than in the Type I experiments, any effect of rule correctness in the Type II/IV experiments originates mainly in the weaker effect of an approximately correct rule.
The results also confirmed the prediction that implicit and explicit learning can have different inductive biases. What was surprising was the direction of the difference: Rule-seeking benefited performance in the Type IV condition, but not the Type II condition (in Experiment 3 and the Explicit-Promoting condition of Experiment 4). In these experiments, the explicit and implicit processes are roughly equally successful on Type II (no significant effect of Seeker or interaction with it), but the implicit process is less successful than the explicit process on Type IV (significant positive interaction of Seeker with Type = IV). The effect of learning mode on bias was the exact opposite of what one would expect based on the theories and empirical studies of domain-general explicit learning reviewed in §2.
Where does this difference between phonological learning and non-linguistic learning come from? We consider two possible post hoc hypotheses, one based on between-domain differences in implicit learning, the other based on between-domain differences in explicit learning.
9.1 Option 1: Implicit phonological learning is feature-minimising
One possibility is that implicit learning works differently in phonology versus other domains. Specifically, a human learner might have a domain-general explicit learning process with a feature-minimisation bias, a domain-general implicit learning process without a feature-minimisation bias and a dedicated implicit phonological learning process with an especially strong feature-minimisation bias that pre-empts the general implicit process for phonological stimuli. Feature-minimisation bias is a well-established idea in phonology, for example, Chomsky & Halle (Reference Chomsky and Halle1968: 168, 221, 331, 334), Bach & Harms (Reference Bach, Harms, Stockwell and Macaulay1972), King (Reference King1969: 88–89), Smith (Reference Smith1973: 155–158), Kiparsky (Reference Kiparsky1982), Hayes (Reference Hayes, Darnell, Moravcsik, Noonan, Newmeyer and Wheatly1999), Pycha et al. (Reference Pycha, Nowak, Shin and Shosted2003), Gordon (Reference Gordon, Hayes, Kirchner and Steriade2004), Hayes & Wilson (Reference Hayes and Wilson2008), Hayes et al. (Reference Hayes, Zuraw, Siptár and Londe2009) and Hayes & White (Reference Hayes and White2013), to name only some proposals that explicitly ascribe a bias to human learners of natural language.Footnote 15 That would explain how switching from implicit to explicit learning can improve performance on Type IV relative to Type II in phonology, while doing the opposite in other domains.
However, there is empirical evidence against this alternative: In an in-person study that compared eight-feature phonological patterns with their feature-by-feature visual analogues using a task similar to the Implicit-Promoting condition of Experiment 1, performance was significantly better on Type IV than on Type II in both the phonological and the visual condition (Moreton et al. Reference Moreton, Pater and Pertsova2017: Experiments 1 and 2). Since Option 1 hypothesises that both the phonology-specific implicit process and the domain-general explicit process learn Type II better than Type IV, there is no way for Option 1 to explain this outcome, regardless of how many participants used each learning mode.
9.2 Option 2: Explicit learning is impeded by irrelevant features
A second possibility is that explicit learning works differently in phonology versus other domains – not because humans are endowed with a dedicated phonology-specific explicit learning mechanism, but because phonological stimuli have properties which are rarely found in other domains and which interact with the explicit process of serial hypothesis testing.
To see how this might happen, we note that the explicit-learning component of the domain-general two-systems hypothesis (§2) is based on data mainly from experiments in low-dimensional stimulus spaces like that in Figure 7, where the only features that vary are colour, shape and size. Phonological stimuli are different. The ones used here varied not only on the six experimentally manipulated dimensions of syllable count, labial vs. coronal, and so forth, but also on features like voicing and vowel height that were randomised to make distinct stimuli. They also varied on ad hoc phonological properties such as ‘ends with an F’, which participants readily invented. Typical phonological stimuli thus have many more pattern-irrelevant features than the non-linguistic patterns which formed the empirical basis of the explicit-learning component of the two-systems theory. Irrelevant features have been shown to increase errors and time- or trials-to-criterion in non-linguistic concept-learning tasks that are designed to encourage explicit reasoning (e.g., Archer et al. Reference Archer, Bourne and Brown1955; Peterson Reference Peterson1962; Kepros & Bourne Reference Kepros and Bourne1966; Keele & Archer Reference Keele and James Archer1967). Here, we propose a way in which they may also influence sensitivity to Type II vs. Type IV.
Suppose that explicit learners search for the relevant dimensions (‘attribute identification’; Haygood & Bourne Reference Haygood and Bourne1965) by serially testing one-dimensional rules (Neisser & Weene Reference Neisser and Weene1962; Wattenmaker et al. Reference Wattenmaker, McQuaid and Schwertz1995). In the Type IV condition, this is a promising strategy: Each relevant dimension, individually, can yield a one-feature rule that is 75% correct during Explicit-Promoting training, and that characterises 75% of the (all-positive) training items during Implicit-Promoting training. In contrast, one-feature rules based on the irrelevant dimensions are only 50% correct. A learner in the Type IV condition can use this difference in correctness rate to distinguish relevant from irrelevant dimensions. But in the Type II condition, any single relevant dimension yields a rule that is only 50% correct, thus making the relevant dimensions indistinguishable from the irrelevant ones. The serial-search procedure is bound to fail. One Type II participant described the failure thus:
I looked for many different kinds of rules to no avail. I tried going by the vowel at the beginning of the word. I tried going by what consonants were used, how many syllables, what consonants were used when certain numbers of syllables were used, the long and short sounds of vowels, and anything else I could think of. I couldn’t find a rule. From then on I decided to go more for gut feeling and finally I began to focus on memorising the words.
(Participant AJvCRg, Experiment 3, Type II, Explicit-Promoting)
Support for this explanation comes from the fact that in all three II/IV experiments, Seekers in the Type IV condition were much more likely than those in the Type II condition to mention at least one of the pattern-relevant features in their free-response answers (Table 22). Across all three experiments, there was a grand total of 2 Correct and 8 Approximate Type II Staters out of 103 Seekers, versus 0 Correct and 53 Approximate Type IV Staters out of 117 Seekers (Types II and IV significantly different from each other by Fisher’s exact test, odds ratio = 0.13,
 $p < 10^{-8}$
). Seekers in the Type IV condition, it seems, readily identified at least one relevant feature, whereas those in the Type II condition could hardly find the relevant features at all.
Proportion of valid Seekers mentioning at least one pattern-relevant feature in any free-response question.

The results of Experiments 3–5 can then be interpreted as follows: The implicit parallel system, being non-voluntary, is used by all participants, and learns Type IV better than Type II. The explicit serial system, when impeded by irrelevant features, rarely succeeds on Type II, but often finds a one-feature approximation to Type IV, giving Type IV a further boost among participants who voluntarily use the explicit system.Footnote 16
10. General discussion
The principal conclusions of the present study are that phonotactic learning, like non-linguistic learning, can happen implicitly or explicitly, and that the implicit and explicit processes can have different inductive biases (Table 23). These conclusions are strengthened when we note that the experiments could not cleanly sort participants into one group of exclusively explicit learners and another of exclusively implicit ones: What these experiments detected, they detected by comparing a less-explicit group with a more-explicit group. These conclusions converge with and extend other recent findings on the existence of implicit vs. explicit processes in phonological learning (Kimper Reference Kimper, Hansson, Farris-Trimble, McMullin and Pulleyblank2016; Chen Reference Chen2021; Moreton & Pertsova Reference Moreton, Pertsova, Scott and Waughtal2016; Moreton et al. Reference Moreton, Prickett, Pertsova, Fennell, Pater, Sanders, Bennett, Bibbs, Brinkerhoff, Kaplan, Rich, Handel and Cavallaro2021).
Summary of hypotheses tested in Experiments 1–5. G = gender scenario, V = vocabulary scenario.
 $\checkmark $
= supported; — = not supported;
 $\rightarrow \leftarrow $
= contradicted (significant result in opposite direction). EP = Explicit-Promoting condition. IP = Implicit-Promoting condition.

a One effect only marginally significant.
b Found for rule-stating for Type II only.
c Found only for Explicit-Promoting condition; not enough rule staters in Implicit-Promoting.
d Not enough rule staters in Type II, and no Correct Staters to analyse in Type IV.
One surprising finding was the unexpected direction of the effect of rule-seeking on inductive bias: More-explicit learning facilitated learning of Type IV patterns relative to Type II instead of hindering it. As discussed in §9, that result cannot be explained by positing a dedicated phonology-specific implicit learning process; instead, it has implications for the explicit component of the two-systems theory. Any adequate theory of domain-general explicit learning will have to explain explicit phonological learning as well, and so will need to take into account the effects of irrelevant features.
10.1 What goes on in phonological learning experiments?
Because learning experiments have come to play a major role in testing phonological theories, it is important to understand just what is happening in them. Researchers’ assumptions may be wrong in consequential ways. For example, the authors were surprised by participants’ ability to verbalise phonological features (§3.3.1), and reviewers were surprised by participants’ successful rule-seeking in conditions that were designed to discourage, misdirect, and frustrate it (§5). At a more mundane, but no less consequential, level, participants, especially in Internet-based experiments, may be using other non-psychological resources that experimenters would not know about without asking; for example, 5.1% of our participants reported taking written notes. (Their data were excluded from the analysis, as noted above in the individual ‘Results’ sections, but that was only possible because the questionnaire specifically asked about note-taking.)
To be sure, it may be that all of the paradigms used in this study were abnormally favourable to explicit learning, whereas those used in other studies elicited only implicit learning of precisely the sort that is responsible for natural first- or second-language acquisition. That would be very fortunate. However, we will not know for certain until we have a better understanding of what participants in phonological-learning experiments are actually doing. It is therefore important to scrutinise experimental paradigms for signs of learning-mode variety. The methods used in this article are one attempt at doing that, and other proposed methods for distinguishing implicit from explicit learning can be found in the literatures on non-linguistic learning and second-language learning that go far beyond simply asking whether participants can state the correct rule (see references in §2, above, as well as, e.g., Tunney & Shanks Reference Tunney and Shanks2003; Rebuschat Reference Rebuschat2013). What we find by applying them may affect the interpretation of previous studies, and may give researchers better control over future ones.
10.2 Ecological validity of lab-learned phonology
Most of the evidence bearing on the ecological validity of phonological learning in the lab (i.e., does it use the same processes as natural L1 or L2 learning?) comes from comparing inductive biases in the lab with typological asymmetries in natural language. The linking hypothesis motivating these comparisons is that the more closely lab-learning biases agree with natural-language typological asymmetries, the more likely it is that both reflect the influence of Universal Grammar. The agreement between typology and lab results is not strikingly close.
In terms of abstract pattern structure, learners in the lab tend to favour Type I over Type IV and Type IV over Type II (Moreton & Pater Reference Moreton and Pater2012a,Reference Moreton and Paterb; Gerken et al. Reference Gerken, Quam and Goffman2019; see also Glewwe Reference Glewwe2019: 168f.). In natural language, phonologically active classes defined by fewer features are indeed more common (Mielke Reference Mielke2004, Reference Mielke2008) – but on the other hand, phonologically active classes that can be expressed as Type II, like the left panel in Table 24, are more common than those that can be expressed as Type IV, like the right panel (Moreton & Pertsova Reference Moreton and Pertsova2014).
Examples of natural-language Type II and Type IV patterns, found by analysing P-Base (Mielke Reference Mielke2008; Moreton & Pertsova Reference Moreton and Pertsova2014). Features as in Chomsky & Halle (Reference Chomsky and Halle1968).

In terms of phonetic substance, phonetically motivated patterns are the norm in natural language, and it is the phonetically ‘unnatural’ patterns that linguists regard as demanding special explanation (Bach & Harms Reference Bach, Harms, Stockwell and Macaulay1972; Anderson Reference Anderson1981; Buckley Reference Buckley2000; Brohan & Mielke Reference Brohan, Mielke, Hyman and Plank2018). In the lab, however, substantive biases – those discriminating between patterns on the basis of phonetic motivation, such as final obstruent devoicing vs. final obstruent voicing – are weak relative to structural biases (Moreton & Pater Reference Moreton and Pater2012a; Moreton & Pater Reference Moreton and Pater2012b). (For opposing views, see Hayes & White Reference Hayes and White2013; Finley Reference Finley2017; Chen Reference Chen2020; Martin & Peperkamp Reference Martin and Peperkamp2020; Lin Reference Lin2023.) If substantive biases exist at all, they may be restricted to particular experimental conditions such situations of high uncertainty (Baer-Henney et al. Reference Baer-Henney, Kügler and van de Vijver2015; Huang & Do Reference Huang, Do, Jurgec, Duncan, Elfner, Kang, Kochetov, O’Neill, Ozburn, Rice, Sanders, Schertz, Shaftoe and Sullivan2022) or perceptual unclarity as in casual speech (Greenwood Reference Greenwood2016), or to particular kinds of phonetic motivation such as perception rather than production (Glewwe Reference Glewwe2019), or they may only emerge when the phonetic motivation is especially strong (Glewwe Reference Glewwe2022).
One interpretation of these mismatches between lab biases and typology, both in terms of abstract structure and in terms of phonetic substance, is that typical short-term phonological-learning experiments are ecologically invalid; that is, the learning processes they are ‘about’ are not the same ones used by natural L1 or L2 learners. If that is so, then making the experiments more lifelike ought to change the outcomes in a direction that more closely matches what is observed in natural-language typology. One example of this line of work is Martin & Peperkamp (Reference Martin and Peperkamp2020), which compared the learning of a typologically common vs. a typologically rare phonological pattern with vs. without sleep between training and testing (more vs. less lifelike). That study found no difference between the two conditions, but it could simply be that more is needed for adequate ecological validity than a night’s sleep – perhaps even as much as is needed to acquire phonotactic patterns in a natural second language (e.g., Trapman & Kager Reference Trapman and Kager2009).
An alternate interpretation of the lab-vs.-typology mismatches is that it is the linking hypothesis that is wrong, and that some interfering factor prevents natural-language typology from being an accurate reflection of biases in natural-language learning. A likely candidate for that other factor is asymmetries in the phonetic precursors available for phonologisation (Hyman Reference Hyman and Juilland1976; Ohala Reference Ohala and Jones1993; Blevins Reference Blevins2004). Suppose that inductive bias favours Type IV over Type II patterns, such that, given two phonetic precursors, one a continuous analogue of Type II, the other of Type IV, the probability of phonologising the Type II pattern from the same level and duration of exposure is 0.01, while the like probability for the Type IV pattern is 0.05. If Type II precursors outnumber Type IV precursors by 20 to 1 across the languages of the world, then phonologisation will create four times as many new Type II patterns as Type IV, despite the fivefold inductive bias in the opposite direction. That hypothesis could be tested by looking for discrepancies between what is available for phonologisation and what actually gets phonologised. That could be done across languages, by comparing phonetic typology with phonological typology to see if certain phonological patterns are systematically underrepresented in relation to their phonetic precursors (Hombert et al. Reference Hombert, Ohala and Ewan1979; Cole & Iskarous Reference Cole, Iskarous, Hume and Johnson2001; Moreton Reference Moreton2008; Myers & Padgett Reference Myers and Padgett2014), or across time, by comparing known precursors with their phonologised forms to see if phonologisation is unfaithful to precursors in systematic ways (Hayes Reference Hayes, Darnell, Moravcsik, Noonan, Newmeyer and Wheatly1999).
10.3 Phonotactic learning as concept learning
The present results give no reason to think that implicit or explicit phonotactic learning in the laboratory is anything but a special case of domain-general concept learning, using domain-general processes which only appear to be unique because the phonological stimulus space has properties rarely studied elsewhere, such as many pattern-irrelevant features (§9) or multiple instances of the same feature within a single stimulus (Moreton Reference Moreton2012: 167–168). The conclusion of §9, that learners in the present experiments seemed to be serially testing candidate features for relevance, thus supports models of concept learning in which features are serially tested for relevance, such as the mental-model theory (Goodwin & Johnson-Laird, Goodwin & Johnson-Laird Reference Goodwin and Johnson-Laird2011, Goodwin & Johnson-Laird Reference Goodwin and Johnson-Laird2013), RULEX (Nosofsky et al. Reference Nosofsky, Palmeri and McKinley1994b), or, within phonology, the proposal of Durvasula & Liter (Durvasula & Liter Reference Durvasula and Liter2020: 210), over models in which single- and many-feature candidate rules are tested simultaneously, such as Rational Rules (Goodman et al. Reference Goodman, Tenenbaum, Feldman and Griffiths2008).
However, the domain-specificity or otherwise of learning in phonology is a very large question that will not be settled by a handful of experiments. We therefore urge researchers to investigate more parallels or differences between phonological and non-phonological learning (Moreton et al. Reference Moreton, Pater and Pertsova2017). Clear and convincing evidence of substantive bias would argue for a special status for phonological learning, but there are many other avenues to explore. Do the biases seen in the acquisition and use of non-linguistic patterns show up in analogous phonological-learning experiments? Do they affect natural first- or second-language acquisition, or leave their imprint on natural-language typology? Within language, is phonological learning biased in a different way from morphological, lexical or syntactic learning? These questions can only be answered by thoroughgoing comparative study of inductive biases in analogous problems across domains.
Acknowledgements
The authors are indebted to Rachel Broad, Will Carter, Caleb Hicks and Josh Fennell for assistance with stimulus manufacture and questionnaire scoring; to Kenneth Kurtz, Joe Pater, Brandon Pricket, Lisa Sanders, Jen Smith and the UNC-Chapel Hill P-Side Caucus for discussion and comments; to Chris Wiesen of the Odum Institute for Social Science Research at UNC-Chapel Hill for statistical advice; to the anonymous reviewers and Phonology editors for their helpful scrutiny and suggestions; and to audiences at the Linguistics Association of Great Britain (2014), the Deutsche Gesellschaft für Sprachforschung (2015), the Boston University Conference on Language Development (2015), the Manchester Phonology Meeting (2015), UC Santa Cruz (2016), MIT (2016), UCLA (2017), the Linguistic Society of America (2018) and Rutgers University (2018).
Funding statement
This research was funded in part by a grant to the authors from the U.S. National Science Foundation (Grant No. BCS 1651105).
Competing interests
The authors declare no competing interests.