Anxiety and depression are highly prevalent mental disorders in adolescents, with prevalence rates from 14% (depression) to 32% (anxiety disorders) in a recent survey of 13- to 18-year-olds in the continental United States (Merikangas et al., Reference Merikangas, He, Burstein, Swanson, Avenevoli and Cui2010). Given these high rates, it is important to identify and understand the underlying developmental risk factors for anxiety and depression. Anxiety sensitivity (AS), or the fear of anxious arousal (Reiss, Reference Reiss1991), has been identified as an important developmental risk factor for anxiety and depression in children and adolescents (e.g., Allan, Capron, et al., Reference Allan, Capron, Lejuez, Reynolds, MacPherson and Schmidt2014; Noël & Francis, Reference Noël and Francis2011; Zavos, Rijsdijk, & Eley, Reference Zavos, Rijsdijk and Eley2012). In addition, AS is malleable, with interventions demonstrating reductions in AS as well as anxiety and depression symptoms (Schmidt, Capron, Raines, & Allan, Reference Allan, Korte, Capron, Raines and Schmidt2014; Schmidt et al., Reference Schmidt, Eggleston, Woolaway-Bickel, Fitzpatrick, Vasey and Richey2007). Given that AS is a malleable risk factor for anxiety and depression, it is important to understand the developmental trajectory of AS within adolescents. In particular, preliminary evidence suggests that adolescents may cluster into distinct developmental trajectories of AS (Weems, Haywayd, Killen, & Taylor, Reference Weems, Hayward, Killen and Taylor2002); however, to date only a single study has examined the issue of different AS trajectories, and no studies have examined whether these developmental trajectories may also reflect distinct patterns of risk for the development of anxiety and depression.
Weems (Reference Weems2008) proposed a developmental model of anxiety that incorporates AS. In his model, a stable anxious emotion construct underlies the heterogeneous expression of anxiety disorders in childhood and adolescence (Last, Perrin, Hersen, & Kazdin, Reference Last, Perrin, Hersen and Kazdin1996; Newman et al., Reference Newman, Moffitt, Caspi, Magdol, Silva and Stanton1996). Further, multiple influences form complex interactions to influence the expression of anxious emotion (i.e., the disorder-specific expression). In addition, the development of anxious emotion is described through a pattern of ordered complexity (Robertson & Combs, Reference Robertson and Combs1995). That is, multiple biological, cognitive, behavioral, and social factors determine a child's initial level and growth of anxious emotion. Whereas most adolescents will start with and continue on a low-stable anxious emotion trajectory, others will start with and continue on a high-stable trajectory, and still others may have an escalating (low starting point, increasing over time) or decreasing (high starting point, declining over time) trajectory. Given the high rate of comorbidity between anxiety and depression (e.g., Kessler, Chiu, Demler, & Walters, Reference Kessler, Chiu, Demler and Walters2005), and the common classification of anxious and depressive disorders hierarchically as part of an emotional distress disorder spectrum (e.g., Watson, Reference Watson2005), Weems's (Reference Weems2008) model can be easily extended to encompass depression symptoms in adolescence as well. To test the adequacy of his proposed developmental model, Weems (Reference Weems2008) explicitly called for person-centered approaches of anxiety-related constructs, such as AS, over time.
AS is the belief that anxious arousal can have deleterious physical, cognitive, or social effects (Reiss, Reference Reiss1991; Zinbarg, Barlow, & Brown, Reference Zinbarg, Barlow and Brown1997). Individuals high in AS believe that anxious arousal is particularly harmful, resulting in increased anxious arousal (Reiss & Havercamp, Reference Reiss and Havercamp1996). Further, AS is an important evaluative component of anxious arousal, because the absolute level of anxious arousal individuals experience appears less important than the appraisal of this arousal (Reiss, Reference Reiss1991; Weems, Hammond-Laurence, Silverman, & Ginsburg, Reference Weems, Hammond-Laurence, Silverman and Ginsburg1998).
Cross-sectional studies using factor mixture modeling (FMM) techniques in children and adults have provided some preliminary evidence of individuals clustering together at different levels of AS (i.e., AS classes). Across all FMM studies of AS, including a study examining baseline data from the current study, a normative AS class, consistent with a low-stable AS trajectory, and a high AS class, consistent with a high-stable AS trajectory, emerge (e.g., Allan, Korte, Capron, Raines, & Schmidt, Reference Allan, Korte, Capron, Raines and Schmidt2014; Allan, MacPherson, Young, Lejuez, & Schmidt, Reference Allan, MacPherson, Young, Lejuez and Schmidt2014; Allan, Raines, et al., Reference Allan, Raines, Capron, Norr, Zvolensky and Schmidt2014; Bernstein, Stickle, & Schmidt, Reference Bernstein, Stickle and Schmidt2013; Bernstein et al., Reference Bernstein, Stickle, Zvolensky, Taylor, Abramowitz and Stewart2010). However, in two studies by Allan and colleagues (e.g., Allan, Korte, et al., Reference Allan, Korte, Capron, Raines and Schmidt2014; Allan, Raines, et al., Reference Allan, Raines, Capron, Norr, Zvolensky and Schmidt2014), one in a college sample and another in a sample of adults seeking smoking cessation treatment, another class comprising individuals with moderate to high levels of AS also emerged.
Whereas FMM studies seem to suggest the presence of multiple AS classes, they cannot address whether these AS classes have distinct developmental trajectories. Longitudinal studies, particularly in adolescents, are needed for this. Growth mixture modeling (GMM) and cluster analysis have been used to examine trajectories of anxiety and depression symptoms in children and adolescents, with mixed results (e.g., Allan, Capron, et al., Reference Allan, Capron, Lejuez, Reynolds, MacPherson and Schmidt2014; Crocetti, Klimstra, Keijsers, Hale, & Meeus, Reference Crocetti, Klimstra, Keijsers, Hale III and Meeus2009; Morin et al., Reference Morin, Maïano, Nagengast, Marsh, Morizot and Janosz2011). However, only a single study has examined AS trajectories in adolescent children (e.g., Weems et al., Reference Weems, Hayward, Killen and Taylor2002). Weems et al. (Reference Weems, Hayward, Killen and Taylor2002) used cluster analysis to examine the trajectory of AS over 4 years in a sample of 1,756 adolescents (M age = 15.4 years, SD = 0.9). For the cluster analytic approach that Weems et al. (Reference Weems, Hayward, Killen and Taylor2002) used, the number of classes is hypothesized a priori, because there were no means available to compare solutions. Partially consistent with the developmental model of anxiety proposed by Weems (Reference Weems2008), they found four trajectories, a stable-low trajectory comprising 73% (n = 1,277) of the sample, an escalating trajectory comprising 18% (n = 320) of the sample, a fluctuating trajectory comprising 1% (n = 19) of the sample, and a stable-high trajectory comprising 8% (n = 140) of the sample. Weems et al. (Reference Weems, Hayward, Killen and Taylor2002) suggested that the fluctuating trajectory most likely reflected a class of unreliable responders. Although they had hypothesized four trajectories, they also reported results of a five-trajectory solution. The five-trajectory model consisted of a stable-low trajectory comprising 45% (n = 790) of the sample, an escalating trajectory comprising 19% (n = 330) of the sample, a fluctuating trajectory comprising 1% (n = 24) of the sample, a stable-high trajectory comprising 6% (n = 104) of the sample, and a fifth cluster, a sharply decelerating trajectory comprising 29% (n = 508) of the sample. The sharply decelerating and stable-low trajectories in the five-cluster solution appeared to be a further delineation of the stable-low trajectory in the four-trajectory solution. No other studies have examined whether there are differential patterns of growth in AS over time. Therefore, replication of these classes would be useful.
Given that AS has been identified as a risk factor for anxiety and depression (e.g., Naragon-Gainey, Reference Naragon-Gainey2010; Noël & Francis, Reference Noël and Francis2011; Olatunji & Wolitzky-Taylor, Reference Olatunji and Wolitzky-Taylor2009), it is likely that distinct AS profiles are implicated in the development of mood and anxiety symptoms as well. Relatively few studies have examined the relations between AS and anxiety and depression prospectively in adolescents. In a longitudinal cross-lagged model of AS, anxiety, and depression in an adolescent sample, Zavos, Rijsdijk, Gregory, and Eley (Reference Zavos, Rijsdijk, Gregory and Eley2010) found that AS at baseline significantly predicted anxiety and depression roughly 2 years later, controlling for initial anxiety and depression. In a study using data from the first 3 years of the sample used in the current study (n = 277), Allan, Capron, et al. (Reference Allan, Capron, Lejuez, Reynolds, MacPherson and Schmidt2014) conducted GMM to examine whether classes with different anxiety and depression symptoms trajectories emerged, including AS, gender, and comorbid psychopathology as predictors of class membership. Whereas there was no evidence of differential growth trajectories for depression symptoms, children were classified in three anxiety symptom trajectories, a high-accelerating class (n = 29), a moderate-declining class (n = 140), and a low-declining class (n = 106). Further, multinomial regression indicated that elevated AS scores were associated with increased odds of being in the high-accelerating class. However, this study only determined that AS was a risk factor for anxiety symptom trajectories, not whether children clustered into distinct developmental trajectories as proposed by Weems (Reference Weems2008). Only Weems et al. (Reference Weems, Hayward, Killen and Taylor2002) have examined whether classification into AS trajectories is associated with psychopathology. They found that adolescents in the stable-high and escalating profiles were more likely to have experienced a panic attack than were adolescents in the stable-low trajectory. To date, no study has examined whether AS trajectories predict anxiety and depression symptoms prospectively.
The purpose of the current study was to examine whether different developmental trajectories of AS emerged in a sample of adolescents as they progressed to young adulthood. Only one prior study has examined AS trajectories in adolescents, using cluster analysis (e.g., Weems et al., Reference Weems, Hayward, Killen and Taylor2002). Based on this study, it was hypothesized that three classes would emerge, one class consisting of adolescents with stable and low levels of AS, another class consisting of adolescents with initial moderate levels of AS increasing over time, and a third class consisting of adolescents with stable and high levels of AS. A secondary aim of the current study was to examine the prospective role of these profiles in the development and distal status of anxiety and mood symptoms. We were interested in (a) whether children could be classified into distinct anxiety and depression profiles based on AS profile status and (b) whether AS class status predicted children's final levels of anxiety and depression. It was expected that rates of growth of anxiety and depression would be distinct across AS classes and would be similar to their concomitant AS trajectories, demonstrating that the risk status conferred by AS is relatively stable across development. Whereas it has been found that AS prospectively predicts both anxiety and depression (e.g., Zavos et al., Reference Zavos, Rijsdijk and Eley2012), we hypothesized additional support for our classes by demonstrating that the trajectory an individual was in would be a significant predictor of anxiety and depression levels at the final time point.
Methods
Sample and procedure
The sample included 138 boys and 110 girls between the ages of 9 and 13 (M = 11.0, SD = 0.82) at the first data collection. Youth and their caregivers were recruited from a large metropolitan area to participate in a longitudinal study of the development of risky behaviors across adolescents. Commensurate with the racial makeup of surrounding areas, 49.5% of participants identified as European American, 34.1% African American, 3.6% Latino, 1.4% Asian, .5% Native American, and 10.9% reported they were of mixed ethnicity. Interested families were screened for proficiency in English and asked to complete annual surveys and behavioral tasks at the University of Maryland. At each data collection, students were compensated with prizes worth $15 to $35, including gift cards, games, and movies. All procedures were approved by the Institutional Review Board at the University of Maryland.
Data for the current analyses were drawn from the first six waves of the ongoing project and, for data modeling purposes, included only youth who had participated in at least three waves of the study. Consistent with a developmental approach, and to maximize data present, data for the current analyses was organized by child age, beginning with age 11 and ending with age 16. At Wave 1, the sample consisted of 6 children age 9, 63 children age 10, 102 children age 11, 76 children age 12, and 1 child age 13. Therefore, the maximum sample available was 171 at age 11, 247 at age 12, 248 at ages 13 and 14, 242 at age 15, and 179 at age 16. Attrition across waves of data collection was relatively low, and all students who participated in the first wave of data collection were invited to participate in all following waves (regardless of whether they did not attend previous appointments). Of the children who could have had data at a particular age, 3 (1.8%) were missing data at age 11, 6 (2.4%) were at age 12, 11 were at ages 13 and 14 (4.4%), 49 were at age 15 (20.2%), and 43 were at age 16 (24.0%). To assess for the impact of attrition, we correlated participation at each wave with age, gender, ethnicity, distress tolerance, and negative affect cores. Attrition was not significantly correlated with any study variables (all ps > .05), with the exception of a small (r = –.20) relation between participation at Wave 2 and Wave 6 child AS scores.
Measures
AS
AS was assessed using the Children's Anxiety Sensitivity Index (CASI; Silverman, Fleisig, Rabian, & Peterson, Reference Silverman, Fleisig, Rabian and Peterson1991). The CASI is an 18-item self-report measure of perceived anxiety-related sensations and experiences, including questions such as “Unusual feelings in my body scare me.” Youth are asked to rank each item on a Likert-type scale ranging from 1 (none) to 3 (a lot). Items are then summed to create a total score ranging from 18 to 54, with higher values representing greater AS. The CASI has been shown to be related to, but distinct from, trait anxiety (Muris, Schmidt, Merckelbach, & Schouten, Reference Muris, Schmidt, Merckelbach and Schouten2001) and predictive of panic attacks in community samples of adolescence (Rabian, Embry, & MacIntyre, Reference Rabian, Embry and MacIntyre1999). Further, the measure has adequate internal reliability and test–retest reliability in both a clinical and community sample of children (Silverman et al., Reference Silverman, Fleisig, Rabian and Peterson1991). The reliability in the current sample was also adequate; the Cronbach αs ranged from 0.74 to 0.84 across the six waves of data collection.
Internalizing symptoms
The Revised Children's Anxiety and Depression Scale (Chorpita, Yim, Moffitt, Umemoto, & Francis, Reference Chorpita, Yim, Moffitt, Umemoto and Francis2000) is a youth self-report measure of anxiety and depression symptoms. For the purposes of the current analyses, we used both the depressive symptoms subscale and a composite anxiety scale. The composite anxiety scale was created from 37 items tapping five domains of anxiety disorders, including social anxiety, separation anxiety, panic disorder, obsessive–compulsive disorder, and generalized anxiety. Youth were asked to rate how often they have specific thoughts and feelings on a 4-point Likert-type scale ranging from 0 (never) to 3 (always), including “I worry about things” and “I have trouble going to school in the mornings because I feel nervous or afraid,” with higher scores indicating greater levels of anxiety. The composite anxiety scale has been used in other studies and demonstrates acceptable internal reliability and convergent validity with other measures of anxiety (Ebesutani, Bernstein, Nakamura, Chorpita, & Weisz, Reference Ebesutani, Bernstein, Nakamura, Chorpita and Weisz2010; Ebesutani, Okamura, Higa-McMillan, & Chorpita, Reference Ebesutani, Okamura, Higa-McMillan and Chorpita2011; Ebesutani et al., Reference Ebesutani, Reise, Chorpita, Ale, Regan and Young2012). The depression subscale consists of 10 items. Youth are asked to rate how often they experience specific symptoms of depression, such as “I feel sad or empty.” Higher scores denote more depressive symptoms. The subscale has established validity and reliability in community samples of children (e.g., Chorpita, Moffitt, & Gray, Reference Chorpita, Moffitt and Gray2005). In the current study, reliability for both scales was adequate; the Cronbach αs ranged from 0.93 to 0.94 and from 0.80 to 0.84 across the six waves of data collection for the composite anxiety and depressive symptom scales, respectively.
Data analytic plan
Growth mixture models of CASI scores were examined in Mplus version 7.3 (Muthén & Muthén, Reference Muthén and Muthén1998–2012) using full information maximum likelihood and the Yuan–Bentler scaled chi-square adjustment, which is robust to both missing data and data nonnormality. Often in GMM and similar methods, there can be a trade-off between parsimony and fitting the most appropriate model. However, in general, loosening restrictions in a GMM model increases the likelihood of correct class enumeration (Bauer & Curran, Reference Bauer and Curran2004; Muthén & Muthén, Reference Muthén and Muthén2000). In the current study, we attempted to balance parsimony and examination of the best fitting model by fitting and comparing GMM models from the most to least restrictive (Jung & Wickrama, Reference Jung and Wickrama2008; Morin et al., Reference Morin, Maïano, Nagengast, Marsh, Morizot and Janosz2011) while increasing the number of classes. A series of models with the intercept and slope variance restricted to zero were fit (i.e., latent class growth analysis; Nagin & Odgers, Reference Nagin and Odgers2010). Following this, less restrictive models were fit, allowing for free but equal variance in the intercept and slope parameters. Finally, the least restrictive models were fit, with free intercept and slope variances and intercept-slope covariances within class. A quadratic growth term was included in all models. Given that models typically do not converge when the quadratic variance is free (e.g., Morin et al., Reference Morin, Maïano, Nagengast, Marsh, Morizot and Janosz2011), quadratic variance was restricted to zero in all GMMs. Model fit was compared using several fit indices, including the Akaike information criterion (AIC), the Bayesian information criterion (BIC), and the sample-size adjusted BIC, as well as the Lo–Mendell–Rubin likelihood ratio test (LMR-LRT) and bootstrapped LRT (BLRT). Lower AIC, BIC, and sample-size adjusted BIC values indicate better fit, whereas significant LMR-LRT and BLRT values for a model indicates that this model fits better than a model with one fewer class (McLachlan, Reference McLachlan1987; Nylund, Asparouhov, & Muthén, Reference Nylund, Asparouhov and Muthén2007; Tofighi & Enders, Reference Tofighi, Enders and Hancock2008). Although simulation studies have found that the LMR-LRT does not always identify the optimal class, it is typically successful at accurately identifying the maximum number of possible classes in GMM models (Nylund et al., Reference Nylund, Asparouhov and Muthén2007). Further, whereas simulation studies have provided mixed information regarding the most appropriate fit indices and statistics to use for model identification, the BIC has gathered the most support across mixture modeling approaches (e.g., Henson, Reise, & Kim, Reference Henson, Reise and Kim2007; Li, Cohen, Kim, & Cho, Reference Li, Cohen, Kim and Cho2009; Nylund et al., Reference Nylund, Asparouhov and Muthén2007) and was therefore preferentially considered when selecting the best fitting model. Finally, entropy, which is an assessment of how well individuals were categorized within classes, and ranging from 0 to 1, with higher values indicating greater class separation (Lubke & Muthén, Reference Lubke and Muthén2007), was provided.
Once the optimal number of classes was selected, anxiety and depression symptom trajectories were examined using the Bolck, Croon, and Hagenaars (Reference Bolck, Croon and Hagenaars2004) procedure within Mplus, a procedure which provides comparisons weighted by posterior probabilities of class membership that are unaffected by unequal variance between classes (Bakk & Vermunt, Reference Bakk and Vermunt2015; Vermunt, Reference Vermunt2010). Trajectories were modeled for anxiety and depression separately across classes, with the intercept centered on age 16 to examine between-class differences in levels of psychopathology at later adolescence. Intercept and slope differences were compared pairwise in Mplus using the model test command to provide Wald chi-square difference tests. A significant chi-square value indicated a significant difference between classes.
Results
Descriptive statistics and correlations
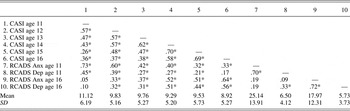
Means and correlations for CASI scores from age 11 to age 16 and Revised Children's Anxiety and Depression Scale anxiety and depression scores from age 11 to age 16 are provided in Table 1.
Bivariate correlations and descriptive statistics for Year 1 through Year 6 anxiety sensitivity and anxiety and depression at Year 1 and Year 6

Note: N = 135–241 for means. N = 69–168 for correlations. CASI, Children's Anxiety Sensitivity Index; RCADS, Revised Children's Anxiety and Depression Scale; Anx, RCADS anxiety subscale; Dep, RCADS depression subscale.
*p ≤ .05.
GMM of AS trajectories
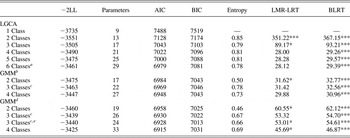
GMM, with time centered on age 11, was conducted in a series of models, beginning with the most restrictive models (i.e., the LGCA models; Nagin & Odgers, Reference Nagin and Odgers2010). Model fit indices and statistics are provided in Table 2. The model that fit best and had the least restrictions on intercept and slope variance was preferred. Ultimately, the best fitting, least restrictive model was the three-class model with intercept and slope variance as well as the intercept and slope covariance free across classes. This model had the lowest BIC value across models that converged. Further, the BLRT value was significant, indicating that this model fit better than a two-class model with equivalent parameter restrictions. Although entropy, at 0.67, was lower in this model compared to the three-class models with more restrictions, this is consistent with past studies comparing unrestricted to more restricted GMMs. In this model, two of the three classes had nonsignificant quadratic growth rates. Therefore, the quadratic growth rate was set to zero in these two classes. This model demonstrated lower AIC and BIC values, and the LMR-LRT and BLRT were both significant, indicating improved model fit. Therefore, the best fitting model was determined to be a three-class model with intercept, slope, and intercept–slope covariance freed and the quadratic term not modeled for two of the three classes.
Fit indices for growth mixture models

Note: LGCA, Linear growth curve analysis; −2LL, −2 log likelihood; AIC, Akaike information criterion; BIC, Bayesian information criterion; LMR-LRT, Lo–Mendell–Rubin likelihood ratio test; BLRT, Bayesian likelihood ratio test; GMM, growth mixture modeling.
a Classes beyond the 6 Class model were not explored as there were less than 10 individuals in a single class in the 6 Class model, which is the suggested minimum for interpretability.
b Intercept, slope variance estimated; intercept and slope covariance free across classes.
c Nonsignificant negative residual for the slope variance parameter across classes.
d Intercept and slope variance as well as intercept and slope covariance free across classes.
e Quadratic terms were restricted to 0 in two of the three classes.
*p ≤ .05. ***p ≤ .001.
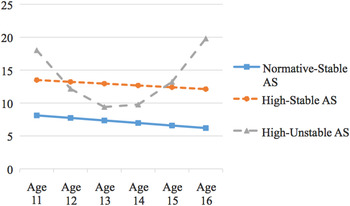
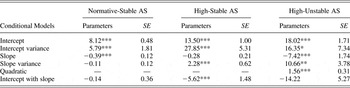
Estimated trajectories of AS by class are provided in Figure 1 and parameter estimates by class are provided in Table 3. There were 152 youths (61%; 92 males, 60 females) in a class labeled normative-stable with a posterior probability of .83. Youths with this trajectory had initial low levels of AS at age 11 (B = 8.12, p < .05) that slightly declined as children grew older (B = –0.39, p < .05). There were 84 youths (34%; 41 males, 43 females) in a class labeled high stable with a posterior probability of .87. Youths with this trajectory had initial high AS levels (B = 13.50, p < .05) that were stable as children grew older (B = –0.28, p > .05). Finally, there were 12 youths (5%; 5 males, 7 females) in a class labeled high unstable, with a posterior probability of .83. Youths with this trajectory had initial elevated AS levels (B = 18.02, p < .05) that declined until age 13 but increased from age 14 on, as indicated by the negative slope parameter (B = –7.42, p < .05) and positive quadratic parameter (B = 1.56, p < .05). Because children were different ages at different waves of data collection, leaving open the possibility of cohort effects, and because differences in gender have been detected in anxiety trajectories previously, models were reanalyzed including the wave for each child at age 13 (at this age, most children were classified by wave) and gender as covariates predicting class status. There were only slight differences in classification (i.e., 154 children were classified in the normative-stable class, 79 children were classified in the high-stable class, and 15 children were classified in the high-unstable class), and neither wave nor gender were significant predictors of class, suggesting stability in classification even with the inclusion of covariates.
(Color online) Estimated anxiety sensitivity trajectories from age 11 to age 16.

Results from the final three-class anxiety sensitivity growth mixture model

Note: AS, Anxiety sensitivity as measured by the Children's Anxiety Sensitivity Index. Variance for the quadratic term was restricted to zero by convention. The mean of the quadratic term in normative stable and high-stable AS classes was restricted to zero.
*p ≤ .05. **p ≤ .01. ***p ≤ .001.
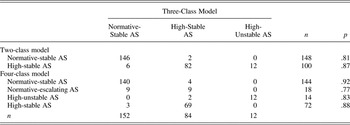
To provide context for classification of adolescents within the three-class model, class membership was compared in this model to the two- and four-class models, also with free intercepts, slopes, and slope–intercept covariances across classes (see Table 4). In the two-class model, similar to the three-class model, normative-stable and high-stable classes emerged. The majority of adolescents from the two-class normative-stable class were also captured by the three-class normative-stable class. The majority of adolescents in the two-class high-stable class remained in this class in the three-class model. In addition, all adolescents who ended up in the high-unstable class in the three-class model were in the high-stable class in the two-class model. Across the three- and four-class models, similar normative-stable, high-stable, and high-unstable classes emerged. In the four-class model, an additional normative-escalating class emerged (n = 18). The majority of adolescents in the three-class normative-stable class remained in this class in the four-class model. The majority of adolescents in the three-class high-stable class also remained in the high-stable class in the four-class model. All adolescents in the three-class high-unstable class remained in this class in the four-class model. The stability of class membership across models with increasing classes provides support for the classification of adolescents in the three-class model.
Comparisons of class membership across the two-, three-, and four-class solutions with posterior probabilities

Note: AS, Anxiety sensitivity.
Comparison of anxiety and depression trajectories by AS classes
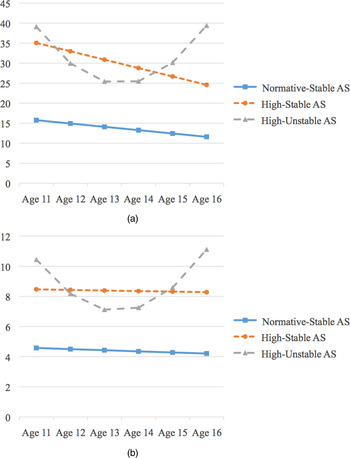
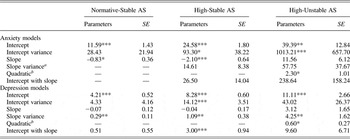
A growth curve model with free intercepts, slopes, and intercept–slope covariance by group, weighted by class probabilities, was fit to anxiety symptoms from age 11 to age 16 with time centered on age 16. A nonsignificant negative residual for age 16 anxiety was fixed to zero in the low-stable class, and the slope variance parameter was fixed to zero in the low-stable and high-stable classes to allow the model to converge. Model parameters are provided in the top panel of Table 5 and the best fitting anxiety trajectories by class are provided in Figure 2a. Model fit was not improved by inclusion of the quadratic term for the low-stable class (χ2 = 0.72, df = 1, p > .05) or the high-stable class (χ2 = 1.56, df = 1, p > .05). Model fit was improved by inclusion of the quadratic term for the high-unstable class (χ2 = 5.15, df = 1, p < .05). The intercept (age 16 anxiety) was significantly higher in the high-stable class (B = 24.58, SE = 1.80) compared to the intercept in the low-stable class (B = 11.59, SE = 1.43; χ2 = 27.27, df = 1, p < .05). Although findings regarding the high-unstable class should be interpreted with caution given the small sample size in the high-unstable class, the intercept was also significantly higher in the high-unstable class (B = 39.39, SE = 12.84) compared to the intercept in the low-stable class (χ2 = 4.59, df = 1, p < .05). In contrast, the intercepts were not significantly different in the high-stable and high-unstable classes (χ2 = 1.27, df = 1, p > .05). The slope did not differ between the high-stable (B = –2.10, SE = 0.64) and low-stable classes (B = –0.83, SE = 0.36; χ2 = 2.46, df = 1, p > .05). The slope of the high-unstable class was not directly comparable to the slopes of the other two classes because of the inclusion of the quadratic term in this class.
(Color online) (a) Estimated anxiety symptom trajectories by anxiety sensitivity class and (b) estimated depression symptom trajectories by anxiety sensitivity class.

Model parameters for the best-fitting models of anxiety and depression symptoms by class

Note: AS, Anxiety sensitivity.
a Slope variance was fixed to zero.
b Quadratic was fixed to zero.
*p ≤ .05. **p ≤ .01. ***p ≤ .001.
A growth curve model with free intercept, slopes, and intercept–slope covariance by groups, weighted by class probabilities, was fit to depression symptoms from age 11 to age 16 with time centered on age 16. A nonsignificant negative residual for age 16 anxiety was fixed to zero in the low-stable class. Model parameters are provided in the bottom panel of Table 5 and the best fitting depression trajectories by class are provided in Figure 2b. Model fit was not improved by inclusion of the quadratic term for the low-stable class (χ2 = 0.13, df = 1, p > .05) or the high-stable class (χ2 = 0.12, df = 1, p > .05). Model fit was improved by inclusion of the quadratic term for the high-unstable class (χ2 = 4.81, df = 1, p < .05). The intercept (age 16 depression) was significantly higher in the high-stable class (B = 8.28, SE = 0.60) compared to the intercept in the low-stable class (B = 4.21, SE = 0.52; χ2 = 19.16, df = 1, p < .05). Again, although findings regarding the high-unstable class should be interpreted with caution given the small sample size, the intercept was also significantly higher in the high-unstable class (B = 11.11, SE = 2.66) compared to the intercept in the low-stable class (χ2 = 6.52, df = 1, p < .05). In contrast, the intercepts were not significantly different in the high-stable and high-unstable classes (χ2 = 1.04, df = 1, p > .05). The slope did not differ between the high-stable (B = –0.04, SE = 0.17) and low-stable classes (B = –0.07, SE = 0.12; χ2 = 0.02, df = 1, p > .05). The slope of the high-unstable class was not directly comparable to the slopes of the other two classes because of the inclusion of the quadratic term in this class.
Discussion
In the current study, and partially consistent with our hypothesis, three classes (i.e., normative-stable, high-stable, and high-unstable) were identified using an unrestricted form of GMM. In a prior study examining AS trajectories using a more restricted form of GMM (i.e., cluster analysis), Weems et al. (Reference Weems, Hayward, Killen and Taylor2002) found four classes, a stable-low trajectory comprising 73% of the sample, a stable-high trajectory comprising 8% of the sample, an escalating trajectory comprising 18% of the sample, and a fluctuating trajectory comprising 1% of the sample. The high-stable and normative-stable classes in the current study are similar in trajectory to the stable-low and stable-high profiles found by Weems et al. (Reference Weems, Hayward, Killen and Taylor2002), although a greater percentage of adolescents were classified in the high-stable class (34%) in the current study than were in this class (8%) in the Weems et al. study. This discrepancy is likely due to the difference in model-imposed restrictions. Whereas cluster analysis operates under the assumption of equal variance across classes, GMM can loosen this restriction, which tends to improve model fit and class enumeration (Bauer & Curran, Reference Bauer and Curran2004; Muthén & Muthén, Reference Muthén and Muthén2000).Footnote 1 Given the discrepancies in variance in the high-stable class and in the normative-stable class in the current study, it appears that allowing for less restrictive models of the AS trajectory is important for correctly classifying individuals in more or less at-risk profiles.
In the current study, a small class of adolescents with fluctuating AS trajectories was reported (5% of the sample). A small class of adolescents with fluctuating AS trajectories was also found in Weems et al. (2002; 1% of the sample). The shape of the trajectory was different in the current study than it was in Weems et al. (Reference Weems, Hayward, Killen and Taylor2002), with inconsistent patterns of increases and declines between studies. Given that the findings were inconsistent across both studies, it is possible that these classes are spurious, capturing unreliable responders. The high-unstable class would need to be replicated in future studies before it could be substantively interpreted from a theoretical perspective.
The results of the current study partially support the developmental model of anxiety proposed by Weems (Reference Weems2008). Whereas Weems (Reference Weems2008) proposed four trajectories, he suggested that most children would start with and continue on a low-stable trajectory and that others would start with and continue on a high-stable trajectory. This is consistent with the findings of the current study as well as the consistent findings of high and normative AS classes in prior taxometric and FMM studies in child and adult community and clinical samples (Allan, Korte, et al., Reference Allan, Korte, Capron, Raines and Schmidt2014; Allan, MacPherson, et al., Reference Allan, MacPherson, Young, Lejuez and Schmidt2014; Bernstein et al., Reference Bernstein, Stickle and Schmidt2013; Schmidt, Kotov, Lerew, Joiner, & Ialongo, Reference Schmidt, Kotov, Lerew, Joiner and Ialongo2005). Whereas escalating and decreasing trajectories were not uncovered, the high-unstable trajectory, if replicated, is consistent with Weems's (Reference Weems2008) model. Weems suggests that an adolescent on a decreasing profile of anxious emotion could start to show increasing levels of anxiety if a series of negative social events or a traumatic stressor were to occur. In support of this, McLaughlin and Hatzenbuehler (Reference McLaughlin and Hatzenbuehler2009) have found that stressful life events can impact AS levels longitudinally in a sample of adolescents.
There are several possible explanations as to why the trajectories in the current study do not completely overlap with the proposed trajectories of Weems (Reference Weems2008). It is possible that sample size may have precluded small trajectories with limited differences to the trajectories already captured. Support for this supposition is found in the classes that emerged in the four-class model. Although this model fit worse than the three-class model, a small class of adolescents was classified by a normative-escalating trajectory. It may be that the current study was underpowered to capture a normative-escalating trajectory, especially given the few individuals in this trajectory (n = 18) and the similarity in the pattern of growth in this trajectory compared to the normative- and high-stable trajectories (i.e., all were linear trajectories). In addition, although methods such as GMM can model growth beyond mere linear growth (i.e., quadratic), an effort is made to model growth parsimoniously. Therefore, complex growth trajectories that might be occurring for a subset of adolescents, such as alternating increasing and declining patterns, might go undetected.
An alternate possibility is that AS does not fit the developmental model of anxious emotion as proposed by Weems (Reference Weems2008). AS captures the level of anxious emotion that individuals consider problematic and not the absolute level of anxious emotion an individual feels. Therefore, individuals may be better captured by stable-high and normative trajectories of AS and an adolescents placement in one of these trajectories may be just one of many factors that determines an adolescents anxious emotion trajectory. For example, traumatic stressful events might be another important component in determining an adolescent's anxious emotion trajectory. In support of this notion, Weems and Graham (Reference Weems and Graham2014) found different trajectories of posttraumatic stress (PTS) symptoms in a sample of fourth- through eighth-grade children measured 24, 30, and 36 months after Hurricane Katrina. They found that whereas some children displayed stable low levels of PTS symptoms and others displayed stable high levels of PTS symptoms post-Katrina, other groups emerged also, reflecting increasing, decreasing, and moderate levels of PTS symptoms. Further, severity of hurricane experience and coping style significantly impact post-Katrina trajectory, such that less severe experiences and positive coping strategies were associated with greater rates of resiliency. It might be that AS, operating as a relatively stable trait characteristic, traumatic life events, coping behaviors, and other factors all combine to reflect an individual's anxious emotion trajectory. This conceptualization of AS fits with a predisposition model of AS in which AS is a heritable and stable individual difference (i.e., trait; Reiss & Havercamp, Reference Reiss and Havercamp1996; Stein, Jang, & Livesly, Reference Stein, Jang and Livesley1999).
Support for the AS trajectories was provided by the predictive utility of the AS classes for the development of anxiety and depression symptoms. Class status predicted elevated levels of anxiety and depression at age 16 for adolescents in the high-stable and high-unstable profiles as compared to the normative-stable profile. Whereas prospective studies have provided evidence that high AS generally predicts later anxiety and depression symptoms (Grant, Beck, & Davila, Reference Grant, Beck and Davila2007; Schmidt, Zvolensky, & Maner, Reference Schmidt, Zvolensky and Maner2006), this is the first study to demonstrate that risk for anxiety and depression can be predicted by an individual's AS trajectory. Further, consistent with prior studies examining anxiety and depression longitudinally in adolescents (e.g., Holsen, Kraft, & Vittersø, Reference Holsen, Kraft and Vittersø2000; Olatunji & Cole, Reference Olatunji and Cole2009), there were only modest (and in the case of anxiety, nonsignificant) relations between age 11 anxiety and depression and age 16 anxiety and depression. Given these modest rates of cross-time stability for anxiety and depression, children at risk for mood and anxiety disorders might be usefully identified by their AS trajectory, especially children demonstrating a high and stable level of AS.
Additional support for the AS profiles was provided in that classification of adolescents within profiles was useful in determining adolescents anxiety and depression trajectories. Specifically, the anxiety and depression symptoms profiles by class were similarly shaped to the GMM-extracted AS profiles. That is, adolescents in the normative-stable AS class had normative and stable levels of anxiety and depression and adolescents in the high-stable AS class had high and stable levels of depression, and high, albeit declining levels of anxiety. Individuals in the high-unstable AS class had similar high-unstable anxiety and depression profiles as well. Past studies of anxiety and depression trajectories in adolescence have yielded mixed findings as to the number of classes, with between two to five profiles reported (e.g., Allan, Capron, et al., Reference Allan, Capron, Lejuez, Reynolds, MacPherson and Schmidt2014; Crocetti et al., Reference Crocetti, Klimstra, Keijsers, Hale III and Meeus2009; Feng, Shaw, & Silk, Reference Feng, Shaw and Silk2008; Morin et al., Reference Morin, Maïano, Nagengast, Marsh, Morizot and Janosz2011; Sterba, Prinstein, & Cox, Reference Sterba, Prinstein and Cox2007). Given these equivocal findings, the status of AS as a risk factor for both anxiety and depression, and the heterogeneous nature of anxiety symptoms in adolescents (e.g., Last et al., Reference Last, Perrin, Hersen and Kazdin1996), it may prove more effective to identify adolescents in at-risk trajectories by AS levels instead of by anxiety and mood levels.
The identification of a high-stable trajectory of adolescents has important clinical implications. Individuals in this trajectory were at risk for elevated anxiety and depression symptoms across the developmental period included in this study (i.e., ages 11 to 16). Although AS has been conceptualized as a stable individual difference, there is evidence to suggest that AS is also malleable (e.g., Broman-Fulks & Storey, Reference Broman-Fulks and Storey2008; Schmidt et al., Reference Schmidt, Eggleston, Woolaway-Bickel, Fitzpatrick, Vasey and Richey2007), and that amelioration of AS through brief, AS-targeted interventions leads to reductions in anxiety and depression symptoms in adults (Norr, Allan, Macatee, Keough, & Schmidt, Reference Norr, Allan, Macatee, Keough and Schmidt2014; Schmidt et al., Reference Schmidt, Capron, Raines and Allan2014). Therefore, downward extensions of adult-focused AS interventions might result in similar AS reductions and subsequent anxiety and depression decreases in adolescents on high-stable AS trajectories. Finally, in line with Weems's (Reference Weems2008) developmental model of anxious arousal, anxiety symptoms were compiled across anxiety disorders in the current study. Examining developmental trajectories of AS, anxious arousal, and specific anxiety disorders would be a useful extension of the current study.
Limitations
There are several limitations of the current study to be considered. First, GMM and similar techniques require replication. This study is the first study to examine AS trajectories in an adolescent sample using this method, and only the second examining trajectories of AS in adolescents (e.g., Weems et al., Reference Weems, Hayward, Killen and Taylor2002). As such, further studies are needed to support the conclusions of the current study. Second, the present study was conducted in a community sample, and no diagnostic information was available. Replication of the current study in a sample that contained diagnostic outcome data would be particularly informative. Third, collection of diagnostic data would also address another weakness, the possibility that the similar pattern of trajectories for anxiety and depression symptoms reflects a common internalizing facet.
Conclusions
Despite the limitations, there are several strengths of the current study. This study is the first to use GMM to model adolescent AS and to examine how these trajectories can be used to identify later risk for anxiety and depression as well as trajectories of anxiety and depression. These findings partially support the developmental model of Weems (Reference Weems, Hayward, Killen and Taylor2002). Based on these findings and prior AS FMM findings, we suggest that AS may operate as one of many risk factor variables that can determine whether an individual is likely to start out in a high or low anxious emotion trajectory. Studies classifying adolescents into high and low AS classes and then examining the relations among AS trajectory, environmental factors, and anxiety and depression profiles should be conducted to validate the status of AS as a categorical risk factor and the interactive relation between AS profile and environment in determining an adolescent's anxiety and depression trajectory.