INTRODUCTION
Corridor disease, East Coast fever and January disease (Zimbabwe theileriosis) are syndromes caused by Theileria parva. Infections result in a lymphoproliferative pathology that is associated with high mortality in cattle (Norval et al. Reference Norval, Perry and Young1992). Historically T. parva was classified into 3 subspecies based on biological and clinical differences namely, Corridor disease (Theileria parva lawrencei), East Coast fever (Theileria parva parva) and January disease (Theileria parva bovis) (Uilenberg, Reference Uilenberg1976; Lawrence, Reference Lawrence1979). Serological cross-reaction and genetic similarity between the various subspecies has led to the abolishment of this classification system, with T. parva being currently distinguished by their host origin as either cattle- or buffalo-adapted (Norval et al. Reference Norval, Lawrence, Young, Perry, Dolan and Scott1991). East Coast fever and January disease are caused by transmission between carrier and susceptible cattle (Young et al. Reference Young, Leitch, Newson and Cunningham1986; Koch et al. Reference Koch, Norval, Ocama and Munatswa1992). In contrast, Corridor disease occurs when T. parva is transmitted from carrier Cape buffalo (Syncerus caffer) to cattle (Neitz et al. Reference Neitz, Canham and Kluge1955; Neitz, Reference Neitz1957). While cattle carrier states have been shown to occur under laboratory conditions for Corridor disease, no carrier state has been confirmed for cattle under field conditions in South Africa (Neitz, Reference Neitz1958; Barnett and Brocklesby, Reference Barnett and Brocklesby1966; Potgieter et al. Reference Potgieter, Stoltsz, Blouin and Roos1988). Concerns do, however, exist that buffalo-derived T. parva could establish itself in a carrier state in cattle that can lead to a situation similar to that found in East Africa with East Coast fever (Potgieter et al. Reference Potgieter, Stoltsz, Blouin and Roos1988; Yusufmia et al. Reference Yusufmia, Collins, Nkuna, Troskie, Van den Bossche and Penzhorn2010).
In 1902, East Coast fever was introduced from East Africa into South Africa (Theiler, Reference Theiler1904), but was eradicated by a strict quarantine, systematic dipping and slaughter campaign of affected cattle by 1956 (Neitz, Reference Neitz1957). As such, East Coast fever is still present in East and southern Africa, but is considered to be absent in South Africa (Potgieter et al. Reference Potgieter, Stoltsz, Blouin and Roos1988; Sibeko et al. Reference Sibeko, Geysen, Oosthuizen, Matthee, Troskie, Potgieter, Coetzer and Collins2010). Corridor and January disease were first identified in Zimbabwe, with the latter never considered present in South Africa (Neitz, Reference Neitz1957; Potgieter et al. Reference Potgieter, Stoltsz, Blouin and Roos1988). Corridor disease was first recognized in South Africa in the corridor formed between the historical Hluhluwe and Umfolozi game parks, hence the name (Neitz et al. Reference Neitz, Canham and Kluge1955). The current endemic regions in South Africa include the Hluhluwe-Imfolozi Park (Kwa-Zulu Natal), the Kruger National Park (KNP) and regions between and surrounding these areas (Potgieter et al. Reference Potgieter, Stoltsz, Blouin and Roos1988). Rhipicephalus appendiculatus, the main tick vector is, however, widespread across the North-West and Northern Provinces, as well as Mpumalanga, Kwa-Zulu Natal and the eastern parts of Eastern Cape (Estrada-Peña, Reference Estrada-Peña2003). R. zambeziensis, another important vector has a limited geographical range in the north-eastern and western regions of the Northern Province (Walker et al. Reference Walker, Norval and Corwin1981; Lawrence et al. Reference Lawrence, Norval and Uilenberg1983). The geographical range of T. parva will expand if infected vector ticks or carrier buffalo are introduced into non-endemic regions of South Africa. The movement of buffalo outside the endemic disease regions is therefore strictly regulated by the Department of Agriculture, Forestry and Fisheries (Animal Disease Act 1984, Act No. 35), to prevent disease outbreaks among cattle, that is totally naïve to T. parva in South Africa (Thompson et al. Reference Thompson, Latif, Oosthuizen, Troskie and Penzhorn2008). This is mainly to prevent disease outbreaks among cattle and the potential establishment of a carrier state in cattle that will lead to a situation that resembles that of the original East Coast fever epidemic (Yusufmia et al. Reference Yusufmia, Collins, Nkuna, Troskie, Van den Bossche and Penzhorn2010).
‘Disease free’ buffalo have become a lucrative commodity due to the expansion of the eco-tourism trade in South Africa and translocation of buffalo depends on their disease-free status (Collins et al. Reference Collins, Allsopp and Allsopp2002; Thompson et al. Reference Thompson, Latif, Oosthuizen, Troskie and Penzhorn2008). Buffalo are tested for T. parva infection by serology (indirect fluorescent antibody test) and real-time hybridization PCR before translocation (Burridge and Kimber, Reference Burridge and Kimber1972; Sibeko et al. Reference Sibeko, Oosthuizen, Collins, Geysen, Rambritch, Latif, Groeneveld, Potgieter and Coetzer2008). It was recently shown that up to 10% of free-ranging buffalo from National Parks with mixed infections of T. parva and T. sp. (buffalo) could be misdiagnosed due to suppression of PCR using the real-time hybridization test (Pienaar et al. Reference Pienaar, Potgieter, Latif, Thekisoe and Mans2011). Ambiguous results, difficult to interpret, are occasionally found for T. parva-negative samples that are positive for T. sp. (buffalo)-like parasites (Pienaar et al. Reference Pienaar, Potgieter, Latif, Thekisoe and Mans2011). The latter parasite has not been shown to be infective to cattle or to be pathogenic and is not a concern for the Veterinary Authorities in South Africa (Mans et al. Reference Mans, Pienaar, Latif and Potgieter2011; Pienaar et al. Reference Pienaar, Potgieter, Latif, Thekisoe and Mans2011). As such, more accurate and specific assays are needed for accurate diagnosis of T. parva in carrier buffalo. The current study describes the Hybrid II assay, an improved real-time hybridization PCR assay that is not affected by mixed-infections of T. sp. (buffalo)-like parasites and T. parva.
MATERIALS AND METHODS
Collection of blood samples, DNA extraction and real-time hybridization assay
Buffalo and cattle samples submitted to the Parasites, Vectors and Vector-Borne Diseases (PVVD) laboratory during 2008–2011 for routine T. parva diagnosis were processed for analysis. Genomic DNA was extracted using the automated MagnaPure technology (Roche) and analysed using the real-time hybridization assay of Sibeko et al. (Reference Sibeko, Oosthuizen, Collins, Geysen, Rambritch, Latif, Groeneveld, Potgieter and Coetzer2008). Briefly, 200 μl of blood were used for extraction, DNA eluted in 100 μl of elution buffer and 2 5 μl of DNA (∼15–50 ng/μl) used as template (Pienaar et al. Reference Pienaar, Potgieter, Latif, Thekisoe and Mans2011).
The hybridization assay of Sibeko et al. (Reference Sibeko, Oosthuizen, Collins, Geysen, Rambritch, Latif, Groeneveld, Potgieter and Coetzer2008) employs 2 different hybridization probe sets. A 640 nm probe set detects T. parva-positive samples, while a 705 nm probe set detects any member of the Theileria genus amplified by the hybridization primer set. It is known that T. parva, T. sp. (buffalo) and T. sp. (bougasvlei) are amplified by the hybridization assay's primer set (Mans et al. Reference Mans, Pienaar, Latif and Potgieter2011; Pienaar et al. Reference Pienaar, Potgieter, Latif, Thekisoe and Mans2011). Three results can thus be obtained: (i) negative samples lack any amplification profiles in the 640 nm and 705 nm detection channels; (ii) T. parva-positive samples give amplification profiles at 640 nm and 705 nm; (iii) T. sp. (buffalo)-like positive samples gives amplification profiles at 705 nm only (Pienaar et al. Reference Pienaar, Potgieter, Latif, Thekisoe and Mans2011). Based on the criteria above, diagnostic samples analysed by the hybridization real-time PCR assay were selected for analysis in this study that included 525 negative samples, 860 T. parva-positive samples (689 buffalo and 171 cattle) and 1036 T. sp. (buffalo)-like positive samples.
Design of the Hybrid II assay
A Theileria genus-specific forward and a T. parva-specific reverse primer, referred to as the Hybrid II primer set were designed to amplify a 145 bp fragment of the V4 hypervariable region from the 18S SSU RNA gene (Fig. 1). The hybridization probe pair previously used for detection of T. parva (Sibeko et al. Reference Sibeko, Oosthuizen, Collins, Geysen, Rambritch, Latif, Groeneveld, Potgieter and Coetzer2008), was used to detect T. parva at 640 nm.
Summary of the design of the Hybrid II assay. Indicated is the 145 bp region amplified from the V4 hypervariable region of the 18S SSU RNA. Theileria-specific (TgF) and T. parva-specific reverse (TpR) primer as well as the anchor and probe regions are marked with arrows and dark shading. Differences between sequences are shaded in grey. The closest related sequences to T. parva are included (T. sp. (buffalo) and T. sp. (bougasvlei)) as well as variants of T. parva.

Optimization of the Hybrid II assay conditions
The Hybrid II assay was initially developed using 4 μl of LightCycler-FastStart DNA MasterPlus Hybridization mix (Roche Diagnostics, Mannheim, Germany), or 4 μl of LightCycler® 480 Genotyping Master mix (Roche Diagnostics, Mannheim, Germany). For samples that were positive, an amplification curve was obtained at 640 nm and a melting peak at ∼63°C (Fig. 2). Low fluorescence signal was observed for the LightCycler-FastStart DNA MasterPlus Hybridization mix, while sensitivity was affected with the LightCycler® 480 Genotyping Master mix (Fig. 2). Subsequently, the Hybrid II assay was optimized using 2 μl of each of the above mixes and designated as the Hybrid II assay mix. Reaction conditions included in all cases 1 U uracil deoxy-glycosylase (UDG) (Roche Diagnostics, Mannheim, Germany), 0 5 pmol forward (TgF: GGTAATTCCAGCTCCAATAG) and reverse primer (TpR: AAAGTAAACATCCAGACAAAGCG), 0 1 pmol each of the T. parva (LC640) hybridization anchor (5′-GGG TCT CTG CAT GTG GCT TAT–FL) and sensor probe (5′-LCRed640-TCG GAC GGA GTT CGC T—PH) pairs at a final volume of 20 μl. Reaction conditions included an initial UDG activation step at 40°C (10 min), followed by a pre-incubation step at 95°C (10 min). An initial 10 cycles of denaturation (95°C, 10 s), annealing (60°C, 10 s) and extension (72°C, 15 s) were followed by a touch-down procedure from 60–56°C over 15 cycles, followed by 20 cycles at 56°C. Melting curves were obtained using a ramp rate of 0 2°/s from 40–95°C. These conditions were used on both Roche LightCycler® 2.0 and LightCycler® 480 systems. For all assays the gold standard positive (KNP102) and negative (9426) controls used for routine diagnostics were included. KNP102 is a T. parva-positive carrier buffalo that was previously used as gold standard positive control (Sibeko et al. Reference Sibeko, Oosthuizen, Collins, Geysen, Rambritch, Latif, Groeneveld, Potgieter and Coetzer2008). The negative control was born and raised in a herd that has been under quarantined tick-free conditions for several decades.
Effect of real-time PCR mixes on assay sensitivity and robustness using the LightCycler 2.0 and LightCycler 480 instruments. Indicated are the amplification curves and melting profiles obtained using both the LightCycler® FastStart DNA MasterPLUS HybProbe mix (A, D), LightCycler® 480 Genotyping Master mix (B, E), and a 1:1 mixture (Hybrid II) (C, F) on the LightCycler 2.0 and LightCycler 480 instruments, respectively. The Theileria parva gold standard positive control (KNP102) was serially 10-fold diluted. A black arrow indicates the presence of the shoulder peak.

Specificity of Hybrid II assay
Buffalo or cattle samples that tested negative with the hybridization assay for T. parva were analysed by reverse line blot analysis (Gubbels et al. Reference Gubbels, de Vos, van der Weide, Viseras, Schouls, de Vries and Jongejan1999; Pienaar et al. Reference Pienaar, Potgieter, Latif, Thekisoe and Mans2011). This identified samples that possessed 18S template for Babesia bigemina and B. bovis, Theileria annulata, T. sp. (duiker), T. sp. (kudu) and T. sp. (sable). The 18S gene for various Theileria species was also amplified, cloned and sequenced (Mans et al. Reference Mans, Pienaar, Latif and Potgieter2011) and this identified samples with 18S template for T. buffeli-like C, T. buffeli type D-like, T. mutans, T. mutans like-1, T. mutans like-2, T. mutans like-3, T. mutans MSD, T. sp. (bougasvlei), T. sp. (sable-like), T. taurotragi, T. velifera, T. velifera-like A and T. velifera-like B. Cattle samples positive for the Trypanosoma spp. T. vivax, T. congolense Savannah and T. congolense Kilifi were confirmed by cloning and sequencing of the 18S gene (Mamabolo et al. Reference Mamabolo, Ntantiso, Latif and Majiwa2009).
Sensitivity of the Hybrid II assay
A quantified 18S T. parva template obtained from a purified 1100 bp PCR product (10-fold serial dilution) (Pienaar et al. Reference Pienaar, Potgieter, Latif, Thekisoe and Mans2011) was used to determine the analytical sensitivity of both the Hybrid II and hybridization assays using procedures described above. Sensitivity was also determined using the T. parva-positive gold standard control, buffalo KNP102 (Sibeko et al. Reference Sibeko, Oosthuizen, Collins, Geysen, Rambritch, Latif, Groeneveld, Potgieter and Coetzer2008). For this, a 10-fold dilution range was prepared in triplicate using frozen EDTA blood previously collected from KNP102 and negative cattle control EDTA blood before extraction and testing. The parasitaemia of KNP102 was determined previously for this batch of blood (Sibeko et al. Reference Sibeko, Oosthuizen, Collins, Geysen, Rambritch, Latif, Groeneveld, Potgieter and Coetzer2008; Papli et al. Reference Papli, Landt, Fleischer, Koekemoer, Mans, Pienaar, Josemans, Zweygarth, Potgieter and Latif2011). Parasitaemias were calculated for the Hybrid II and hybridization assays using the linear regression curves obtained from the defined 18S template used to assess analytical sensitivity, as previously described (Pienaar et al. Reference Pienaar, Potgieter, Latif, Thekisoe and Mans2011). Crossing-point (CP) values were determined using the automated methodology implemented in the LightCycler software 4.0 for qualitative detection. Percentage efficiency of the PCR reactions were determined from the slopes of the regression lines of the Log [C]/Cp value plots using the formula, Efficiency=100(−1+10(−1/slope)) according to Pfaffl (Reference Pfaffl and Bustin2004).
Supplementary PCR assays for T. parva
PCR assays using primers specific for the p67N, p67C and p104 gene fragments of T. parva were performed as previously described (Pienaar et al. Reference Pienaar, Potgieter, Latif, Thekisoe and Mans2011). To suppress the T. sp. (buffalo) DNA template concentration in selected diagnostic samples, a locked-nucleic acid (LNA) specific for T. sp. (buffalo) was included in the hybridization assay as previously described (Pienaar et al. Reference Pienaar, Potgieter, Latif, Thekisoe and Mans2011).
Simulation of mixed-infections of T. parva and T. sp. (buffalo)
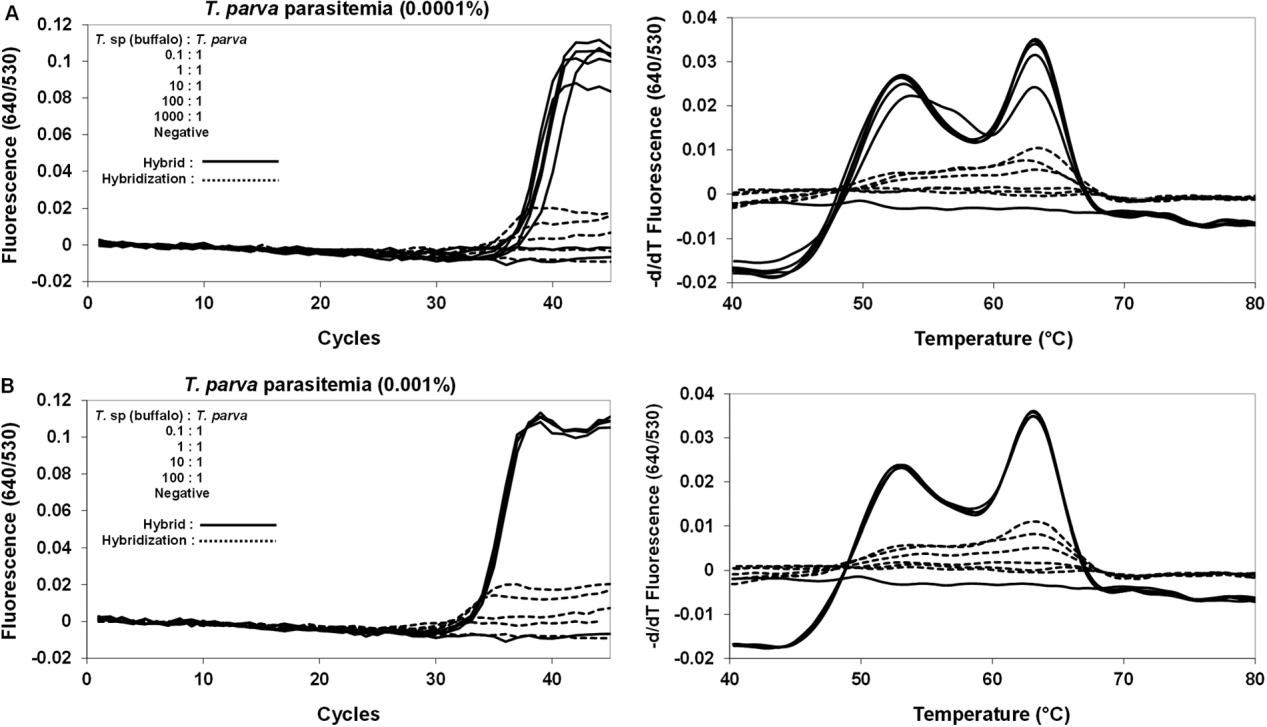
Mixed-infections were simulated as described previously (Pienaar et al. Reference Pienaar, Potgieter, Latif, Thekisoe and Mans2011). Briefly, defined PCR templates for T. parva that correspond to parasitaemias of 0 0001% and 0 001% were mixed with T. sp. (buffalo) template at ratios that ranged from 0 1:1 to 10 000:1. The mixes were then used as templates for Hybrid II assays.
Detection of T. parva variants
Samples previously shown to harbour variant 18S sequences of T. parva (Mans et al. Reference Mans, Pienaar, Latif and Potgieter2011) were tested using the Hybrid II assay.
RESULTS
Comparison of various real-time PCR mixes
The Hybrid II assay combined equal volumes of both the LightCycler® FastStart DNA MasterPLUS HybProbe and LightCycler® 480 Genotyping Master mixes as it was found that this gave more stable amplification curves and melting peaks than the LightCycler® FastStart DNA MasterPLUS HybProbe mix and showed higher sensitivity than the LightCycler® 480 Genotyping Master mix, respectively (Fig. 2). It is less prone to the hook effect and allows for the use of both Roche LightCycler® 2.0 and LightCycler® 480 systems, with comparable results (Fig. 2). The Hybrid II assay therefore describes a hybrid between these two different mixes and instruments. It should be noted that a shoulder peak was observed at ∼52°C (Fig. 2), which was also observed with the previous test (Sibeko et al. Reference Sibeko, Oosthuizen, Collins, Geysen, Rambritch, Latif, Groeneveld, Potgieter and Coetzer2008).
Specificity of the Hybrid II assay
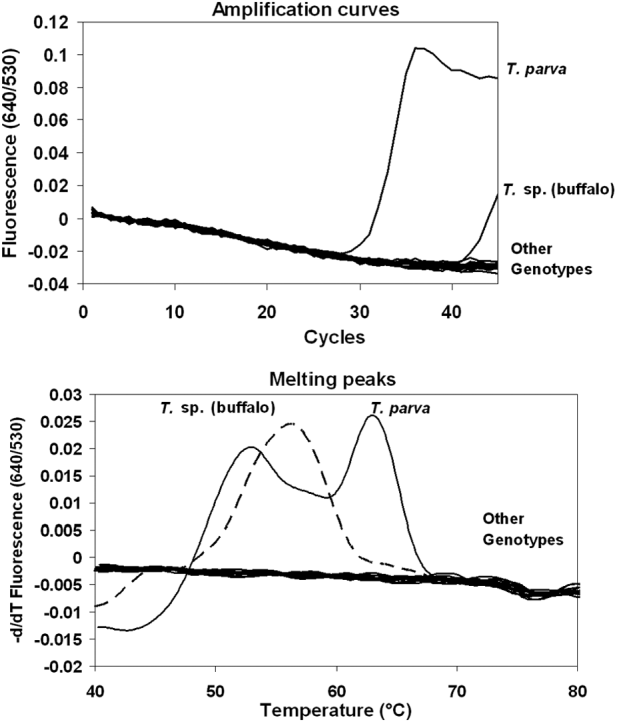
Previously, at least 19 different Theileria genotypes were identified in buffalo and cattle from southern Africa (Mans et al. Reference Mans, Pienaar, Latif and Potgieter2011). Samples that were T. parva negative on the real-time hybridization PCR (Sibeko et al. Reference Sibeko, Oosthuizen, Collins, Geysen, Rambritch, Latif, Groeneveld, Potgieter and Coetzer2008), but positive for the other Theileria genotypes as well as other blood-borne parasites (babesias and trypanosomes) common to buffalo and/or cattle were tested using the Hybrid II assay (Fig. 3). No amplification or melting peaks were observed in any of the samples, except for T. parva and T. sp. (buffalo) (Fig. 3). Optimization of the PCR conditions using a touch-down protocol resulted in CP values consistently higher than 40 cycles observed for T. sp. (buffalo)-positive samples. These samples also showed distinct melting peaks (57°C) that differ distinctly from that observed for T. parva (Fig. 3B) and can as such be readily distinguished.
Specificity of the Hybrid II assay for various blood-borne parasites found in African buffalo and/or cattle. Amplification curves and melting peaks are indicated for Theileria parva, T. sp. (buffalo) and other genotypes that includes the Theileria species: T. annulata, T. buffeli-like C, T. buffeli type D-like, T. mutans, T. mutans like-1, T. mutans like-2, T. mutans like-3, T. mutans MSD, T. sp. (bougasvlei), T. sp. (duiker), T. sp. (kudu), T. sp. (sable), T. sp. (sable-like), T. taurotragi, T. velifera, T. velifera-like A, T. velifera-like B, as well as the Babesia species: B. bigemina and B. bovis and the Trypanosoma species: T. vivax, T. congolense Savannah and T. congolense Kilifi.

Sensitivity of the Hybrid II assay
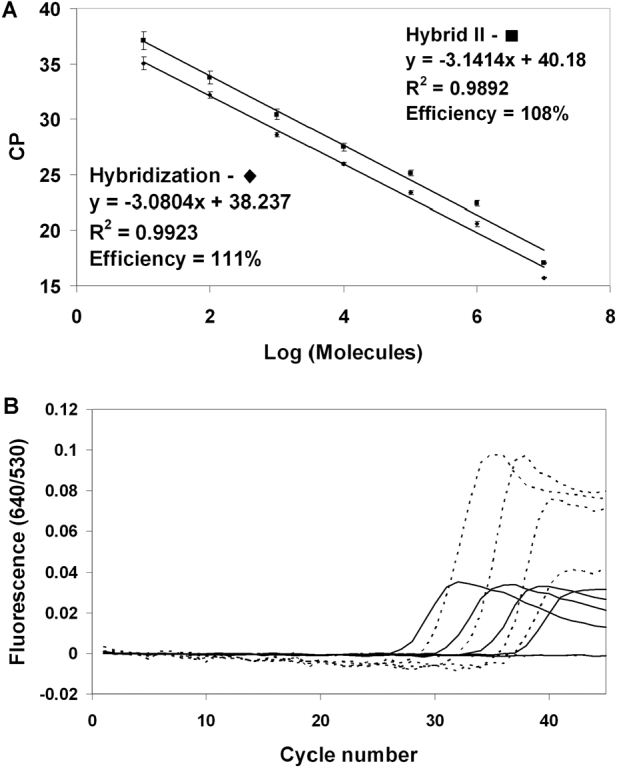
Using a defined template obtained from a quantified PCR product for T. parva (Pienaar et al. Reference Pienaar, Potgieter, Latif, Thekisoe and Mans2011), it could be shown that the Hybrid II assay can detect up to 10 copies of T. parva (Fig. 4A). The efficiencies of both real-time hybridization and Hybrid II assays were comparable (108–111%). Using the gold standard control blood sample (buffalo KNP102) the Hybrid II detects a 10-fold serial dilution range to the same extent (up to 2×10⁻⁶% parasitaemia), as the current hybridization test (Fig. 4B). Given this sensitivity range, a cut-off CP value for positive samples was determined below 37 cycles. Crossing-point values higher than this should be considered false-positives, or should be investigated in more detail to confirm their T. parva-positive status. This cut-off value also readily allows T. sp. (buffalo)-positive samples to be identified.
Analytical sensitivity of the Hybrid II assay. (A) Comparison of the hybridization Hybrid II assays using a Theileria parva template at defined concentrations related to the number of molecules. Values given are in triplicate with standard deviation indicated by error bars. Linear regression lines were fitted through the points and the correlation is indicated. (B) A 10-fold serial dilution series of the gold standard buffalo KNP102 (parasitaemia ∼2E−3%−2E−7%) was analysed by the hybridization assay (solid lines) and the Hybrid II assay (dotted line).

Correlation of hybridization and Hybrid II assays for T. parva-positive and negative samples
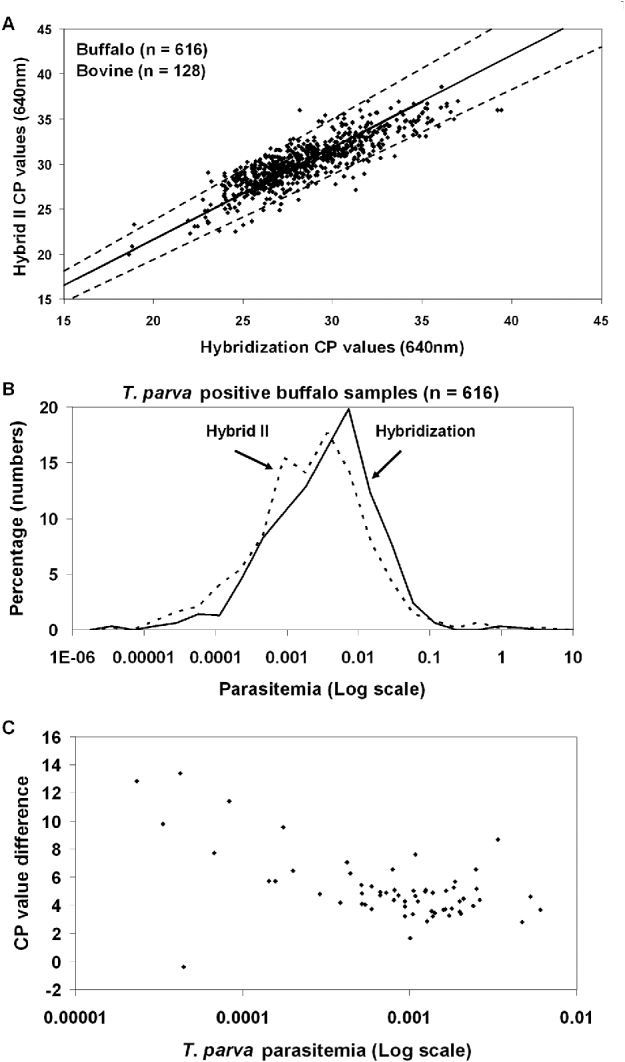
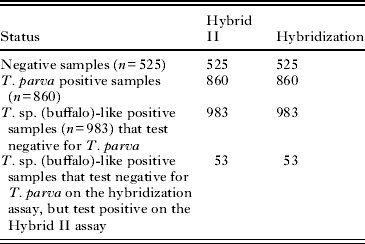
All samples that tested negative using the hybridization assay were negative on the Hybrid II assay, while 100% correlation was found for T. parva-positive samples (Table 1). A linear correlation was found when CP values for 860 T. parva-positive samples obtained with the two tests were compared (Fig. 5A). The majority (>95%) were found within 10% error deviation from the expected norm (Fig. 5A). Parasitaemia ranges calculated for the buffalo samples ranged from 0 1–0 00001% and the frequency distributions were similar for both hybridization and Hybrid II assays (Fig. 5B).
Comparison between the Hybrid II and the hybridization assay. (A) CP values from 860 T. parva-positive samples are shown. Indicated is a linear regression line obtained for data from a defined PCR template for the Hybrid II and hybridization assay (Fig. 4) (solid line) as well as 10% error deviation from this line (dotted lines). (B) Parasitaemias calculated for T. parva-positive buffalo samples. Parasitaemia was calculated from CP values obtained from the hybridization or Hybrid II assays using standard curves as previously described (Pienaar et al. Reference Pienaar, Potgieter, Latif, Thekisoe and Mans2011). The number of samples for each sample type analysed is indicated and the percentage of the total number was determined by grouping parasitaemias in 2-fold decreasing bins. The vertical line indicates the parasitaemia at the cut-off point (CP value∼37). (C) The difference between CP values obtained with the Hybrid II (640 nm) and the hybridization assay (705 nm) are indicated for samples considered to be T. parva negative with the hybridization test. This is plotted against estimated T. parva parasitaemia values obtained from the Hybrid II assay.

Comparison of the Hybrid II assay and the hybridization assays

Effect of mixed-infections on T. parva detection
Samples that were T. sp. (buffalo)-like positive (n=983) in the hybridization assay, tested negative with the Hybrid II assay (Table 1). However, 53 samples (∼5%) considered to be T. parva negative on the hybridization assay, tested positive with the Hybrid II assay. The CP values for these samples fell well within the detection range of the Hybrid II assay with a mean of 30 5±2 8. This corresponds to estimated parasitaemia values of 0 00002–0 02%, which falls within the parasitaemia ranges (0 0001–0 001) previously shown to be liable to T. sp. (buffalo) suppression (Pienaar et al. Reference Pienaar, Potgieter, Latif, Thekisoe and Mans2011). The majority of the CP values obtained for these samples on the hybridization assay at 705 nm are lower compared to that of the Hybrid II assay, indicating that the T. sp. (buffalo)-like parasitaemias are higher in these samples compared to that of T. parva (Fig. 5C).
The 53 samples that tested negative on the hybridization assay, but positive on the hybrid II assay were further analysed by PCR using primers specific for different protein genes (p67N, p67C and p104) (Pienaar et al. Reference Pienaar, Potgieter, Latif, Thekisoe and Mans2011). All 53 samples tested positive for T. parva using these genes (results not shown). In addition, when the T. sp. (buffalo) template concentration was suppressed by the presence of a locked nucleic acid (LNA) specific for T. sp. (buffalo) (Pienaar et al. Reference Pienaar, Potgieter, Latif, Thekisoe and Mans2011), all tested positive in the hybridization assay (results not shown).
In order to confirm that the presence of T. sp. (buffalo) template does not affect the sensitivity of the Hybrid II assay, templates with defined ratios of T. sp. (buffalo): T. parva were used to simulate mixed infection parasitaemias previously shown to affect the hybridization assay (Pienaar et al. Reference Pienaar, Potgieter, Latif, Thekisoe and Mans2011). No suppression was observed for the Hybrid II assay at ratios of T. sp. (buffalo): T. parva up to 1000:1 at T. parva parasitaemia of 0 0001% (Fig. 6).
The effect of mixed infections on the Hybrid II assay. DNA template that corresponds to Theileria parva parasitaemia of (A) 0 0001% and (B) 0 001% were mixed with T. sp. (buffalo) DNA template at indicated ratios. Amplification curves and melting profiles are indicated for both Hybrid II and hybridization assays.

Detection of T. parva variants
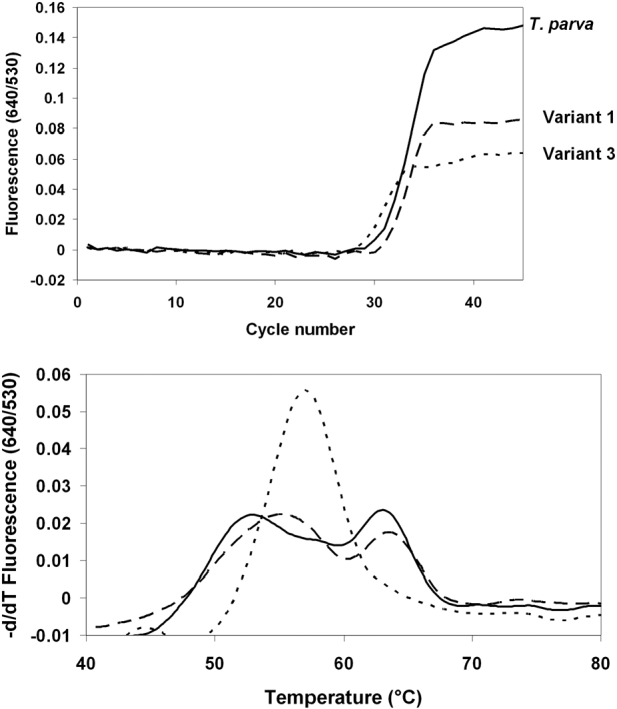
Previously, a number of T. parva variant sequences were detected in buffalo and cattle samples (Fig. 1) (Mans et al. Reference Mans, Pienaar, Latif and Potgieter2011). The most prominent of these were variant 1 and variant 3 for which samples were identified that possessed these variants exclusively (Mans et al. Reference Mans, Pienaar, Latif and Potgieter2011). The Hybrid II assay detected these variants readily (Fig. 7). All samples in which variants were previously found (Mans et al. Reference Mans, Pienaar, Latif and Potgieter2011), tested positive for T. parva and the Hybrid II also detected cloned products (results not shown). T. sp. (buffalo) variants described (Mans et al. Reference Mans, Pienaar, Latif and Potgieter2011) did not give any signal (results not shown).
Detection of Theileria parva variants. Indicated are amplification curves and melting peaks for field samples that were positive for the T. parva variant 1 and variant 3 genotypes.

DISCUSSION
The accurate diagnosis of the carrier state of infectious agents in reservoir hosts is important to determine parasite prevalence within a host population. Theileria infections can be maintained for extended periods or even life long, during which time parasitaemia can fluctuate significantly (Norval et al. Reference Norval, Perry and Young1992). The presence of multiple Theileria species is known to interfere with the accurate diagnosis of T. parva, using serological as well as nucleic acid-based methods (Stoltsz, Reference Stoltsz1989; Pienaar et al. Reference Pienaar, Potgieter, Latif, Thekisoe and Mans2011). The current study describes the development of the Hybrid II assay, a sensitive real-time hybridization PCR test, for the detection of T. parva in carrier buffalo, which is not affected by mixed infections of T. parva and T. sp. (buffalo)-like parasites.
The Hybrid II assay combines reagent mixes used on the Roche LightCycler® 2.0 and LightCycler® 480 systems in order to obtain a mix that can be used on both instruments. This mix is more robust in regard to sensitivity, in analytical as well as qualitative terms than the individual mixes alone. The LightCycler® FastStart mix gives lower fluorescence signals for the melting peaks and are more prone to the hook effect compared to the Hybrid II mix. The hook effect occurs due to competition of re-annealing PCR product strands and the fluorescent probe that binds to them, leading to the illusion of decreasing product concentration in the plateau phase of the real-time PCR reaction. This can severely affect the signal obtained for the melting peak (Barratt and MacKay, Reference Barratt and Mackay2002). A comparison of the real-time hybridization and Hybrid II assays shows that the Hybrid II mix was less prone towards the hook effect. During routine diagnostics using the hybridization assay it has been observed that the hook effect could severely suppress melting peak signals and could potentially lead to a false-negative diagnosis when melting peak analysis was used as criteria (personal observation). The Hybrid II mix could thus improve assays for both the LightCycler® 2.0 and LightCycler® 480 systems.
The shoulder peak observed for both the real-time hybridization and hybrid II assays is of interest. Sibeko et al. (Reference Sibeko, Oosthuizen, Collins, Geysen, Rambritch, Latif, Groeneveld, Potgieter and Coetzer2008) postulated that it might be caused due to back-folding of the amplicon that competes with the binding of the probes. A more likely explanation, however, is that the calculated melting temperatures of the anchor (61°C) and sensor probes (53°C) differ, which gives rise to the shoulder peak, when a proportion of the sensor probe melts before the anchor probe. This is supported by the shift in the shoulder peak Tm observed for the T. parva sensor probe variants (Mans et al. Reference Mans, Pienaar, Latif and Potgieter2011).
A number of blood-borne parasites are found in buffalo and/or cattle in southern Africa. These include Babesia, Theileria and Trypanosoma (de Vos and Potgieter, Reference De Vos and Potgieter1983; Allsopp et al. Reference Allsopp, Theron, Coetzee, Dunsterville and Allsopp1999; Mamabolo et al. Reference Mamabolo, Ntantiso, Latif and Majiwa2009). The Hybrid II assay was specific for T. parva and did not detect representative samples from a variety of blood-borne parasites. The DNA templates for these parasites were all detectable by various forms of PCR and were, as such, considered to be present at levels that should be detectable by the Hybrid II assay. Theileria sp. (buffalo)-positive samples did amplify after 40 cycles; however, it was determined that neither does this adversely affect the Hybrid II assay with regard to suppression of T. parva signal in the case of mixed infections, nor was it a source of false-positives (as in the case of the real-time hybridization PCR) due to the differences observed in melting peaks. Amplification of T. sp. (buffalo) is presumably due to mis-priming of the reverse primer. In the case of T. parva variants, any sample that shows CP values below the determined cut-off point (37 cycles) with aberrant melting peaks should be considered to be T. parva positive. It should be noted that for the current data set, less than 1% of all samples showed such variant profiles (personal observation). This was also observed with the real-time hybridization assay (Mans et al. Reference Mans, Pienaar, Latif and Potgieter2011). It is therefore not expected that variants will have a considerable effect on the diagnosis of T. parva using the Hybrid II assay. In cases where variant samples are identified, additional tests or cloning and sequencing can be performed to confirm T. parva status (Pienaar et al. Reference Pienaar, Potgieter, Latif, Thekisoe and Mans2011).
The sensitivity of the Hybrid II assay was comparable to the hybridization PCR test (Sibeko et al. Reference Sibeko, Oosthuizen, Collins, Geysen, Rambritch, Latif, Groeneveld, Potgieter and Coetzer2008). Despite the Hybrid II assay being approximately 2-fold less sensitive than the latter test (CP values ∼1–2 cycles higher), it was still within the dynamic range of the starting template tested (1–10 000 000 copies), performs as well and have the same detection limit as the hybridization PCR test. Its efficiency also falls into well accepted ranges (90–110%) for real-time PCR (Pfaffl, Reference Pfaffl and Bustin2004). T. parva parasitaemia ranges have been determined for Cape buffalo and were shown to range from 0 0001–0 1% for the majority (>98%) of samples (Pienaar et al. Reference Pienaar, Potgieter, Latif, Thekisoe and Mans2011). The current study confirmed this using the Hybrid II assay and showed that frequency distribution profiles for T. parva parasitaemia obtained for the Hybrid II and hybridization assays approximate normal distribution curves. This suggests that the parasitaemias calculated represent actual parasitaemia ranges found in buffalo. As such, the Hybrid II assay will also be useful to estimate parasitaemia levels in infected carrier animals. The frequency distribution profiles indicate that a low number of infected buffalo (<1%) could potentially be missed using either the Hybrid II or the hybridization assay due to low parasitaemias. The use of a nested PCR, that is potentially more sensitive, was recently described for the p104 gene (Odongo et al. Reference Odongo, Sunter, Kiara, Skilton and Bishop2010). However, from the perspective of high-throughput routine diagnostics, nested PCR approaches are more time consuming and, as such, not practical. Other nucleic acid-based assays that have been developed for the diagnosis of T. parva include the RLB assay (Gubbels et al. Reference Gubbels, de Vos, van der Weide, Viseras, Schouls, de Vries and Jongejan1999), a Taqman hydrolysis probe assay based on the 18S gene (Papli et al. Reference Papli, Landt, Fleischer, Koekemoer, Mans, Pienaar, Josemans, Zweygarth, Potgieter and Latif2011) and LAMP assays based on the PIM and S5 ribosomal (annotated as the P150 gene) genes (Thekisoe et al. Reference Thekisoe, Rambritch, Nakao, Bazie, Mbati, Namangala, Malele, Skilton, Jongejan, Sugimoto, Kawazu and Inoue2010). The Taqman and RLB assays, respectively, use universal Theileria and Theileria/Babesia primer sets. These assays may therefore have similar PCR suppression problems to that of the current hybridization PCR assay (Pienaar et al. Reference Pienaar, Potgieter, Latif, Thekisoe and Mans2011).
It was previously shown that suppression of PCR signal can occur when mixed infections of T. parva and T. sp. (buffalo)-like parasites are encountered (Pienaar et al. Reference Pienaar, Potgieter, Latif, Thekisoe and Mans2011). At low parasitaemia levels (0 0001%) this can happen at ratios of T. sp. (buffalo): T. parva as low as 10:1, while suppression at parasitaemia levels of 0 001% were observed at ratios as low as 100:1 (Pienaar et al. Reference Pienaar, Potgieter, Latif, Thekisoe and Mans2011). The estimated T. parva parasitaemias of the 53 samples that were not detected by the hybridization assay in the current study mostly fall within this range, while the T. sp. (buffalo)-like parasitaemia is estimated to be at least 100 to1000-fold higher. The fact that these samples tested positive in the presence of an LNA that suppresses the DNA template concentration of T. sp. (buffalo), suggests that suppression of the PCR signal occurred in the hybridization assay. In contrast, not only did the Hybrid II assay detect these samples, but no suppression of signal occurred in mixed infection simulations of T. sp. (buffalo) and T. parva at ratios of 1000:1 at low T. parva (0 0001%) parasitaemia levels. The Hybrid II assay therefore has the advantage, compared to the hybridization assay, that the presence of T. sp. (buffalo) will not affect the sensitivity of the test.
We found the Hybrid II assay to be an improvement on the current official real-time hybridization assay due to its robustness in the case of mixed infections of T. sp. (buffalo)-like parasites and T. parva. It was indicated that T. parva infection might be missed in ∼10% of all mixed infections that occur in free-ranging buffalo (Pienaar et al. Reference Pienaar, Potgieter, Latif, Thekisoe and Mans2011). With regard to the diagnostic samples, this currently constitutes less than 0 5% of all samples and is not a problem of immediate concern (Pienaar et al. Reference Pienaar, Potgieter, Latif, Thekisoe and Mans2011). As indicated, the number of T. sp. (buffalo)-like positive buffalo could increase in the future and have a more significant impact on diagnostics if T. parva is introduced into such herds (Pienaar et al. Reference Pienaar, Potgieter, Latif, Thekisoe and Mans2011). Use of the Hybrid II assay will prevent this problem from occurring and presents a major advance in our ability to detect T. parva in Cape buffalo. This should improve the risk management of Corridor disease by the veterinary authorities.
ACKNOWLEDGEMENTS
This project was funded by OVI project numbers 15/08/1P01 and OV21/03/C148 (Department of Agriculture, Forestry and Fisheries contract). We thank Mr John Ratabane for assistance in the extraction of numerous diagnostic samples.