1 Introduction
It is well acknowledged that a bifurcation can lead to symmetry breaking. Two typical examples are Hopf bifurcation (see e.g. Moiola & Chen Reference Moiola and Chen1996) and Bénard convection (see e.g. Getling Reference Getling1999) in physics. The temporal symmetry is destroyed in a Hopf bifurcation and so is the spatial symmetry in Bénard convection. Symmetry breaking plays a major role in pattern formation and it can be found in many scientific disciplines such as biology, chemistry and physics. On the theoretical side, there is an extensive literature on the analysis of bifurcation and symmetry breaking by using the group-representation theory, e.g. Sattinger (Reference Sattinger1980).
The problem of solving the full Euler equations for travelling waves on the surface of water flows has been widely studied by many authors both analytically and numerically, however in most works certain symmetry conditions were imposed. The term ‘symmetric waves’ is applied to those waves whose shape is symmetric about the vertical axis. If a wave is symmetric about a vertical line other than the vertical axis, we call this wave a shifted symmetric wave. Apart from these two kinds of waves, the others are named non-symmetric waves. Non-symmetric water waves receive considerable attention not only because symmetry breaking is of scientific interest as mentioned in the first paragraph but also because it is a big mathematical challenge to find new types of fully nonlinear solutions in surface water-wave problems.
For nonlinear capillary waves, Crapper (Reference Crapper1957) derived exact symmetric periodic solutions of explicit form in terms of elementary functions on water of infinite depth. The wave profile becomes steep as the amplitude increases prior to reaching a limiting configuration with a trapped bubble at the trough. Beyond that, the profile has a non-physical self-intersecting structure. Vanden-Broeck & Keller (Reference Vanden-Broeck and Keller1980) extended the family of Crapper’s solutions beyond the limiting configuration by considering the pressure inside the trapped bubble as part of solutions. Vanden-Broeck (Reference Vanden-Broeck1996) worked on capillary waves with variable surface tension and found new solutions by using a collocation method. Okamoto & Shōji (Reference Okamoto and Shōji1991) proved the non-existence of non-symmetric bifurcations from the family in Crapper (Reference Crapper1957). This fact implies that non-symmetric capillary waves are very unlikely since there are no solutions found other than Crapper’s. Kinnersley (Reference Kinnersley1976) generalised Crapper’s solutions to the case of capillary waves on fluid sheets of finite thickness. Crowdy (Reference Crowdy1999) presented a simple derivation for Kinnersley’s solutions by using complex variables. Blyth & Vanden-Broeck (Reference Blyth and Vanden-Broeck2004) found numerically new solutions which have no horizontal symmetry or anti-symmetry from Kinnersley’s solutions. However these waves are still symmetric in a sense of ‘symmetric waves’ defined earlier. Whether or not non-symmetric capillary waves on fluid sheets exist remains an open question.
For pure gravity waves, the problem was studied widely in the case of finite and infinite depth since the pioneering work of Stokes (Reference Stokes1847). For classic gravity solitary waves, a rigorous proof was carried out by Craig & Sternberg (Reference Craig and Sternberg1988) to show that they can only exist in symmetric form. The research on non-symmetric periodic waves could be tracked back to 1980 when Chen & Saffman (Reference Chen and Saffman1980) found bifurcations to new families of solutions in deep water. They tried to compute non-symmetric gravity waves but only shifted symmetric waves were found. Zufiria (Reference Zufiria1987a ) derived a weakly nonlinear Hamiltonian model to find non-symmetric waves with six peaks via a spontaneous symmetry-breaking bifurcation. Later (Zufiria Reference Zufiria1987b ) used numerical approaches to compute non-symmetric waves on water of infinite depth in the full Euler equations. Qualitatively similar results with six peaks in one wavelength were produced, but no other solutions were found. It remains unclear whether there exist non-symmetric progressive gravity waves with peak number other than six in one wavelength.
In the presence of both gravity and surface tension, there is a very rich structure of solutions for water waves. Wilton (Reference Wilton1915) showed the non-uniqueness of solutions, even for waves at small amplitude, which are the so-called Wilton’s ripples. The reader is referred to Vanden-Broeck (Reference Vanden-Broeck2010) for a quick review. Zufiria (Reference Zufiria1987c ) used again a weakly nonlinear Hamiltonian model to rediscover non-symmetric periodic gravity–capillary waves with six peaks in the case of finite depth. In addition, he computed approximate non-symmetric solitary waves. Later, new non-symmetric periodic waves with two peaks were discovered numerically by Shimizu & Shōji (Reference Shimizu and Shōji2012). All the literature mentioned on non-symmetric waves were carried out by investigating spontaneous symmetry-breaking bifurcations. Wang, Vanden-Broeck and Milewski (Reference Wang, Vanden-Broeck and Milewski2014) worked on non-symmetric solitary waves with a quite different approach. They began with constructing a special initial guess for Newton’s method and obtained a convergent solution, then the bifurcation diagram was completed based on a numerical continuation method. They found that all the non-symmetric solitary waves finally join the branches of symmetric ones. Despite of a very different method, their results end up with another example of spontaneous symmetry-breaking bifurcations.
In the present paper, we aim to discover new non-symmetric periodic gravity–capillary waves numerically. The problem is formulated in § 2. We state the numerical scheme in § 3 based on a collocation technique which was originally used by Vanden-Broeck (Reference Vanden-Broeck1996). The numerical solutions and the global bifurcation diagrams are presented in full detail in § 4. The concluding remarks are given in § 5.
2 Formulation
We consider a two-dimensional irrotational flow of an inviscid and incompressible fluid of finite depth
 $h$
with gravity and surface tension both present. The free surface (i.e. the upper surface of the fluid) is deformed by a train of waves travelling at a constant velocity
 $c$
.
We introduce a two-dimensional Cartesian system with the
 $y$
-axis pointing upwards. A frame of reference moving with the waves is chosen so that the flow is steady, namely, we introduce a mean flow of speed
 $c$
to arrest the wave. We denote by
 $y=\unicode[STIX]{x1D702}(x)$
the equation of the (unknown) free surface. The acceleration of gravity
 $g$
acts in the negative
 $y$
-direction. We introduce a potential function
 $\unicode[STIX]{x1D719}$
so that the velocity is defined by
 $(\unicode[STIX]{x1D719}_{x},\unicode[STIX]{x1D719}_{y})$
, therefore the governing equations are as follows
 $$\begin{eqnarray}\displaystyle & \displaystyle \unicode[STIX]{x1D6FB}^{2}\unicode[STIX]{x1D719}=0,\quad -h<y<\unicode[STIX]{x1D702}(x), & \displaystyle\end{eqnarray}$$
 $$\begin{eqnarray}\displaystyle & \displaystyle \unicode[STIX]{x1D719}_{y}=\unicode[STIX]{x1D719}_{x}\unicode[STIX]{x1D702}_{x},\quad \text{on}~y=\unicode[STIX]{x1D702}(x), & \displaystyle\end{eqnarray}$$
 $$\begin{eqnarray}\displaystyle & \displaystyle P_{a}-P=T\unicode[STIX]{x1D705},\quad \text{on}~y=\unicode[STIX]{x1D702}(x), & \displaystyle\end{eqnarray}$$
 $$\begin{eqnarray}\displaystyle & \displaystyle \unicode[STIX]{x1D719}_{y}=0,\quad \text{on}~y=-h, & \displaystyle\end{eqnarray}$$
where
 $P$
is the fluid pressure,
 $P_{a}$
is the atmospheric pressure,
 $T$
is the surface tension and
 $\unicode[STIX]{x1D705}$
is the curvature of the free surface. Equations (2.2) and (2.4) are the kinematic boundary conditions on the free surface and on the bottom respectively. Equation (2.3) expresses the normal stress balance at the free surface. Applying Bernoulli’s equation to (2.3) yields the dynamic boundary condition
 $$\begin{eqnarray}\displaystyle \frac{1}{2}|\unicode[STIX]{x1D6FB}\unicode[STIX]{x1D719}|^{2}+gy-\frac{T}{\unicode[STIX]{x1D70C}}\unicode[STIX]{x1D705}=B, & & \displaystyle\end{eqnarray}$$
where
 $g$
is the gravitational acceleration,
 $\unicode[STIX]{x1D70C}$
is the fluid density and
 $B$
is called the Bernoulli constant. It is not difficult to obtain the linear dispersion relation for gravity–capillary waves, namely,
 $$\begin{eqnarray}c^{2}=\left(\frac{g}{k}+\frac{T}{\unicode[STIX]{x1D70C}}k\right)\tanh (kh),\end{eqnarray}$$
where
 $k$
is the wavenumber. For the fluid of infinite depth, the dispersion relation (2.6) reduces to
 $$\begin{eqnarray}c^{2}=\frac{g}{k}+\frac{T}{\unicode[STIX]{x1D70C}}k.\end{eqnarray}$$
It follows immediately that
 $c$
in (2.7) admits a global minimum
 $c^{\ast }$
given by
 $$\begin{eqnarray}c^{\ast }=\left(\frac{4Tg}{\unicode[STIX]{x1D70C}}\right)^{1/4}.\end{eqnarray}$$
This implies that linear periodic gravity–capillary waves can only exist for
 $c>c^{\ast }$
, but as shown in Vanden-Broeck & Dias (Reference Vanden-Broeck and Dias1992), solitary waves bifurcate from
 $c^{\ast }$
and exist at subcritical speeds.
In this paper, we focus on periodic waves with wavelength
 $\unicode[STIX]{x1D706}$
. By choosing
 $c$
and
 $\unicode[STIX]{x1D706}/2\unicode[STIX]{x03C0}$
as the reference velocity and length respectively, one can rewrite the dynamic boundary condition (2.5) as
 $$\begin{eqnarray}{\textstyle \frac{1}{2}}|\unicode[STIX]{x1D6FB}\unicode[STIX]{x1D719}|^{2}+py-q\unicode[STIX]{x1D705}=B,\end{eqnarray}$$
where the parameters
 $p$
and
 $q$
are defined as
 $$\begin{eqnarray}p=\frac{g\unicode[STIX]{x1D706}}{2\unicode[STIX]{x03C0}c^{2}},\quad q=\frac{2\unicode[STIX]{x03C0}T}{\unicode[STIX]{x1D70C}\unicode[STIX]{x1D706}c^{2}}.\end{eqnarray}$$
In addition, we should impose the periodic boundary condition
 $\unicode[STIX]{x1D702}(x+2\unicode[STIX]{x03C0})=\unicode[STIX]{x1D702}(x)$
, which completes the whole system.
We introduce the streamfunction
 $\unicode[STIX]{x1D713}$
and denotes the complex potential by
 $f=\unicode[STIX]{x1D719}+\text{i}\unicode[STIX]{x1D713}$
. We choose
 $\unicode[STIX]{x1D713}=0$
on the free surface and
 $\unicode[STIX]{x1D719}=0$
at
 $x=y=0$
(which is assumed to be a crest or a trough). We denote by
 $-Q$
the value of
 $\unicode[STIX]{x1D713}$
on the bottom. We use
 $(\unicode[STIX]{x1D719},\unicode[STIX]{x1D713})$
as the independent variables and denotes the complex velocity by
 $u-\text{i}v$
. We then introduce
 ${\mathcal{T}}-\text{i}\unicode[STIX]{x1D717}$
, which is an analytic function of
 $\unicode[STIX]{x1D719}+\text{i}\unicode[STIX]{x1D713}$
, as the following
 $$\begin{eqnarray}u-\text{i}v=\text{e}^{{\mathcal{T}}-\text{i}\unicode[STIX]{x1D717}}.\end{eqnarray}$$
On the free surface, we define
 $\unicode[STIX]{x1D70F}(\unicode[STIX]{x1D719})\triangleq {\mathcal{T}}(\unicode[STIX]{x1D719},0)$
and
 $\unicode[STIX]{x1D703}(\unicode[STIX]{x1D719})\triangleq \unicode[STIX]{x1D717}(\unicode[STIX]{x1D719},0)$
. It immediately follows that
 $$\begin{eqnarray}x_{\unicode[STIX]{x1D719}}+\text{i}y_{\unicode[STIX]{x1D719}}=\text{e}^{-\unicode[STIX]{x1D70F}+\text{i}\unicode[STIX]{x1D703}},\end{eqnarray}$$
whose real part and imaginary part can be used to calculate
 $x$
and
 $y$
respectively by integrating with respect to
 $\unicode[STIX]{x1D719}$
. We substitute (2.11) and (2.12) into (2.9) and differentiate the result with respect to
 $\unicode[STIX]{x1D719}$
to get
 $$\begin{eqnarray}\text{e}^{2\unicode[STIX]{x1D70F}}\unicode[STIX]{x1D70F}_{\unicode[STIX]{x1D719}}+p\text{e}^{-\unicode[STIX]{x1D70F}}\sin \unicode[STIX]{x1D703}-q\frac{\text{d}}{\text{d}\unicode[STIX]{x1D719}}(\text{e}^{\unicode[STIX]{x1D70F}}\unicode[STIX]{x1D703}_{\unicode[STIX]{x1D719}})=0,\end{eqnarray}$$
where we have used
 $\unicode[STIX]{x1D705}=\text{e}^{\unicode[STIX]{x1D70F}}\unicode[STIX]{x1D703}_{\unicode[STIX]{x1D719}}$
. An equivalent formulation was used in Shimizu & Shōji (Reference Shimizu and Shōji2012). In the next section, a numerical method based on collocation and truncating series will be introduced to solve the fully nonlinear steady Euler equations (2.13).
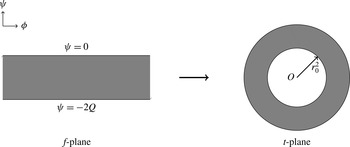
The conformal mapping (3.1) maps the strip
 $-2Q<\unicode[STIX]{x1D713}<0$
onto an annulus
 $r_{0}^{2}<|t|<1$
whose outer boundary corresponds to the free surface in the physical plane and inner boundary to the image of the free surface into the bottom.

3 Numerical scheme
The flow domain in the complex potential plane is the strip
 $-Q<\unicode[STIX]{x1D713}<0$
. The kinematic boundary condition (2.4) at the bottom can be satisfied by using the method of images. We have
 $\unicode[STIX]{x1D713}=-2Q$
on the image of the free surface into the bottom, hence the extended flow domain is the strip
 $-2Q<\unicode[STIX]{x1D713}<0$
. Then we perform the conformal mapping
 $$\begin{eqnarray}t=\text{e}^{-\text{i}f},\end{eqnarray}$$
where
 $f=\unicode[STIX]{x1D719}+\text{i}\unicode[STIX]{x1D713}$
is the complex potential. It maps the strip onto the annulus
 $r_{0}^{2}<|t|<1$
(see figure 1), where
 $$\begin{eqnarray}r_{0}=\text{e}^{-Q}.\end{eqnarray}$$
It is clear that
 $w$
is an analytic function of
 $f$
, and so is
 $\unicode[STIX]{x1D70F}-\text{i}\unicode[STIX]{x1D703}$
. Therefore
 $\unicode[STIX]{x1D70F}-\text{i}\unicode[STIX]{x1D703}$
is an analytic function of
 $t$
which can be expressed by the Laurent series
 $$\begin{eqnarray}\unicode[STIX]{x1D70F}-\text{i}\unicode[STIX]{x1D703}=\unicode[STIX]{x1D6FC}_{0}+\mathop{\sum }_{n=1}^{\infty }\unicode[STIX]{x1D6FC}_{n}t^{n}+\mathop{\sum }_{n=1}^{\infty }\unicode[STIX]{x1D6FD}_{n}t^{-n},\end{eqnarray}$$
where the coefficients
 $\unicode[STIX]{x1D6FC}_{n}$
,
 $\unicode[STIX]{x1D6FD}_{n}\in \mathbb{C}$
except
 $\unicode[STIX]{x1D6FC}_{0}\in \mathbb{R}$
. Hence we write
 $$\begin{eqnarray}\unicode[STIX]{x1D6FC}_{n}=-a_{n}+\text{i}b_{n},\end{eqnarray}$$
with
 $a_{n}$
,
 $b_{n}\in \mathbb{R}$
for all
 $n\geqslant 1$
. In particular, the coefficients
 $b_{n}$
are all zero for symmetric waves. The minus sign in front of
 $a_{n}$
on the right-hand side of equation (3.4) is chosen so that the definitions of
 $a_{n}$
and
 $b_{n}$
are in accordance with those presented in Shimizu & Shōji (Reference Shimizu and Shōji2012). Since
 $\unicode[STIX]{x1D713}=-2Q$
is the image of the surface
 $\unicode[STIX]{x1D713}=0$
, we obtain
 $$\begin{eqnarray}\unicode[STIX]{x1D70F}(\unicode[STIX]{x1D719},0)-\text{i}\unicode[STIX]{x1D703}(\unicode[STIX]{x1D719},0)=\unicode[STIX]{x1D70F}(\unicode[STIX]{x1D719},-2Q)+\text{i}\unicode[STIX]{x1D703}(\unicode[STIX]{x1D719},-2Q).\end{eqnarray}$$
Combining (3.3) and (3.5) gives
 $$\begin{eqnarray}\unicode[STIX]{x1D6FD}_{n}=\unicode[STIX]{x1D6FC}_{n}r_{0}^{2n},\quad \text{for}~n\geqslant 1.\end{eqnarray}$$
By substituting (3.4) into (3.3) and truncating after
 $N$
terms, we obtain
 $$\begin{eqnarray}\displaystyle & \displaystyle \unicode[STIX]{x1D70F}=\unicode[STIX]{x1D6FC}_{0}-\mathop{\sum }_{n=1}^{N}a_{n}(1+r_{0}^{2n})\cos n\unicode[STIX]{x1D719}+b_{n}(1-r_{0}^{2n})\sin n\unicode[STIX]{x1D719}, & \displaystyle\end{eqnarray}$$
 $$\begin{eqnarray}\displaystyle & \displaystyle \unicode[STIX]{x1D703}=\mathop{\sum }_{n=1}^{N}-a_{n}(1-r_{0}^{2n})\sin n\unicode[STIX]{x1D719}-b_{n}(1+r_{0}^{2n})\cos n\unicode[STIX]{x1D719}. & \displaystyle\end{eqnarray}$$
When the fluid is of infinite depth (i.e.
 $h\rightarrow \infty$
), the strip in figure 1 becomes the lower half-
 $f$
-plane and the annulus extends to a unit disc, i.e.
 $r_{0}=0$
. The Laurent series (3.3) becomes a Taylor series since all the coefficients
 $\unicode[STIX]{x1D6FD}_{n}$
vanish. The coefficient
 $\unicode[STIX]{x1D6FC}_{0}$
is also zero because the velocity at infinite depth equals the phase speed whose value is 1 under the current scaling.
Since the symmetry-breaking phenomenon occurs as a bifurcation from symmetric waves, we start with reproducing the results for symmetric waves. The rescaled wavelength and the phase velocity are always set to be
 $2\unicode[STIX]{x03C0}$
and 1 respectively. Using the definition of
 $c$
,
 $$\begin{eqnarray}c=\frac{1}{2\unicode[STIX]{x03C0}}\int _{0}^{2\unicode[STIX]{x03C0}}\unicode[STIX]{x1D719}_{x}\,\text{d}x,\end{eqnarray}$$
we obtain
 $$\begin{eqnarray}x=2\unicode[STIX]{x03C0},\quad \text{at}~\unicode[STIX]{x1D719}=2\unicode[STIX]{x03C0}.\end{eqnarray}$$
The wave is symmetric in the physical plane with respect to
 $x=\unicode[STIX]{x03C0}$
and in the complex potential plane with respect to
 $\unicode[STIX]{x1D719}=\unicode[STIX]{x03C0}$
. By imposing the symmetry condition on (3.10), we immediately obtain
 $$\begin{eqnarray}x=\unicode[STIX]{x03C0},\quad \text{at}~\unicode[STIX]{x1D719}=\unicode[STIX]{x03C0}.\end{eqnarray}$$
Then we introduce
 $N$
collocation points uniformly distributed along
 $\unicode[STIX]{x1D719}$
in
 $(0,\unicode[STIX]{x03C0}]$
 $$\begin{eqnarray}\unicode[STIX]{x1D719}_{j}=\frac{2j-1}{2N}\unicode[STIX]{x03C0},\quad j=1,2,\ldots ,N.\end{eqnarray}$$
The dynamic boundary condition (2.13) is satisfied at these points, which yields
 $N$
algebraic equations. The final equation is to fix the value of a specific coefficient, e.g.
 $$\begin{eqnarray}a_{m}=\unicode[STIX]{x1D6FC},\end{eqnarray}$$
where
 $m$
and
 $\unicode[STIX]{x1D6FC}$
are suitably chosen. By fixing the values of
 $p$
and
 $a_{m}$
, the resulting system with
 $N+2$
equations and
 $N+2$
unknowns
 $(\unicode[STIX]{x1D6FC}_{0},a_{1},\ldots ,a_{N},q)$
can be solved by Newton’s method. During the numerical calculations, we monitor the converged value of the determinant of the Jacobian. When the value changes sign, a bifurcation can occur and a new branch of symmetric waves may emanate. We call this operation the symmetric Jacobian test to ease referring. We note that (3.13) is particularly useful for computing the solutions near bifurcation points. For non-symmetric waves, the coefficients
 $b_{n}$
are non-zero. We need to introduce another
 $N$
collocation points in
 $(\unicode[STIX]{x03C0},2\unicode[STIX]{x03C0}]$
 $$\begin{eqnarray}\unicode[STIX]{x1D719}_{j}=\frac{2j-1}{2N}\unicode[STIX]{x03C0},\quad j=N+1,N+2,\ldots ,2N.\end{eqnarray}$$
The dynamic boundary condition (2.13) is also satisfied on these points, which yields extra
 $N$
algebraic equations. Meanwhile, (3.11) is replaced by (3.10). The final control equation is to fix one of the coefficients
 $b_{n}$
, e.g.
 $$\begin{eqnarray}b_{m}=\unicode[STIX]{x1D6FD},\end{eqnarray}$$
where
 $m$
and
 $\unicode[STIX]{x1D6FD}$
are suitably chosen. We have a system with
 $2N+2$
equations and
 $2N+2$
unknowns
 $(\unicode[STIX]{x1D6FC}_{0},a_{1},\ldots ,a_{N},b_{1},b_{2},\ldots ,b_{N},q)$
which can again be solved by Newton’s method. To avoid small shifted symmetric waves, we replace one of the algebraic equations associated with the dynamic boundary condition by
 $$\begin{eqnarray}\mathop{\sum }_{n=1}^{N}b_{n}=0.\end{eqnarray}$$
This condition is to make sure that a crest or a trough lies at the origin as explained in Shimizu & Shōji (Reference Shimizu and Shōji2012). The wave profile can be computed by integrating
 $x_{\unicode[STIX]{x1D719}}$
and
 $y_{\unicode[STIX]{x1D719}}$
once the Fourier coefficients are obtained. This numerical method was successfully used in several different problems, e.g. see Blyth & Vanden-Broeck (Reference Blyth and Vanden-Broeck2004), Shimizu & Shōji (Reference Shimizu and Shōji2012) and Gao & Vanden-Broeck (Reference Gao and Vanden-Broeck2014). The accuracy of this numerical method was discussed in Gao & Vanden-Broeck (Reference Gao and Vanden-Broeck2014).
The challenge here is to find suitable initial guesses to jump on branches of non- symmetric waves. To find a symmetry-breaking point, we interpolate a symmetric solution
 $(\unicode[STIX]{x1D6FC}_{0},a_{1},\ldots ,a_{N},q)$
with zero
 $b_{n}$
coefficients. Then
 $(\unicode[STIX]{x1D6FC}_{0},a_{1},\ldots ,a_{N},q,0,0,\ldots ,0)$
is still an exact solution of a symmetric wave. We perform this operation along the symmetric branches and evaluate the Jacobian of the enlarged system with
 $a_{n}$
and
 $b_{n}$
all involved (see Shimizu & Shōji (Reference Shimizu and Shōji2012) for more details). We name this operation the full Jacobian test. Symmetry breaking takes place when the full Jacobian test shows the change of sign but the symmetric Jacobian test does not. It is noted that, to be best of our knowledge, using the sign of the Jacobian to detect bifurcation points was initially proposed by Keller (Reference Keller and Rabinowitz1977).
By using (3.15) near a symmetry-breaking point, the solution converges after several iterations and a non-symmetric wave is obtained. Afterwards the whole bifurcation diagram can be completed by using the continuation method. In this paper, we choose
 $N=500$
for computing symmetric waves and
 $N=1000$
for non-symmetric waves. There are no significant changes in solutions by using a larger
 $N$
. A solution is considered to be converged if the
 $l^{\infty }$
-norm of the residual error of Newton’s method is less than
 $10^{-9}$
.
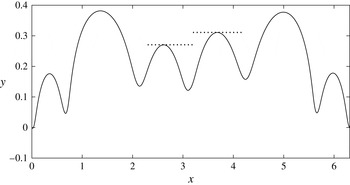
A non-symmetric wave profile with six peaks in one wavelength with
 $p=1.41$
and
 $q=0.1376$
. The dotted lines are used as visual guides for asymmetry.

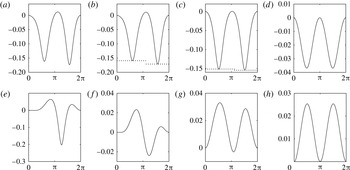
(a–d) Non-symmetric waves of two peaks on the branch bifurcating from the primary branch
 $P_{2}$
for
 $q=0.2208$
and
 $p=1.2$
,
 $1.1197$
,
 $1.18$
,
 $1.12$
respectively. (e–h) Non-symmetric waves of two peaks on the branch bifurcating from
 $S_{23}$
for
 $q=0.2487$
and
 $p=1.2$
,
 $1.01$
,
 $1.007$
,
 $1.006$
respectively. The profiles are plotted in the physical
 $x$
–
 $y$
plane. The dotted lines are used as visual guides for asymmetry. As
 $p$
decreases, the wave profiles finally become symmetric (d and h).

(a–d) Non-symmetric waves of two peaks on the branch bifurcating from
 $P_{2}$
for
 $pq=0.2782$
and
 $p/q=5.1764$
, 21, 35, 89 respectively. (e–h) Non-symmetric waves of two peaks on the branch bifurcating from
 $S_{23}$
for
 $pq=0.2908$
and
 $p/q=4.9527$
,
 $8.4527$
,
 $11.9527$
,
 $79.5$
respectively. The profiles are plotted in the physical
 $x$
–
 $y$
plane. The dotted lines are used as visual guides for asymmetry. As
 $p/q$
increases, the wave profiles finally become symmetric (d and h).

(a) Bifurcation diagram of non-symmetric waves with three peaks for
 $p=1.2$
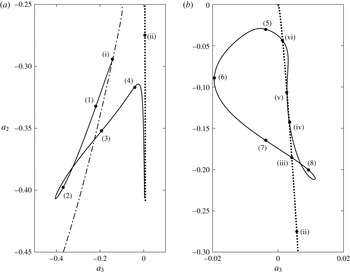
. The solid curve is a branch of non-symmetric waves with three peaks in one wavelength. The dash-dotted curve is a branch of symmetric waves of mode (3, 2) whereas the dotted curve corresponds to a branch of shifted symmetric waves. (b) Continuation of the dotted branch of shifted symmetric waves. The solid curve is a branch of non-symmetric waves with four peaks.

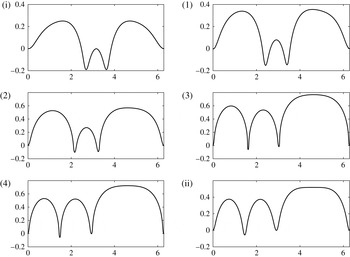
Wave profiles for the points indicated in figure 5(a). They are plotted in the
 $x$
–
 $y$
plane where
 $p=1.2$
fixed and
 $q=$
(i) 0.2160,
 $(1)$
0.2289,
 $(2)$
0.2756,
 $(3)$
0.3285,
 $(4)$
0.3082, (ii) 0.2817.

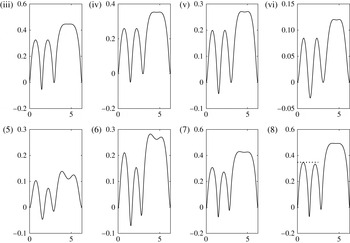
Wave profiles for those points indicated in figure 5(b). They are plotted in the
 $x$
–
 $y$
plane where
 $p=1.2$
fixed and
 $q=$
(iii) 0.2333, (iv) 0.2156, (v) 0.2027, (vi) 0.1852, (5) 0.1831, (6) 0.2019, (7) 0.2290, (8) 0.2431.

(a) Bifurcation diagram of non-symmetric waves with five peaks in one wavelength and
 $p=1$
: the branch of non-symmetric waves with five peaks (solid curve), part of the
 $S_{54}$
branch (dotted curve), part of a branch of shifted symmetric waves (dashed curve). The sharp nature near the point (i) is shown in more detail. (b) Bifurcation diagram of non-symmetric waves with seven peaks in one wavelength and
 $p=1.05$
: the branch of non-symmetric waves with seven peaks (solid curve), part of the
 $S_{76}$
branch (dashed curve), part of a branch of shifted symmetric waves (dotted curve).

Wave profiles for the points indicated in figure 8(a). They are plotted in the
 $x$
–
 $y$
plane with
 $p=1$
fixed and
 $q=$
(i) 0.2012, (1) 0.2173, (2) 0.2460, (3) 0.3242, (4) 0.3907, (ii) 0.4424.

Wave profiles for the points indicated in figure 8(b). They are plotted in the
 $x$
–
 $y$
plane where
 $p=1.05$
and
 $q=$
(iii) 0.1865, (5) 0.2194, (6) 0.2342, (iv) 0.2573.

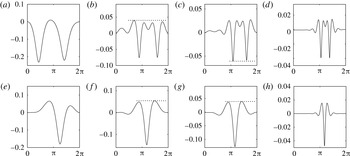
Examples of extending the non-symmetric wave (7) in figure 7. The value of
 $pq$
is fixed to be 0.2847 and
 $p/q$
is equal to (a) 55, (b) 60, (c) 70. These solutions lead to non-symmetric waves with (d) eight peaks, (e) nine peaks and (f) ten peaks respectively. The profiles are plotted in the
 $x$
–
 $y$
plane.

4 Numerical results
4.1 Non-symmetric waves in deep water
Shimizu & Shōji (Reference Shimizu and Shōji2012) discovered numerically non-symmetric waves with six peaks and two peaks per wavelength in deep water resulting from the spontaneous symmetry-breaking bifurcations. As presented in their paper, a branch emanating from a linear wave solution which satisfies the dispersion relation for some integer wavenumber
 $m$
is called a primary branch of mode
 $m$
. For the branch of mode
 $m$
,
 $a_{m}$
is the most dominant Fourier coefficient of the periodic solution. If a further bifurcation occurs on a primary branch, it leads to a new family of solutions and is called a secondary branch of mode
 $(m,n)$
, which means there are two dominant coefficients
 $a_{m}$
and
 $a_{n}$
. Analogously, a branch bifurcating from a secondary branch is called a tertiary branch. We denote the primary branch of mode
 $m$
by
 $P_{m}$
, the secondary branch of mode
 $(m,n)$
by
 $S_{mn}$
and the tertiary branch of mode
 $(m,n,j)$
by
 $T_{mnj}$
. The order of the index essentially shows the solution structure, e.g. a
 $T_{mnj}$
bifurcates from a
 $S_{mn}$
which originates from
 $P_{m}$
(see the following schematic)
 $$\begin{eqnarray}P_{m}\rightarrow S_{mn}\rightarrow T_{mnj}.\end{eqnarray}$$
We continue to investigate this problem by reproducing first the results in Shimizu & Shōji (Reference Shimizu and Shōji2012) and then by searching for new types of non-symmetric waves. We fix the value of
 $p$
and change
 $q$
in the continuation method. As described in § 3, we depart from
 $P_{6}$
and perform the symmetric and full Jacobian tests along the branch at the same time. A
 $S_{62}$
is found but there is no non-symmetric branch. We continue the same process on
 $S_{62}$
and find a
 $T_{621}$
, but still non-symmetric branch is not found. Finally, on the tertiary branch
 $T_{621}$
, we manage to find a symmetry-breaking point from which a non-symmetric branch emanates. A typical wave profile is shown in figure 2. The detailed bifurcation diagrams are shown in figures 4 and 5 of Shimizu & Shōji (Reference Shimizu and Shōji2012).
There are two types of non-symmetric waves with two peaks: (i) those bifurcating from the primary branch
 $P_{2}$
; (ii) those bifurcating from the secondary branch
 $S_{23}$
. Examples for both types are shown in figure 3. By fixing
 $q$
and varying
 $p$
for non-symmetric waves with two peaks, we observe that the asymmetry vanishes as the value of
 $p$
decreases to a certain number. The ratio of gravity to surface tension becomes smaller along with the decrease of the value of
 $p$
, since
 $p/q=\unicode[STIX]{x1D70C}g\unicode[STIX]{x1D706}^{2}/(4\unicode[STIX]{x03C0}^{2}T)$
. This phenomenon is coincident with the conjecture made by Okamoto & Shōji (Reference Okamoto and Shōji1991) (also emphasised by Shimizu & Shōji Reference Shimizu and Shōji2012) that Crapper’s waves are the only non-trivial solutions for steady pure capillary waves.
Inspired by the work of Dias (Reference Dias1994) who obtained symmetric capillary–gravity solitary waves by extending the wavelength of symmetric periodic waves, we perform the same procedure to see whether it is possible to find non-symmetric solitary waves from non-symmetric periodic waves. This can be achieved in our problem by fixing the value of
 $pq$
and enlarging
 $p/q$
of a solution. Since in deep water gravity–capillary solitary waves can only exist below the minimum of the phase speed, i.e.
 $c<c^{\ast }$
(see Vanden-Broeck & Dias (Reference Vanden-Broeck and Dias1992) for more details), we should choose the parameters
 $p$
and
 $q$
such that
 $$\begin{eqnarray}pq=\frac{gT}{\unicode[STIX]{x1D70C}c^{4}}>\frac{gT}{\unicode[STIX]{x1D70C}c^{\ast 4}}=\frac{1}{4}.\end{eqnarray}$$
In figure 4, the numerical experiments show that the asymmetry gradually disappears as the value of
 $p/q$
is further increased, and the solution finally ends up with a shifted depression or elevation solitary wave. However this approach is found to be extremely useful for discovering new non-symmetric waves with more peaks. This will be discussed in §§ 4.1.1 and 4.1.2.
4.1.1 New non-symmetric waves
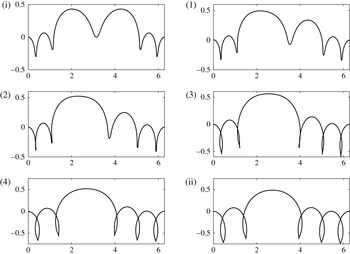
An immediate question arising from the work of Shimizu & Shōji (Reference Shimizu and Shōji2012) is: can we find non-symmetric waves with a number of peaks other than two or six? The answer is positive. We start with presenting the results for 3 peaks. The symmetry-breaking point is found to be on an
 $S_{32}$
branch (point (i) in figure 5
a). By following the solid curve (i)
 $\rightarrow$
(1)
 $\rightarrow$
(2)
 $\rightarrow$
(3)
 $\rightarrow$
(4), the asymmetry gradually fades out after the point (4) and eventually joins a branch of shifted symmetric waves (dotted line in figure 5
a). A detailed bifurcation diagram is presented in figure 5(a), and typical wave profiles are shown in figure 6.
By following further the branch of shifted symmetric waves (dotted curves in figure 5 a,b), we discover a new branch of non-symmetric waves with four peaks. The full bifurcation diagram is shown in figure 5(b) and typical wave profiles are sketched in figure 7. We notice that the dotted curve in figure 5(b) finally tends to the origin, which implies that this type of shifted waves with four peaks can only bifurcate from the uniform stream. This is the reason why one cannot obtain these results by the approach for the symmetry-breaking study.
Example of extending a non-symmetric wave with five peaks. (a)
 $p=1.3113$
,
 $q=0.2110$
, (b)
 $p=3.8045$
,
 $q=0.0727$
, (c)
 $p=3.8045$
,
 $q=0.0660$
. The profiles are plotted in the
 $x$
–
 $y$
plane.

The isolated branch of a family of non-symmetric waves plotted in the
 $b_{1}$
–
 $q$
plane. The value of
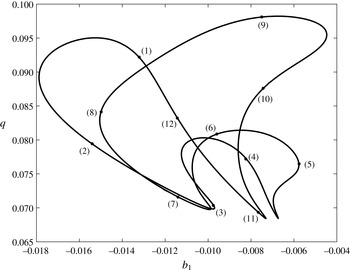
 $p$
is fixed to be 3.7560. All the waves from this branch are non-symmetric. Some typical wave profiles are sketched in figure 14.

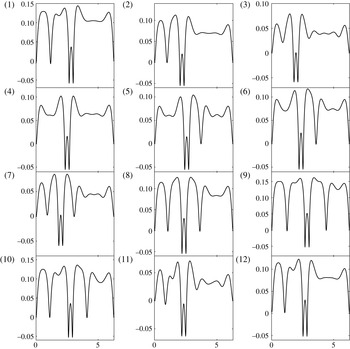
Wave profiles for the points indicated in figure 13. They are plotted in the physical
 $x$
–
 $y$
plane with
 $p=3.7560$
fixed and
 $q=$
(1) 0.0922, (2) 0.0794, (3) 0.0704, (4) 0.0772, (5) 0.0764, (6) 0.0808, (7) 0.0716, (8) 0.0841, (9) 0.0981, (10) 0.0876, (11) 0.0693, (12) 0.0832.

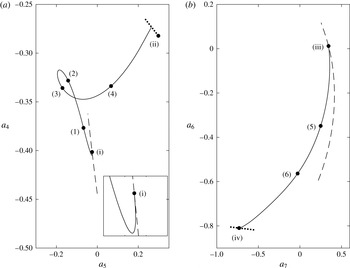
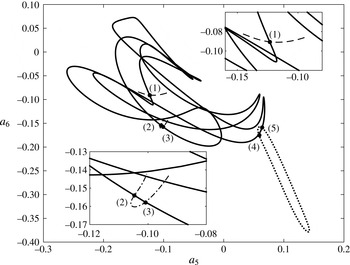
Other bifurcations occurring on the isolated non-symmetric branch which was presented in figure 13. We plot in the
 $a_{5}$
–
 $a_{6}$
plane instead of the
 $b_{1}$
–
 $q$
plane to make the bifurcations easier to view.

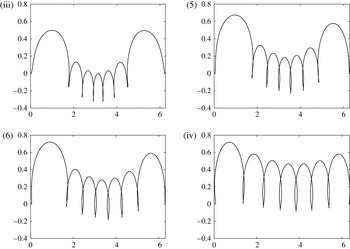
The bifurcations for non-symmetric waves with five and seven peaks are qualitatively similar to those with three peaks. They both emanate from a secondary branch (
 $S_{54}$
and
 $S_{76}$
respectively) and end at a branch of shifted symmetric waves (see figure 8). Due to large wave amplitudes, overhanging structures (multivalued profiles) are observed, and the typical waves are shown in figures 9 and 10. On physical grounds, the overhanging structure in capillary/gravity–capillary waves is of interest due to its important role in air bubble formation and air–water gas exchanges therefrom (Longuet-Higgins Reference Longuet-Higgins1988). The limiting configuration occurs when the profile develops a point of contact pinching off a ‘trapped bubble’. Further down the bifurcation curve, the solutions become unphysical since they feature a self-intersecting structure, though they are admitted mathematically by the full Euler equations. A large number of collocation points is required to maintain the high accuracy near the dotted curves in both graphs of figure 8. A typical value for
 $N$
there is 3000.
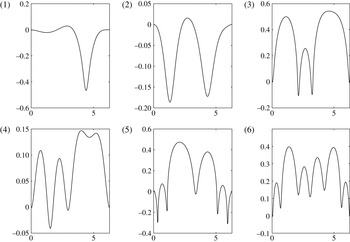
Non-symmetric waves in water of finite depth for
 $Q=3$
where (1)
 $p=1.2$
,
 $q=0.3274$
, (2)
 $p=1.2$
,
 $q=0.2218$
, (3)
 $p=1.2$
,
 $q=0.2711$
, (4)
 $p=1.2$
,
 $q=0.1861$
, (5)
 $p=1$
,
 $q=0.2038$
, (6)
 $p=1.41$
,
 $q=0.1422$
.

Branches of non-symmetric solutions for
 $p=3.7560$
and
 $Q=\infty$
,
 $3$
,
 $2.6$
,
 $2.55$
,
 $2.53$
,
 $2.525$
respectively (from outside to inside).

A further extension is to find non-symmetric waves with more peaks. It can be achieved by fixing the value of
 $pq$
and increasing the value of
 $p/q$
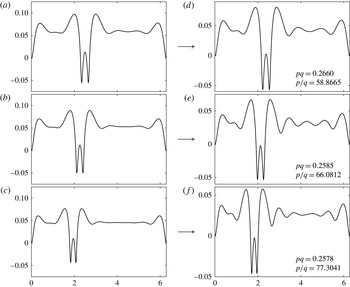
(as seen in figure 4). We apply the approach to those non-symmetric waves presented above. We perform our first numerical experiment with the non-symmetric wave given in figure 7(7), and observe that a large peak evolves to two ripples with a long flat platform generated in between as shown in figure 11(a). We stop at some value of
 $p/q$
and take the solution as the initial guess. Three examples are presented in figure 11(a–c) for different values of
 $p/q$
. Then by fixing the value of
 $p$
and varying
 $q$
, some new waves can be found. It is shown in figure 11(d–f) that as the value of
 $p/q$
increases, the number of peaks generated increases. Therefore a further increase of
 $p/q$
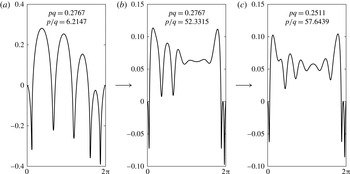
leads to a new solution with more peaks. We have a reason to believe that non-symmetric waves can exist with any integer number of peaks. Although no rigorous proof is provided, the results show very strong numerical evidence. This approach can also be applied to other non-symmetric waves. We take a non-symmetric wave with five peaks (figure 12(a),
 $p=1.3113$
,
 $q=0.2110$
) for example. This wave bifurcates from a branch of shifted symmetric waves. Here we do not present the detailed bifurcation structure since it is qualitatively similar to the one with three peaks. We fix the value of
 $pq$
and change
 $p/q$
to 52.3146 as shown in figure 12. Then we use wave (b) as an initial guess, fix the value of
 $p$
and vary
 $q$
to follow the bifurcation branch where a new non-symmetric wave with nine peaks is obtained (see figure 12
c).
4.1.2 Isolated branches of non-symmetric waves
We now focus on the non-symmetric wave with eight peaks as shown in figure 11(d). By numerical continuation, we obtain the whole family of solutions and sketch them by using
 $b_{1}$
and
 $q$
as the bifurcation parameters in figure 13. Upon the branch, the wave tries to balance both sides but fails (see figure 14), as a consequence, it has no choice but to rejoin its own branch. As shown in figure 13 the branch of non-symmetric waves is found to be a closed loop which is isolated without the presence of branches of symmetric waves. Several bifurcation points have been found on this isolated non-symmetric branch, which are marked as (1)–(5) in figure 15. The new bifurcation branches (dotted and dash-dotted lines shown in figure 15) are also non-symmetric waves. In particular, a simple closed branch which bifurcates from the point (4) or (5) has been observed (dashed curve in figure 15). We have not completed the branches which bifurcate at points (1) and (2) or (3) but we expect that they will form an isolated branch of non-symmetric waves or join a branch of (shifted) symmetric waves. Besides we also investigated the branches arising from the non-symmetric waves with nine and ten peaks (figure 11
e,f). The solution structures are qualitatively similar, and isolated non-symmetric branches are also found.
4.2 Non-symmetric waves on water of finite depth
To generalise the results to water of finite depth, we use a solution in deep water as an initial guess and treat the value of the streamfunction at the bottom
 $Q$
as a parameter in the continuation method. Without much effort, many different non-symmetric waves are obtained. Some typical profiles for
 $Q=3$
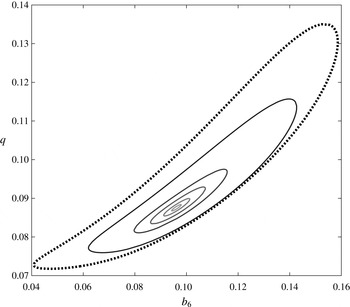
are plotted in figure 16, therefore the existence of non-symmetric periodic gravity–capillary waves in water of finite depth is confirmed. We apply the same approach to the dotted loop from the bottom right of figure 15 to obtain the results for different values of
 $Q$
. They are presented in a
 $b_{6}$
–
 $q$
parametric space in figure 17. As the value of
 $Q$
decreases, the solution branch shrinks and eventually vanishes when
 $Q<2.5$
. It indicates clearly that the asymmetry may disappear due to finite-depth effects.
5 Conclusion
We started by reproducing the non-symmetric, deep-water, gravity–capillary waves of two peaks and six peaks in one wavelength, in excellent agreement with the results of Shimizu & Shōji (Reference Shimizu and Shōji2012), confirming the validity and capability of our numerical procedure. By using the same mechanism for symmetry-breaking investigation, we have found new branches of non-symmetric waves with three, four, five and seven peaks. These waves are in general of large amplitudes, and all appear, via spontaneous symmetry-breaking bifurcations. Furthermore, an approach which is equivalent to the method of extending the wavelength is introduced to discover more new solutions. Besides, we have found isolated closed branches of non-symmetric waves without symmetry breaking involved. It illustrates the fact that the presence of non-symmetric waves cannot only be from symmetry breaking but also in the form of isolated loops. Finally, the numerical results were generalised to the finite-depth case, where the existence of non-symmetric solutions were also confirmed, as well as the isolated bifurcation branches.
The stability of all these solutions is an interesting question, for both physical and theoretical reasons. Symmetric periodic gravity–capillary waves were found to be unstable (see e.g. Deconinck & Trichtchenko Reference Deconinck and Trichtchenko2014), so we conjecture that asymmetric solutions are unstable as well, and we leave this as the subject for a future study. Of course, numerical evidence cannot replace the mathematical proof, therefore it is of interest to rigorously prove the existence of asymmetric periodic/solitary gravity–capillary waves.
Three-dimensional fully localised solitary waves, which are commonly referred to as ‘lumps’, were observed recently in the experiments by Diorio et al. (Reference Diorio, Cho, Duncan and Akylas2009, Reference Diorio, Cho, Duncan and Akylas2011). Therefore the results presented in this paper naturally bring up the question of the possible existence of non-symmetric progressive waves in three dimensions. In fact, non-symmetric gravity–capillary lumps have been found in a reduced model by Wang & Vanden-Broeck (Reference Wang and Vanden-Broeck2015), however, it is more interesting to investigate the problem in the three-dimensional full Euler equations.
Acknowledgements
This work was supported by the National Natural Science Foundation of China (grant no. 11232012), Key Research Program of Frontier Sciences, CAS (grant no. QYZDB-SSW-SYS015), and EPSRC (grant no. EP/J019569/1). Part of the work of J.-M.V.B. was done during a visit in April 2015 at the Institut des Hautes Études Scientifiques.