
I. INTRODUCTION
Aluminum alloys are one of the most important light-weight structural materials. Particularly Al–Mg–Si (AA6xxx) alloys which have a desirable combination of good formability and high strengthening potential are widely used in the automotive industry due to increasing demands to improve the fuel efficiency and lower vehicle emissions. Reference Miller, Zhuang, Bottema, Wittebrood, De Smet, Haszler and Vieregge1–Reference Marioara, Andersen, Jansen and Zandbergen3
In most automotive applications, the materials are subjected to alternating loads, hence, their fatigue properties are critical. Generally, fatigue-related failure is one of the major reasons for the damage of metals and metallic alloys. Reference Mughrabi4 Specifically, it has been reported that about 90% of mechanical service failures are caused by cyclic loading. Reference Campbell5
Unfortunately, the fatigue performance of Al alloys is not very high and particularly that of precipitation hardened aluminum alloys. For example, the fatigue ratio (fatigue strength/ultimate tensile strength) of engineering steels amounts to ∼0.5 Reference Hutchinson, De Geuser, Chen and Deschamps6,Reference Nandy, Sekhar, Kar, Ray and Das7 ; while that of precipitation strengthened aluminum alloys is as low as ∼0.3 under high cycle fatigue conditions. Reference Hutchinson, De Geuser, Chen and Deschamps6,Reference Nandy, Sekhar, Kar, Ray and Das7
The high strength of Al–Mg–Si alloys is obtained through precipitation hardening by formation of nanosized coherent and/or semicoherent metastable precipitates. Reference Tsao, Chen, Jeng and Kuo8,Reference Yang, Huang, Zhang, Wang, Li, Jia, Lei and Sheng9 Numerous studies on the characterisation of the precipitate phases and their precipitation sequence have been published during the past decades. Reference Edwards, Stiller, Dunlop and Couper2,Reference Torsæter, Hasting, Lefebvre, Marioara, Walmsley, Andersen and Holmestad10–Reference Pogatscher, Antrekowitsch, Werinos, Moszner, Gerstl, Francis, Curtin, Löffler and Uggowitzer13
Generally, the precipitation sequence in these alloys follows Reference Edwards, Stiller, Dunlop and Couper2 :
 $${\rm{SSSS}} \to {\rm{atomic}}\;{\rm{clusters/GP-zones}} \to \beta '' \to \beta ' \to \beta \quad ,$$
where SSSS is a super-saturated solid solution and atomic clusters are clusters of solute atoms in the fcc Al matrix phase without a specific structure. The atomic clusters are usually considered as a prestage for the formation of Guinier–Preston (GP) zones, Reference Guinier14,Reference Preston15 platelet-like metastable solute enriched zones which exhibit chemical ordering, and maintain the crystal structure of the Al matrix. β″ precipitates are metastable needle-like coherent precipitates which grow along 〈001〉 directions of the Al matrix. Reference Marioara, Andersen, Jansen and Zandbergen3,Reference Matsuda, Naoi, Fujii, Uetani, Sato, Kamio and Ikeno16–Reference Lynch, Brown and Jacobs18 These β″ precipitates have a monoclinic crystal structure and are predominantly formed in under-aged material conditions. Reference Marioara, Andersen, Jansen and Zandbergen3,Reference Matsuda, Naoi, Fujii, Uetani, Sato, Kamio and Ikeno16–Reference Lynch, Brown and Jacobs18 Similarly, β′ Mg2Si precipitates are metastable rod-like precipitates with a hexagonal crystal structure, which grow along 〈001〉 directions of the Al matrix. Reference Lynch, Brown and Jacobs18–Reference Marioara, Nordmark, Andersen and Holmestad20 Both, β″ and β′ are coherent resp. semicoherent with the Al matrix, and they are the dominant precipitate phases in the peak-aged material. β is a thermodynamically stable Mg2Si phase with an fcc crystal structure. Reference Lynch, Brown and Jacobs18–Reference Marioara, Nordmark, Andersen and Holmestad20 During the formation of β precipitates, coherency with the Al matrix is lost, and these incoherent precipitates are mainly formed in over-aged materials. Reference Lynch, Brown and Jacobs18–Reference Marioara, Nordmark, Andersen and Holmestad20
Although the structure of these precipitates and their impact on monotonic deformation have been well studied during the past decades, only limited work has been performed on the influence of these precipitates on the fatigue properties of AA6xxx alloys.
The cyclic loading response of pure Al single crystals is characterized by a hardening-softening-secondary hardening sequence. Reference Vorren and Ryum21,Reference Videm and Ryum22 The fatigue microstructure of pure Al is dominated by the formation of dislocation cells Reference Fujii, Sawatari, Onaka and Kato23–Reference Nellessen, Sandlöbes and Raabe30 and deformation bands. Reference Nellessen, Sandlöbes and Raabe30–Reference Zhai, Martin and Briggs32
Only few studies have investigated the low cycle fatigue (LCF) behavior and the underlying mechanisms of age-hardened Al–Mg–Si alloys. Reference Chandler and Bee33–Reference Nandy, Sekhar, Das, Hossain and Ray42 Some of these studies have reported that instead of cyclic softening, as is prevalent in pure Al, cyclic hardening occurs in Al–Mg–Si alloys. Specifically, Chandler and Bee Reference Chandler and Bee33 have reported that solution-treated AA6351 cyclically hardens and suggested that this cyclic hardening is caused by cyclic strain-induced precipitation. Similarly, Nandy et al. Reference Nandy, Sekhar, Kar, Ray and Das7,Reference Nandy, Sekhar, Das, Hossain and Ray42 have observed dynamic precipitation during LCF in an under-aged AA6063 alloy. Further studies on other age-hardened Al alloys have also reported such a hardening stage and have related it to dynamic precipitation reactions. Already in the 1980s, Laird et al. Reference Laird, Langelo, Hollrah, Yang and De La Veaux43 have observed cyclic hardening in an Al–15 wt% Ag alloy, which they explained by strain-induced γ precipitation. Later, Pahl and Cohen Reference Pahl and Cohen44 have reported significant growth of GP zones in under-aged Al–Zn alloys during cyclic deformation at room temperature caused by a dynamic increase of vacancies during deformation. In 1987, Chandler and Bee Reference Chandler and Bee33 have reported dynamic precipitation in a solution-treated AA6351 alloy during cyclic loading, resulting in cyclic hardening. Farrow and Laird Reference Farrow and Laird45 have observed accelerated formation and growth of θ′ precipitates during cyclic deformation in a solution-treated Al–4Cu alloy and concluded that this might be caused by a strain-induced increase in the number of dislocations and vacancies. Similarly, Han et al. Reference Han, Chen, Vinogradov and Hutchinson46 have observed dynamic precipitation and a secondary hardening stage during LCF of an under-aged Al–4Cu alloy. Hörnqvist and Karlsson Reference Hörnqvist and Karlsson47 have reported that dynamic precipitation during cyclic loading can impede cyclic softening in naturally aged AA7030. Hutchinson et al. Reference Hutchinson, De Geuser, Chen and Deschamps6 have recently reported pronounced cyclic hardening in an under-aged Al–Zn–Mg–(Cu) alloy at room temperature, which they have attributed to dynamic precipitation of GP zones.
In contrast, dynamic softening has also been observed during cyclic loading of AA6xxx alloys, which has been explained by the shearing of precipitates. Specifically, Srivatsan et al. Reference Srivatsan, Sriram and Daniels34 have studied the influence of temperature on the cyclic stress response and fracture behavior of AA6061. They Reference Srivatsan, Sriram and Daniels34 have observed cyclic softening at all testing temperatures and have proposed that the softening might be caused by dissolution of precipitates. Yahya et al. Reference Yahya, Mallik and Chakrabarty38 have studied the influence of strain amplitude and strain rate on the LCF behavior of AA6063 and concluded that the observed cyclic softening is associated with shearing of ordered precipitates.
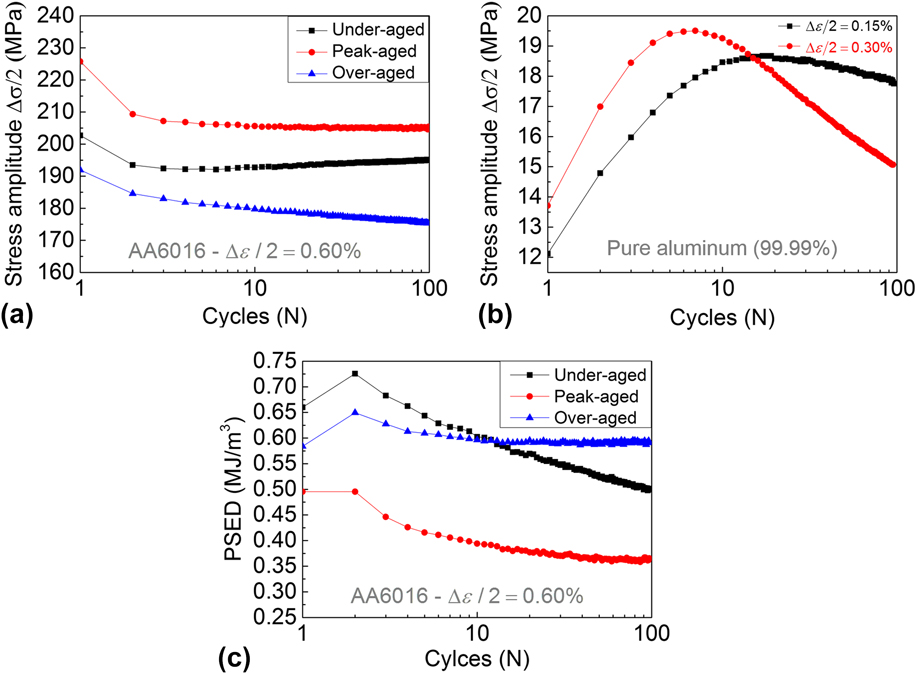
However, in spite of these works on AA6xxx and other Al series alloys, an in-depth understanding of the effects of precipitates during cyclic loading of Al–Mg–Si alloys under different aging conditions and the corresponding mechanisms is missing, although it is critical for any fatigue-related application of AA6xxx alloys, such as encountered in the automotive industry. Therefore, in this study, we compared the cyclic loading response and fatigued microstructures of differently annealed AA6016 samples exhibiting different precipitate types, sizes, and dispersions. To this end, we utilized mechanical testing, transmission electron microscopy (TEM), and scanning transmission electron microscopy (STEM). We find that the cyclic loading response of the AA6016 alloy investigated is sensitively affected by the precipitation state. Specifically, under-aged AA6016 exhibits no softening but a hardening stage, whereas peak-aged AA6016 and over-aged AA6016 show a saturation (peak-aged) and softening (over-aged) stage, respectively. This difference in cyclic loading response is attributed to the interaction of dislocations with solute atoms and precipitates.
II. EXPERIMENTAL PROCEDURE
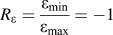
The material investigated in this study is a commercial AA6016 alloy in as-cold rolled condition. The alloy was cast by Aleris Rolled Products Germany GmbH (Koblenz, Germany) and thermo-mechanically processed by Aluminum Norf GmbH (Neuss, Germany). The cold-rolled sheet was solution heat treated (SHT) at 560 °C for 60 min and water-quenched to room temperature. The SHT sheet had a fully recrystallized microstructure with an average grain size of about 50 µm and a cube texture. Subsequently, the sheet was cut into pieces which were aged at 185 °C for 20 min [under-aged (UA)], 4 h [peak-aged (PA)], 24 h [over-aged (OA)], respectively. The hardness of the samples after different annealing times was measured on an MH-5L Vickers microhardness testing machine (Shanghai Precision & Scientific Instrument Co., Ltd., Shanghai, China) with a load of 100 g and a dwell time of 15 s at room temperature. The given hardness values are averaged over seven indentations each. The tensile properties of the UA, PA, and OA material were determined by tensile tests at room temperature using an electromechanical testing machine. Tensile specimens with a gauge length of 3.50 mm and a cross section of 1.5 × 1 mm were prepared with the tensile axis parallel to the rolling axis. For each condition, five specimens were tested at an initial strain rate of 1 × 10⁻³ s−1. Cyclic tension-compression tests were carried out under (constant) displacement control with calculated total strain amplitudes (Δε/2) of 0.15, 0.30, 0.45, and 0.60% and a constant strain rate of 2 × 10⁻⁴ s−1. The cyclic deformation tests were performed as symmetric pull–push tests with a constant total strain amplitude, i.e.,
 ${R_\varepsilon } = {{{\varepsilon _{\min }}} \over {{\varepsilon _{\max }}}} = - 1$
at room temperature. Each cyclic tension-compression test was repeated 3 times. This paper focuses on samples cyclically deformed at a strain amplitude of 0.60%. Recrystallised pure Al samples with an average grain size of 80 µm and cube textures were tested in cyclic symmetric pull–push tests (R = −1) for comparison to AA6016.
Electron transparent foils for TEM and STEM observations were prepared from discs with a diameter of 3 mm and a height of 1 mm by mechanical grinding and polishing followed by twin-jet electro-polishing until perforation using a solution of 700 mL ethanol (C2H5OH), 100 mL butyl glycol (C6H14O2), and 78 mL perchloric acid (60%) (HClO4) at 15 °C and 25 V. ≥10 TEM micrographs per grain from at least 3 different grains were analyzed to determine the average precipitate (i) cross-section, (ii) length, (iii) number density, and (iv) volume fraction. Convergent beam electron diffraction (CBED) was used to determine the thickness of the investigated areas. Reference Williams and Carter48
Transmission electron microscopy (TEM) was conducted on a JEOL-2000 FX (JEOL Ltd., Tokyo, Japan) and a Philips CM20 TEM (FEI, Eindhoven, the Netherlands), both operated at an acceleration voltage of 200 kV. STEM observations were performed on an FEI Helios Nanolab 600i scanning electron microscope (FEI, Eindhoven, the Netherlands) operated in transmission mode at 30 kV.
III. EXPERIMENTAL RESULTS
A. Alloy and precipitate characteristics
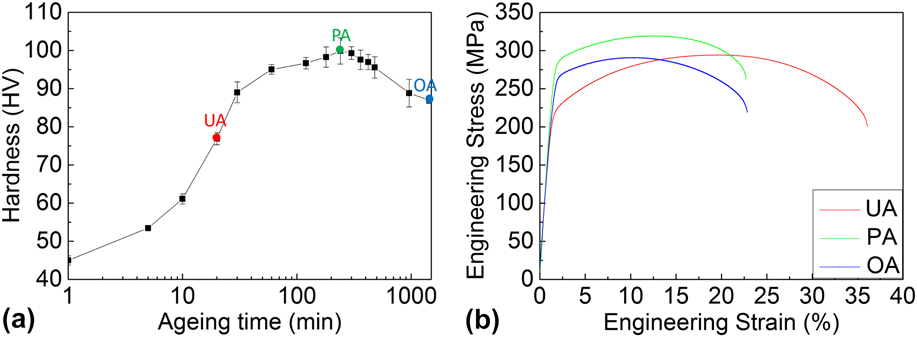
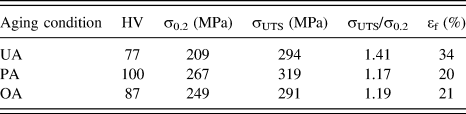
Figure 1 shows the microhardness evolution curve of the AA6016 alloy upon artificial aging at 185 °C (a) and the engineering stress–strain curves of the three selected aging conditions: under-aged (UA), peak-aged (PA), and over-aged (OA) (b) as marked in Fig. 1(a). The corresponding micro-hardness (HV), yield strength (σ0.2), ultimate tensile strength (σUTS), and elongation to fracture (εf) values are listed in Table I.
Evolution of the micro-hardness of the AA6016 alloy upon artificial aging at 185 °C (a), engineering stress–strain curves of under-aged (UA), peak-aged (PA) and over-aged (OA) AA6016 (b).

Hardness (HV), yield stress (σ0.2), σUTS, σUTS/σ0.2 and tensile elongation (εf) of under-aged (UA), peak-aged (PA) and over-aged (OA) AA6016.

The hardness and strength of the alloy follows the expected trend, Reference Gottstein49 where the PA sample exhibits the highest strength and hardness and the lowest elongation to fracture and the UA sample the lowest strength but highest elongation to fracture. The OA sample shows intermediate strength and elongation to fracture values. The difference in yield strength of the PA sample to the UA and OA samples amounts to 58 MPa and 18 MPa, respectively, whereas the difference in the UTS of the PA sample to the UA and OA samples amounts 25 and 28 MPa, respectively. This trend is further evident from the ratios of ultimate tensile and yield strength, σUTS/σ0.2. These yield values of 1.41 (UA), 1.17 (PA), and 1.19 (OA), indicating comparable strain hardening of the PA and OA material but a significantly higher strain hardening in the UA material during monotonic tensile deformation.
B. Cyclic stress–strain response
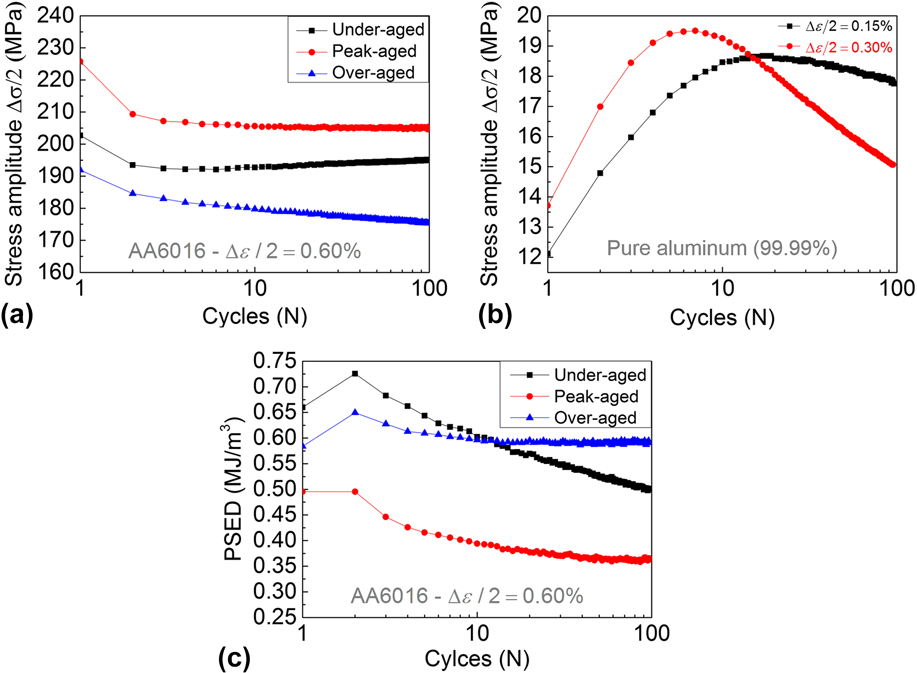
Figure 2 shows the stress response in terms of the stress amplitude-cycle number curves of the UA, PA, and OA AA6016 samples cycled for 100 cycles at a strain amplitude of 0.60% (a) and of pure Al for comparison (b). The initial plastic strain amplitudes at a total strain amplitude of 0.60% amounted to 0.406% for the under-aged material, 0.431% for the peak-aged material, and 0.446% for the over-aged material. The corresponding cyclic plastic strain energy densities of the UA, PA, and OA AA6016 samples are given in Fig. 2(c). Pure Al shows the expected cyclic stress response, consisting of an initial hardening stage followed by a softening stage. Reference Vorren and Ryum21,Reference Videm and Ryum22,Reference Nellessen, Sandlöbes and Raabe30 Although the strain amplitudes applied in this study are lower in pure Al (0.15 and 0.30%) than those in the AA6016 samples investigated (0.60%), the cyclic stress behavior of the pure Al has been reported to remain the same at higher strain amplitudes. Reference Vorren and Ryum21,Reference Videm and Ryum22,Reference Nellessen, Sandlöbes and Raabe30 In contrast, the AA6016 samples exhibit cyclic stress responses which do not differ only from that of pure Al but also depend sensitively on the respective aging conditions which determine the precipitation state. Specifically, the over-aged material exhibits cyclic strain softening during the first 100 cycles at a strain amplitude of 0.60%, however, at a lower relative softening rate than that of pure Al when the stresses are considered relative to the respective yield stresses. On the other hand, the cyclic stress curve of the peak-aged material reveals cyclic stress amplitude saturation while the under-aged material cyclically hardens. In line with the yield and flow stresses determined by monotonic tensile testing, the peak-aged material exhibits the highest cyclic stress amplitudes with the lowest plastic strain energy density. The under-aged material possesses higher cyclic stress amplitudes than those of the over-aged material although its monotonic yield stress is lower than that of the over-aged material. The cyclic plastic strain energy densities of UA, PA, and OA AA6016 follow the expected trends, where higher yield and flow stresses correspond to lower cyclic plastic strain energy distributions.
Cyclic loading response of under-aged, peak-aged, and over-aged AA6016 cycled for 100 cycles at a strain amplitude of 0.60% (a) and of pure Al cycled at a strain amplitude of 0.15 and 0.30% (b) and (c) corresponding cyclic plastic strain densities of the under-aged, peak-aged, and over-aged AA6016 samples.
C. Microstructure characterisation
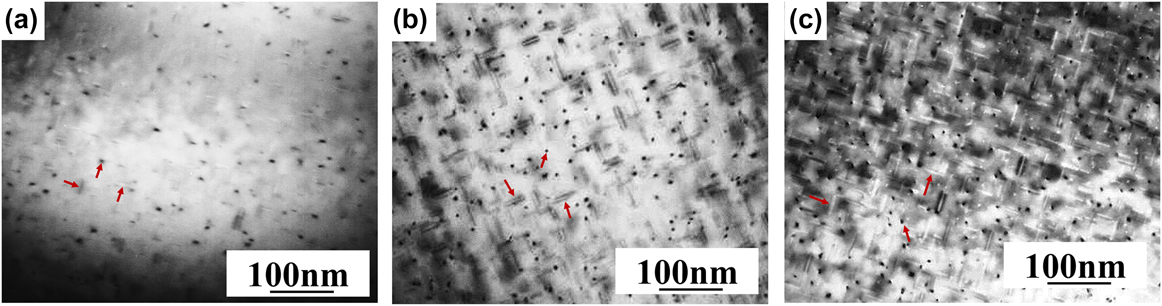
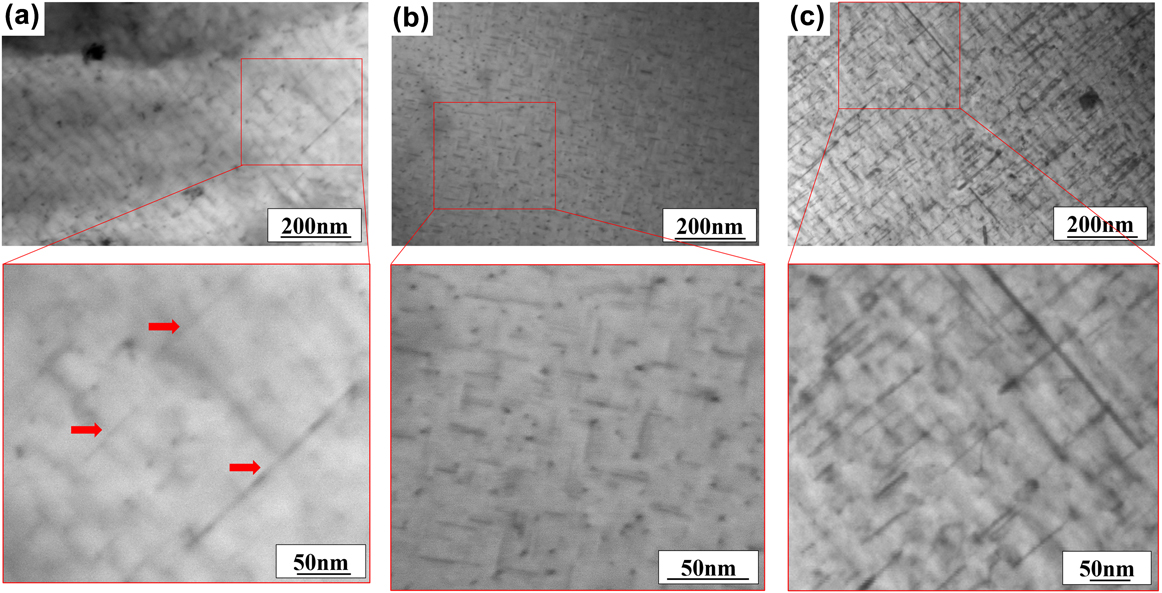
Figure 3 shows TEM bright-field micrographs of the precipitates present in the UA (a), PA (b), and OA (c) material before cyclic deformation. The TEM bright-field images were recorded with an Al zone axis orientation of B = [001].
TEM bright field micrographs showing the precipitates present in under-aged (a), peak-aged (b), and over-aged (c) AA6016. Zone axis orientation B = [001].

Needle-shaped β″ phase precipitates parallel to three equivalent 〈001〉 directions of the Al matrix, highlighted in the corresponding micrographs in Fig. 3 by red arrows, are observed in the UA sample. The approximate average length of these precipitates is 14 nm. In the PA sample, β″ and β′ precipitates parallel to all three 〈001〉 directions of the Al matrix are homogeneously distributed in the Al matrix. The approximate average length of these precipitates is 21 nm. In the OA sample, β precipitates with an approximate average length of 42 nm are observed parallel to the three equivalent 〈001〉 directions of the Al matrix.
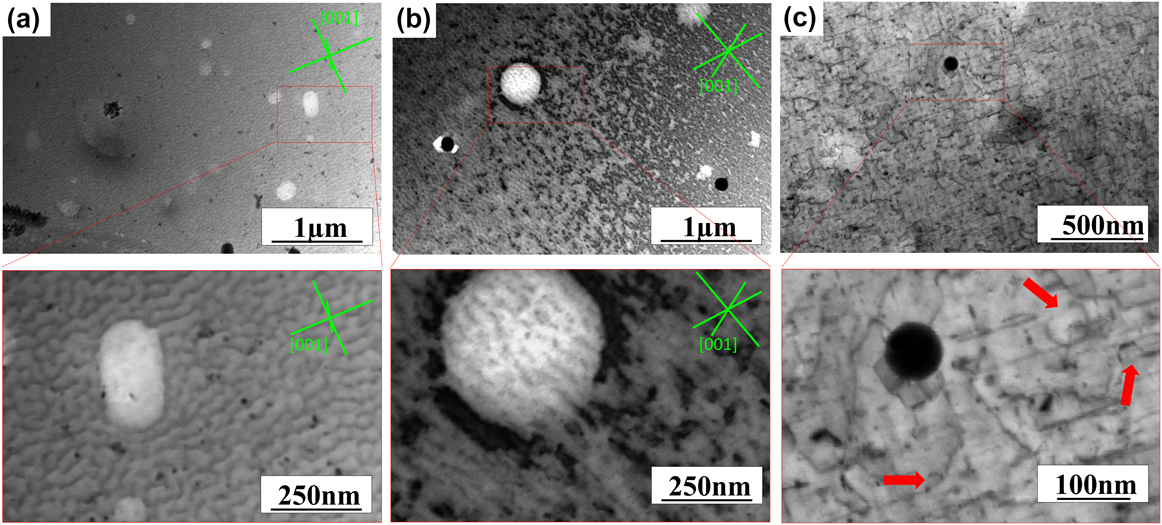
The precipitates present in UA (a), PA (b), and OA (c) AA6016 after cyclic deformation for 50 cycles at a strain amplitude of 0.60% are shown in Fig. 4. The samples were tilted to conditions with a minimal contrast from dislocations and a maximal contrast from precipitates. In the under-aged samples, a significant increase in the precipitate’s number density and size is observed, Fig. 4(a). The arrows in Fig. 4(a) highlight precipitates with a length of 100–200 nm, whereas the average precipitate length before cyclic loading was ∼14 nm. In the peak-aged and over-aged samples, no apparent change of the size and number density of precipitates is observed, Figs. 4(b) and 4(c).
STEM bright field micrographs of precipitates in under-aged (a), peak-aged (b), and over-aged (c) AA6016 cyclically deformed for 50 cycles at a strain amplitude of 0.60%.

To image the dislocations and dislocation structures present in UA (a), PA (b), and OA (c) AA6016 after cyclic deformation to 50 cycles at a strain amplitude of 0.60%, the samples were tilted to a maximum dislocation contrast, Fig. 5. In the under-aged sample, dislocations and dislocation tangles aligned with [001]Al directions are observed, Fig. 5(a). Similarly, in the peak-aged sample dislocation tangles and “prevein” structures are observed parallel to [001]Al directions, Fig. 5(b). The dislocation density is significantly higher in the peak-aged sample than that in the under-aged sample, Figs. 5(a) and 5(b). A prevalent alignment of dislocations and dislocation tangles along [001]Al directions is not typical for fatigued Al but rather an elongated dislocation cell structure aligned along the primary plane. Reference Vorren and Ryum21,Reference Videm and Ryum22,Reference Nellessen, Sandlöbes and Raabe30 Both materials, UA and PA AA6016, contain coherent and semicoherent (PA) needle- or rod-shaped precipitates, which grow along [001]Al directions. It is therefore assumed that the precipitates interact with dislocations and dislocation dipoles during cyclic deformation and facilitate the formation of dislocation structures along [001]Al directions. However, the exact mechanisms are not understood and require more detailed investigations in the future.
STEM bright field micrographs of the dislocations and dislocation structures observed in under-aged (a), peak-aged (b), and over-aged (c) AA6016 cyclically deformed for 50 cycles at a strain amplitude of 0.6%. For the under-aged and peak-aged samples [001]Al directions are inserted (green color).

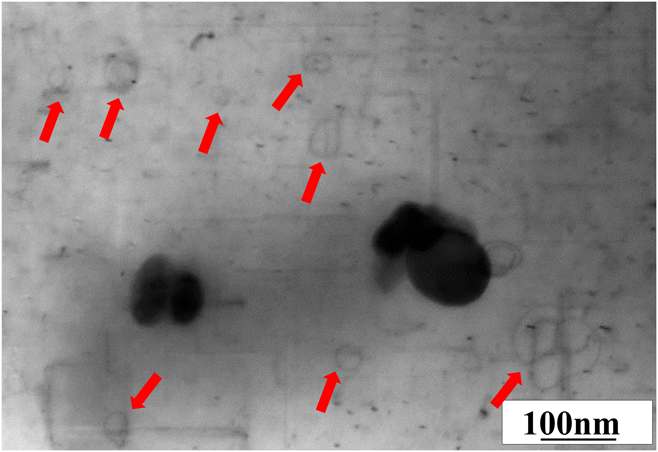
The dislocation density in the over-aged sample is lower than that in the under-aged and peak-aged samples, and no prevalent alignment of dislocations and dislocation tangles along [001]Al directions is observed, Fig. 5(c). Instead, dislocation segments which appear to be pinned at precipitates and dislocations looping around precipitates, ‘Orowan loops’, are present in the over-aged sample, Fig. 5(c). Figure 6 shows a STEM micrograph of an over-aged sample cycled in tension and compression for 50 cycles at a strain amplitude of 0.30%. Due to the lower cumulative strain, the overall dislocation density is lower than that in the over-aged sample cycled at 0.60% strain amplitude, Fig. 5(c). The red arrows in Fig. 6 highlight Orowan loops which clearly indicate the looping of dislocations around nonshearable precipitates.
STEM bright field micrograph of Orowan loops in over-aged AA6016 cyclically deformed for 50 cycles at a strain amplitude of 0.30%.

IV. DISCUSSION
To correlate the observed changes in the mechanical response and microstructures observed in the fatigue tests and electron microscopy investigations, it is essential to estimate the contributions of each hardening and/or softening mechanism. We therefore begin by drawing on known estimates of the yield strength to verify that the measured values for solute concentrations, precipitate size, density etc. give consistent values for this simplest case of the first onset of plastic deformation. Following a detailed derivation of the most relevant contributions to the overall yield strength, namely precipitation and solid solution hardening, we then proceed to the more complex and dynamic case of the cyclic properties while referring to the same kind of mechanisms and measurements to interpret our experimental results within the framework of the underlying deformation mechanisms and their microstructural origin.
A. Yield strength
The yield strength of alloys is governed by different various strengthening mechanisms and their interactions. Reference Dieter and Bacon50 In the case of age-hardened AA6016 alloys, the overall yield stress is usually considered in a first approximation as the sum of three contributions:
 $${\sigma _{\rm{y}}} = {\sigma _{{\rm{i + dis}}}} + {\sigma _{{\rm{pre}}}} + {\sigma _{{\rm{ss}}}}\quad ,$$
where σy is the yield strength, σi+dis, σpre, and σss are the contributions from the intrinsic yield strength of pure Al and the strain hardening which are difficult to separate in experiments, i.e., the remaining lattice resistance at room temperature and dislocation–dislocation interactions as cutting and bypassing stresses, precipitation hardening, and solid solution strengthening, respectively. Reference Deschamps, Livet and Brechet51–Reference Esmaeili and Lloyd55 Here, σi+dis is considered to be equal in UA, PA, and OA AA6016 at the onset of yielding.
Strain hardening, the contribution of the dislocation interactions σdis to σi+dis is proportional to the square root of the dislocation density and can be estimated according to Reference Gottstein49
 $${\sigma _{{\rm{dis}}}} = M\alpha Gb{\rho ^{1{\rm{/}}2}}\quad ,$$
where M is the Taylor factor, α is a constant, G is the shear modulus, b is the Burgers vector, and ρ is the dislocation density. Since the values for α, ρ, and the lattice resistance at room temperature are challenging to determine separately in experiments, we assume a typically found value of 10 MPa for σi+dis. Reference Deschamps and Brechet52,Reference Simar, Brechet, De Meester, Denquin and Pardoen56–Reference Myhr, Grong, Fjaer and Marioara58
1. Precipitation strengthening
Precipitates act as obstacles to dislocation motion, where σpre is proportional to the average obstacle strength, σobstacle, and inversely related to the average obstacle spacing, d. Reference Esmaeili, Lloyd and Poole59 Myhr et al. Reference Myhr, Grong and Andersen57 have reported that a valid estimate can be obtained assuming a spherical precipitate shape instead of rod-shaped precipitates.
The contribution of precipitation strengthening to the yield stress is calculated according to:
 $${\sigma _{{\rm{pre}}}} = {{M{\sigma _{{\rm{obstacle}}}}} \over {bd}}\quad ,$$
where d is the mean effective particle spacing in the slip plane of the dislocation.
If d is expressed in terms of the mean precipitate size, r av, and precipitate volume fraction, f, σpre can be rewritten as:
 $${\sigma _{{\rm{pre}}}} = {M \over {b{r_{{\rm{av}}}}}}{\left( {{{3f} \over {4\pi {E_{{\rm{dis}}}}}}} \right)^{1{\rm{/}}2}}\sigma _{{\rm{obstacle}}}^{3{\rm{/}}2}\quad ,$$
where E dis is the dislocation line energy, which is given by:
 $${E_{{\rm{dis}}}} = \beta G{b^2}\quad ,$$
where β is a constant close to 0.5.
The average obstacle strength σobstacle can be calculated on the basis of the particle size distribution Reference Mao, Bollmann, Brüggemann, Liang, Jiang, Mohles, Liu, Nie, Sanders, Jia and Cao60 :
 $${\sigma _{{\rm{obstacle}}}} = 2{E_{{\rm{dis}}}}{1 \over N}\sum\limits_i {{N_i}} \cdot \left\{ {\matrix{ 1 \cr {{{{r_i}} \mathord{\left/ {\vphantom {{{r_i}} {{r_{\rm{s}}}}}} \right. \kern-\nulldelimiterspace} {{r_{\rm{s}}}}}} \cr} } \right.\;{\rm{if}}\;\matrix{ {{r_i} \ge {r_{\rm{s}}}} \cr {{r_i} \lt {r_{\rm{s}}}} \cr} \quad ,$$
where N i is the number density of particles in size class r i , N is the total number density of particles, and r s is the shearable/nonshearable transition radius.
As the size, number density, and dispersion of precipitates are critical microstructural factors affecting their strengthening effect, a quantitative analysis of the dimensions, number densities, and volume fractions of the precipitates was performed using TEM. All TEM images were taken with the electron beam parallel to an [001] Al zone axis.
The length (L) and the cross section (s) of the precipitates were measured with the help of Image Pro-plus©. The volume fraction of precipitates (v) was calculated from the length and cross-section of the precipitates according to:
 $$\overline v = \overline s \overline L = {1 \over {{n_s}{n_L}}}\sum\limits_{n = 1}^{{n_s}} {s{}_i} \sum\limits_{n = 1}^{{n_L}} {L{}_i} \quad .$$
The number density of precipitates was determined by counting the number of precipitates per sample volume on the TEM micrographs. Here, only the precipitates lying edge-on in the zone axis direction were counted (visible as dark spots in the 〈100〉 direction normal to the image plane) to ensure distinct identification. To enhance the statistical relevance and reduce falsification of the results due to potential nonuniform particle distributions, at least ten different bright field images from at least 3 different grains were analyzed per specimen. The thickness of the area investigated was measured using the CBED method. Reference Williams and Carter48 The precipitate number density was calculated according to:
 $$p = 3{N \over V} = 3{N \over {At}}\quad ,$$
where N is the number of precipitates in the sample volume V, A is the area of the micrograph, and t is the thickness of the sample area. The factor 3 accounts for the fact that only precipitates along one of the three 〈100〉 directions were counted.
Since the length of edge-on precipitates might exceed the foil thickness, a corrected foil thickness was calculated: t′ = t + L. Reference Delmas, Casanove, Lours, Couret and Coujou61 Eq. (8) can be rewritten as:
 $$p = 3{N \over {V'}} = 3{N \over {At'}} = 3{N \over {A\left( {t + L} \right)}}\quad .$$
From the measured size and number density of precipitates, their volume fraction was calculated according to:
 $${f_{\rm{v}}} = 3{{N\overline v } \over {V'}} = p\overline v \quad .$$
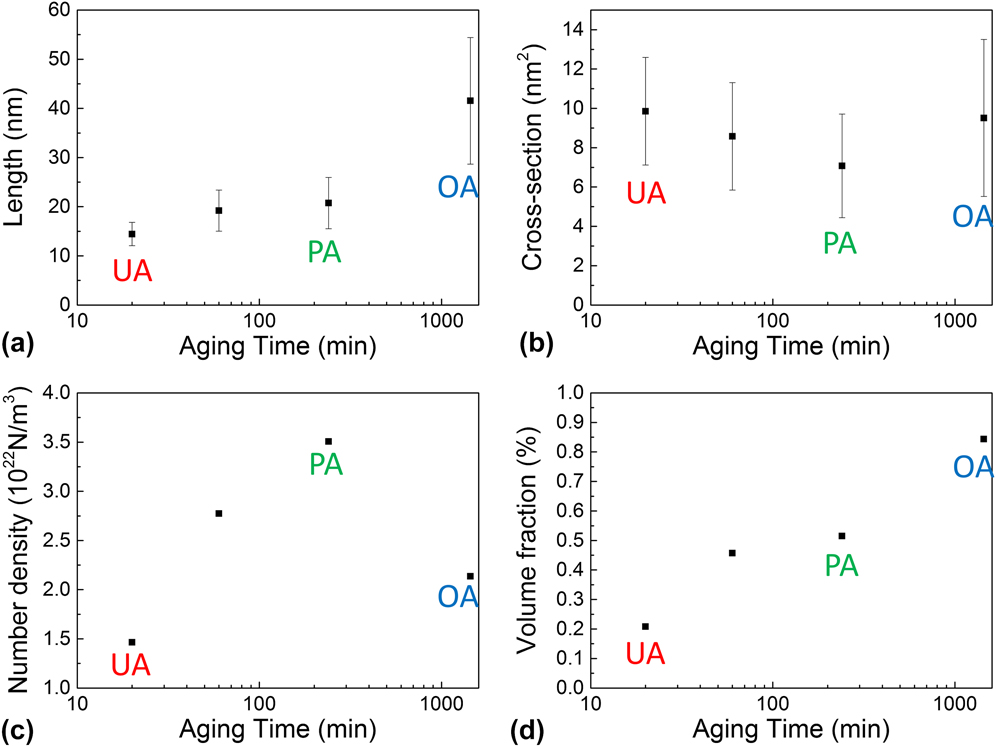
Figure 7 shows the evolution of the length (a), cross-section (b), number density (c), and volume fraction (d) of the precipitates with aging time. The precipitates length increases with increasing aging time [Fig. 7(a)], whereas the precipitates cross section stays constant within the experimental scatter [Fig. 7(b)]. The number density of precipitates increases with aging time until the peak hardness is reached and decreases during over-ageing [Fig. 7(c)]. The volume fraction of the precipitates increases with increasing aging time [Fig. 7(d)].
Evolution of the precipitate’ length (a), cross-section (b), number density (c), and volume fraction (d) with aging time in AA6016.

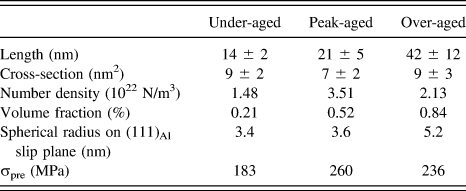
Table II lists the length, cross-section, number density, volume fraction, and spherical diameter on (111)Al slip planes in UA, PA, and OA materials. As evident from the TEM observations, the precipitates in the under-aged and peak-aged materials are shearable and nonshearable in the over-aged material, where frequent Orowan looping was observed. Therefore, the critical radius r s was assumed to be equal to that observed in the peak-aged material. The resulting precipitation strengthening contributions to the yield stress are therefore calculated using Eqs. (4)–(6) as 183 MPa in the under-aged material, 260 MPa in the peak-aged material, and 236 MPa in the over-aged material, see Table II.
Values of the precipitate length, cross-section, number density, volume fraction and corresponding spherical precipitate diameter on (111)Al slip planes used to calculate precipitation hardening in under-aged, peak-aged and over-aged AA6016.

2. Solid solution strengthening
When assuming that the contribution from each element to solid solution strengthening is additive, the solid solution hardening σss of an alloy can be expressed as Reference Simar, Brechet, De Meester, Denquin and Pardoen56,Reference Myhr, Grong and Andersen57,Reference Fribourg, Bréchet, Deschamps and Simar62 :
 $${\sigma _{{\rm{ss}}}} = \sum\limits_j {{k_j}c_j^{2{\rm{/}}3}} \quad ,$$
where c j is the concentration of a specific alloying element in solid solution and k j is the corresponding scaling parameter, which essentially reflects the obstacle strength. The concentrations of Mg and Si in the SHT material are c Mg = 0.46 wt% and c Si = 1.06 wt%, the scaling parameter for the obstacle strength of Mg and Si, k (Mg,Si) (MPa/wt%2/3), was determined by Esmaeili et al. Reference Simar, Brechet, De Meester, Denquin and Pardoen56 as 39.7 MPa/wt%2/3.
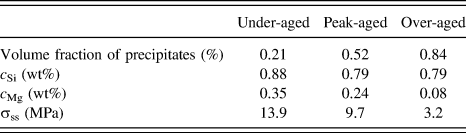
Based on the precipitate volume fraction, the precipitate stoichiometry and the SHT concentrations of Mg and Si, the solid solution concentrations of Mg and Si in the under-aged, peak-aged, and over-aged materials were calculated, Table III. Specifically, the solid solution concentrations of Mg and Si were determined by calculating the number of Mg and Si atoms in precipitates from the obtained precipitate volume fraction and stoichiometry for each sample condition. The remaining amount of Mg and Si in the solid solution was then determined by subtracting the Mg and Si atoms in precipitates from the global Mg and Si concentrations.
Values of the precipitate volume fraction, Mg concentration (c Mg) and Si concentration (c Si) used to calculate the contribution of solid solution hardening, σss, in under-aged, peak-aged and over-aged AA6016.

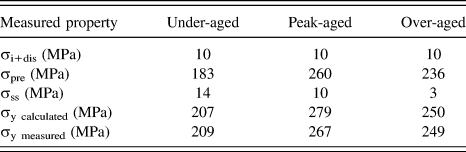
Table IV lists the calculated values of σi, σfor, σpre, and σss of the under-aged, peak-aged, and over-aged materials and the accordingly calculated yield stresses which are in good agreement to the experimentally measured yield stress values.
Calculated values of the strain hardening (σi+dis), precipitation hardening (σpre) and solid solution strengthening (σss) of the under-aged, peak-aged and over-aged material and the accordingly calculated yield stresses (σy calculated) which are in good agreement to the experimentally measured yield stress values (σy measured).

B. Cyclic hardening and softening
Similarly, the hardening or softening of the material during each half cycle is due to several different hardening and softening mechanisms for a two-phase material, namely strain hardening (σdis), solid solution hardening (σss), precipitation hardening (σpre) or/and Orowan stresses (Δσoro), and recovered stresses (σrec), for instance, by dislocation annihilation or mobilization of dislocations by back driving forces.
In an increment of strain, the following change of stress is obtained:
 $$\Delta \sigma = \Delta {\sigma _{{\rm{dis}}}} + \Delta {\sigma _{{\rm{rec}}}} + \Delta {\sigma _{{\rm{pre}}}} + \Delta {\sigma _{{\rm{ss}}}}\quad .$$
It is evident from the cyclic stress amplitude curves in Fig. 2 that dynamic changes of the precipitate and solid solution states affect the cyclic stress evolution.
Cyclic hardening is observed in under-aged AA6016 (Fig. 2) at a strain amplitude of 0.60%. This cyclic hardening is accompanied by an increase of the size and volume fraction of precipitates with cyclic deformation (Fig. 4). The dynamic precipitation and precipitate growth is assumed to be driven by the super-saturation of solute atoms in the matrix, providing a thermodynamic driving force for the precipitation of second phases. During cyclic deformation, dislocations and vacancies are generated accelerating the diffusion of solute atoms by vacancy-driven solute diffusion and pipe diffusion. Reference Simar, Brechet, De Meester, Denquin and Pardoen56,Reference Estrin and Lücke63 Dislocations might further provide preferential nucleation sites for the heterogeneous nucleation of precipitates. The observed dynamic precipitation and precipitate growth causes an increase of the precipitate volume fraction and a decrease of the solute contents with continued cyclic deformation. As evident from the calculated contributions of (i) solid solution hardening and (ii) precipitation hardening to the yield stress (Table IV), precipitation hardening holds the major stress contribution to the yield and, consequently, presumably also to the cyclic flow stresses. It is therefore concluded that dynamic precipitation nucleation and growth lead to a significant cyclic strain hardening. It is further assumed that the observed difference in monotonic and cyclic mechanical response of the UA and OA samples is caused by these dynamic precipitation reactions.
On the other hand, increasing flow stresses resulting from dynamic precipitation and precipitate growth cause a decrease of the dynamic dislocation recovery rate. Reference Deschamps, Brechet, Necker, Saimoto and Embury64 Thus, the dynamic dislocation recovery rate, β, decreases, providing an additional cyclic strain hardening contribution θdyh.
The strain-hardening rate of under-aged AA6016 can therefore be qualitatively written as. Reference Deschamps, Niewczas, Bley, Brechet, Embury, Sinq, Livet and Simon65
 $${\theta _{{\rm{UA}}}} = {\theta _0} + {\theta _{{\rm{dp}}}} + {\theta _{{\rm{dyh}}}} \gg 0\quad ,$$
where θ0 is the strain hardening contribution of the Al matrix.
In contrast, the peak-aged material exhibits a saturation of the cyclic stress amplitude when cycled at a strain amplitude of 0.60%, Fig. 2, and our TEM and STEM observations show no apparent changes of the precipitate size and volume fraction during cyclic loading, Fig. 4. It is therefore proposed that the precipitate and solid solution hardening contributions are stable during cyclic deformation to 100 cycles at 0.60% strain amplitude. The saturation of the cyclic stress amplitude indicates a balance between dislocation production and dislocation annihilation, which can be expressed as:
 $${\theta _{{\rm{PA}}}} = {{{\rm{d}}\sigma } \mathord{\left/ {\vphantom {{{\rm{d}}\sigma } {{\rm{d}}\varepsilon }}} \right. \kern-\nulldelimiterspace} {{\rm{d}}\varepsilon }} = 0\quad .$$
It is further considered that the dislocation structures in cyclically deformed pure Al develop into a loose cell structure at comparable cumulative strains, where the dislocations can easily move back and forth through the cells upon stress reversal. In the case of AA6016, Mg and Si are added as alloying elements. Mg in solid solution is known to hinder cell formation. Reference Waldron66 The observed dislocation structure, in particular the ‘prevein’-like structure in the peak-aged state, is therefore assumed to be a result of the suppression of the formation of a cell structure and the difficulty of dislocations to overcome precipitates by cutting. As a result, dislocations can move freely between the observed veins in a stress reversal. This further facilitates a steady state stress, whereas in the under-aged state, dislocations can still be stored and contribute to cyclic hardening.
The over-aged AA6016 experiences cyclic softening when cyclically deformed for 100 cycles at a strain amplitude of 0.60%, Fig. 2. Microstructure observations of fatigued OA AA6016 samples (Fig. 4) reveal no apparent changes of the precipitate dimensions and volume fraction but frequent Orowan looping of dislocations around precipitates (Figs. 5 and 6).
The presence of Orowan loops facilitates cross-slip of mobile dislocations and, hence, promotes dislocation annihilation as the critical annihilation distance for dislocations is increased by the stress field induced by nonshearable particles. Reference Simar, Brechet, De Meester, Denquin and Pardoen56,Reference Myhr, Grong, Fjaer and Marioara58
The overall low dislocation density in the cyclically deformed over-aged material (Fig. 5) is further supposed to be due to the fact that Orowan loops are not stable with respect to a reversal of stress and can rearrange or eliminate the stored dislocation structure by recovery. Hence, the material retains a low dislocation density with sufficient mobile dislocations. Further, since no dislocation cell structure is observed, it is assumed that there are still sufficient Mg atoms in solid solution to suppress the formation of a cell structure in the over-aged material.
Consequently, the dynamic dislocation recovery rate increases, causing strain softening, θdys, in the OA material which can be qualitatively expressed as:
 $${\theta _{{\rm{OA}}}} = {\theta _0} - {\theta _{{\rm{dys}}}} \ll 0\quad ,$$
with θ0 again as the strain hardening contribution of the Al matrix during steady state deformation.
C. Effect of precipitates during stress reversal
During cyclic deformation, dislocations undergo a back and forth motion due to cyclically repeated stress reversals. The cyclic deformation experiments conducted in this study started with tensile half-cycles. Therefore, forward motion of dislocations occurred in the tensile half cycles and backward motion during compressive half cycles.
Generally, solute atoms and precipitates act as obstacles to dislocation motion and are potential dislocation pinning sites. Therefore, they can cause an irreversible to-and-fro dislocation motion during fatigue wherever the obstacle is overcome in one cycle but may not allow reverse motion subsequently. Reference Mughrabi67–Reference Shyam and Milligan71
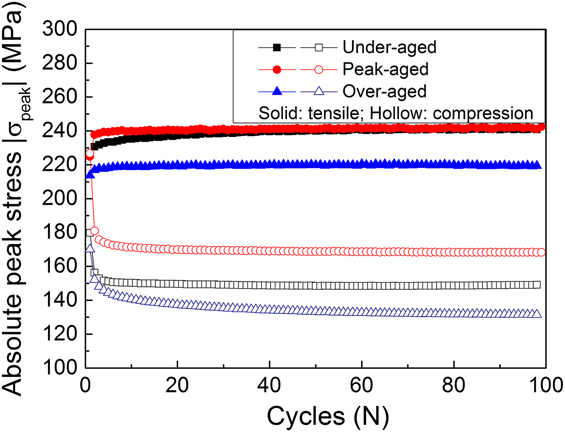
In the case of the under-aged AA6016, dynamic precipitation and growth of precipitates are observed and are assumed to induce a dynamic increase of obstacles for dislocation motion during cyclic deformation. At the same time, the solute concentration of Mg and Si is reduced. It is therefore expected that with each cycle, the stresses due to solid solution decrease whereas the stresses due to precipitation increase. As obvious from the calculation of the contributions of precipitation and solid solution hardening to the yield stress, precipitation hardening generates by far the largest contribution (Sec. IV.A). On the other hand, dislocations cutting through precipitates during their forward motion might induce softening of this particular glide plane during their subsequent backward motion resulting in a lower stresses required for the dislocation glide. The cyclic peak–stress curves indeed show larger cyclic peak stresses during the tensile half cycles than those during compressive half cycles, Fig. 8. Further, the main hardening is observed during tensile half cycles. This supports the hypothesis that, indeed, cyclic strain hardening of under-aged AA6016 is caused by dynamic precipitation and precipitate growth during tensile half cycles and that glide plane softening occurs during compressive half cycles.
Evolution of the tensile and compressive absolute cyclic peak stresses of under-aged, peak-aged and over-aged AA6016 cycled for 100 cycles at a strain amplitude of 0.60%.

Similarly, the compressive cyclic peak stresses are lower than the tensile cyclic peak stresses in the peak-aged conditions, Fig. 8. This is attributed to the shearing of coherent and semicoherent precipitates by dislocations during tensile half cycles causing glide plane softening for the backward motion of dislocations during the compressive half cycles. Moreover, the tensile cyclic peak stresses still exhibit a slight hardening in peak-aged materials apparently due to continued strain hardening. In contrast, a slight cyclic strain softening is observed during the compressive half cycles, which must be attributed to increased glide plane softening due the shearing of precipitates during tensile half cycles and increased dislocation recovery during the stress reversal.
In the over-aged material, incoherent precipitates are present. Dislocations need to cross-slip to bypass these precipitates and any Orowan loops surrounding them (Figs. 5 and 6) during tensile half cycles. During compressive half cycles, these Orowan loops are unstable and are likely to be annihilated during backward motion of the dislocations, resulting in cyclic softening during compressive half cycles. This is indeed seen in the cyclic peak–stress curves, Fig. 8: During tensile half cycles, higher cyclic peak stresses are observed than those during compressive half cycles, and the tensile half cycles reach a saturation of the cyclic peak stresses.
V. CONCLUSIONS
We have investigated the effects of the aging treatment on the mechanical response and microstructures of an AA6016 alloy during low-cycle fatigue. The following conclusions can be drawn:
-
(1) Under-aged AA6016 experiences cyclic hardening accompanied by dynamic precipitation and precipitate growth during cyclic deformation. This is consistent with a dynamic increase of the precipitation strengthening and dynamic decrease of the recovery rate due to dynamic precipitation.
-
(2) Peak-aged AA6016 shows a saturated cyclic stress behavior and the formation of a ‘prevein’-like dislocation structure aligned along [001]Al directions. In this case, solute Mg atoms and coherent and semicoherent precipitates may impede the formation of a cell structure and thus cause balanced dislocation generations and annihilation rates since dislocations can move freely between the veins upon stress reversal.
-
(3) Over-aged AA6016 exhibits cyclic softening which is assumed to be due to frequent Orowan-looping of dislocations around incoherent precipitates. Orowan-loops are instable against stress-reversal and therefore increase the dislocation annihilation rate.
-
(4) The stress reversal during cyclic deformation leads to an asymmetry of the peak flow stress during the tensile and compressive half cycles. This can be attributed to dynamic flow softening, owing to a reduced obstacle strength and dislocation recovery upon stress reversal.
Most AA6xxx parts in the automotive industry are used in an under-aged state. Therefore, the reported observation of cyclic strain hardening, dynamic precipitation, and precipitate growth in under-aged AA6016 is of significance for the performance of the material during service and may lead to new design concepts for fatigue-affected applications of AA6xxx alloys.
ACKNOWLEDGMENTS
Haichun Jiang gratefully acknowledges funding by the China Scholarship Council (CSC). The authors gratefully acknowledge the Advanced Metals and Processes Cluster (AMAP) and the participating companies Aleris Rolled Products Germany GmbH, Hydro Aluminum Rolled Products GmbH, Novelis Deutschland GmbH for supplying as cold rolled AA6016 sheet material from the AMAP Project P1.