





1. Introduction
In a context shaped by climate change and the rapid development of artificial intelligence technologies, the responsibility of designers with regard to the future impacts of the products they develop has become a critical issue. Disruptive products – understood here as technologies capable of profoundly reshaping usage patterns, markets and social practices – raise particularly acute questions in this respect. Autonomous vehicles (AVs) are a salient example: while they promise benefits in terms of safety, accessibility and efficiency, they also have the potential to generate long-term socio-economic, environmental, social and ethical consequences, both positive and negative, that remain highly uncertain at early design stages.
Faced with such uncertainty, designers often rely on imagination, assumptions and cognitive shortcuts to define product concepts. Jaruzelski, Staack & Goehle (Reference Jaruzelski, Staack and Goehle2014) note that technology-driven strategies are frequently adopted to cope with this uncertainty, leading to the development and deployment of technologies based on implicit hypotheses about future uses, since user needs and societal contexts are largely unknown at that point. Yet responsible innovation explicitly calls for anticipating potential impacts as early as possible in order to avoid undesirable consequences for individuals and society (Tatum Reference Tatum2004; Melles, de Vere & Misic Reference Melles, de Vere and Misic2011; De Saille Reference De Saille2015; Auger & Hanna Reference Auger and Hanna2019). This ambition immediately encounters the well-known Collingridge dilemma (Worthington Reference Worthington1982): when technologies are still flexible, their impacts are difficult to assess, whereas once consequences become observable, technological trajectories are often stabilised and difficult to change. Moreover, as argued by Chan (Reference Chan2018) and Parsons (Reference Parsons2015), designers are not necessarily well positioned to characterise such long-term and systemic consequences on their own.
Within this context, responsible innovation and responsible design are best understood as normative approaches to governing socio-technical change under conditions of uncertainty, rather than as a narrow ethical add-on. Stilgoe et al. (Reference Stilgoe, Owen and Macnaghten2013) conceptualise responsibility through four interrelated dimensions – anticipation, reflexivity, inclusion and responsiveness – defining it as a continuous capacity to explore consequences, question assumptions, involve affected parties and adapt innovation trajectories when concerns arise. Von Schomberg (Reference Von Schomberg, Dusseldorp and Beecroft2012) situates this perspective within European traditions of Technology Assessment and foresight, emphasising the need to embed impact assessment and forward-looking inquiry into the steering of research and innovation. At the design-research level, Value Sensitive Design (Friedman, Kahn & Borning Reference Friedman, Kahn, Borning, Zhang and Galletta2007) proposes a structured integration of stakeholder values through conceptual, empirical and technical investigations, while Nihlén et al. (Nihlen, Doorn & van de Poel Reference Nihlen, Doorn, van de Poel, van den Hoven and Poel2015) argue for treating responsibility itself as a value to be designed into socio-technical systems, with explicit attention to distributed agency and accountability. Sattlegger, Van den Hoven & Bharosa (Reference Sattlegger, Van den Hoven and Bharosa2022) further highlight that responsibility is not merely an individual virtue, but a relational and institutional property negotiated among multiple actors. Complementary contributions frame responsible design as a professional challenge, in which designers are asked to answer for consequences that are diffuse in time, mediated by infrastructures and organisations and only partially knowable at the moment of design (Tatum Reference Tatum2004; Melles et al. Reference Melles, de Vere and Misic2011). De Saille (Reference De Saille2015) additionally shows that responsibility is also shaped at the policy level, through institutional frameworks that redefine what counts as legitimate innovation and which impacts become governable.
A key implication of this literature is that responsibility cannot be assumed to arise spontaneously from designers’ good intentions. Ethical reasoning is subject to systematic cognitive limitations. Chugh, Bazerman & Banaji (Reference Chugh, Bazerman, Banaji, Moore, Cain, Loewenstein and Bazerman2005) describe bounded ethicality as a source of ethical blind spots even among well-intentioned professionals, while Tenbrunsel and Messick (Reference Tenbrunsel and Messick2004) explain ethical fading, whereby moral dimensions become obscured when decisions are framed in technical, organisational or economic terms. Kunda (Reference Kunda1990) further shows how motivated reasoning leads individuals to selectively interpret information in ways that protect preferred conclusions. In design contexts, these mechanisms may result in the rationalisation, minimisation or denial of inconvenient impacts that threaten project objectives, timelines or organisational narratives. Consequently, responsible design frameworks insist on process-level safeguards – such as reflexivity, inclusion and explicit articulation of values – rather than relying solely on individual moral competence (Friedman, Kahn & Borning Reference Friedman, Kahn, Borning, Zhang and Galletta2007; Stilgoe, Owen & Macnaghten Reference Stilgoe, Owen and Macnaghten2013; Sattlegger et al. Reference Sattlegger, Van den Hoven and Bharosa2022).
These difficulties are exacerbated in the case of disruptive technologies. Early design phases are characterised by deep uncertainty regarding future contexts of use, adoption dynamics and indirect societal effects. As captured by the Collingridge dilemma (Worthington Reference Worthington1982), this structural asymmetry makes anticipation particularly challenging. While responsible innovation and Technology Assessment approaches elevate anticipation and responsiveness as core principles (Von Schomberg Reference Von Schomberg, Dusseldorp and Beecroft2012; Stilgoe et al. Reference Stilgoe, Owen and Macnaghten2013), they do not claim to predict impacts; rather, they aim to institutionalise earlier and broader engagement with possible consequences. Cognitive limitations (Kunda Reference Kunda1990; Tenbrunsel & Messick Reference Tenbrunsel and Messick2004; Chugh, Bazerman & Banaji Reference Chugh, Bazerman, Banaji, Moore, Cain, Loewenstein and Bazerman2005) further explain why designers and organisations may resist or deny medium- and long-term impacts even when confronted with evidence, especially when acknowledging such impacts implies responsibility, redesign costs or strategic delays.
Despite this need, existing design methods provide limited support for responsible design of disruptive products such as AVs. Numerous ideation methods – brainstorming techniques (Bila-Deroussy Reference Bila-Deroussy2015), stimulation techniques (Al Maghraoui et al. Reference Al Maghraoui, Vallet, Puchinger and Yannou2019), TRIZ (Teopия peшeния изoбpeтaтeльcкиx зaдaч, Teoriya Resheniya Izobretatelskikh Zadach; Theory of Inventive Problem Solving) (Savransky Reference Savransky2000), design thinking (Dorst Reference Dorst2011; Razzouk & Shute Reference Razzouk and Shute2012), SWOT analysis (Ifediora, Idoko & Nzekwe Reference Ifediora, Idoko and Nzekwe2014), Substitute, Combine, Adapt, Modify, Put to another use, Eliminate, Reverse/Rearrange (SCAMPER) (Serrat Reference Serrat, Serrat and Serrat2017) or the six thinking hats (de Bono Reference de Bono2017) – have demonstrated their ability to generate a large number and diversity of ideas (Hernandez, Shah & Smith Reference Hernandez, Shah and Smith2010; Hernandez, Schmidt & Okudan Reference Hernandez, Schmidt and Okudan2013; Daly et al. Reference Daly, Seifert, Yilmaz and Gonzalez2016). However, very few allow for the direct generation or early evaluation of responsible ideas. While eco-innovation methods address environmental aspects (Tyl et al. Reference Tyl, Legardeur, Millet and Vallet2014), ethical and social dimensions are rarely integrated from the outset. This limitation is particularly problematic for AVs, where user acceptance depends on complex cognitive and emotional factors related to usage contexts, with safety being paramount (Yoganathan & Osburg Reference Yoganathan and Osburg2024). Designers may thus promote seemingly innovative concepts without being able to project their integration into users’ daily lives over long periods, increasing the risk of committing to trajectories with irreversible negative consequences.
Conversely, impact assessment and technology assessment methods aim precisely at anticipating long-term impacts (Coates Reference Coates1974; Arnstein Reference Arnstein1977; Ported Reference Ported1995; Becker Reference Becker2001; Banta Reference Banta2009; De Jesus Reference De Jesus2009; Morgan Reference Morgan2012). However, these approaches are often difficult to implement for designers, require specialised expertise and typically presuppose a well-defined concept. Other approaches seek to make design processes more ethical without guaranteeing the ethicality of outcomes (d’Anjou Reference d’Anjou2011), while strategic foresight methods (Godet & Durance Reference Godet and Durance2011) and expert-based approaches may focus on limited categories of impacts (Henchey Reference Henchey1978). As a result, a methodological gap persists: ideation and agile methods support creativity and rapid iteration but poorly address long-term responsibility, whereas assessment methods support anticipation but intervene too late or remain inaccessible at early design stages.
This paper focuses on AVs as a paradigmatic case of a disruptive product whose long-term implications remain uncertain. An AV is defined here as a road vehicle capable of transporting passengers and operating without human intervention (State of California 2022). The scope of the study is limited to taxi, car and small shuttle vehicles operating at automation levels 4 and 5, as defined by the SAE J3016 standard (SAE International 2021), and considers both private and shared modes of use. As illustrated by Townsend (Reference Townsend2020), AVs may generate cascading impacts across multiple time scales, from short-term effects such as job losses and market concentration to long-term transformations including urban sprawl, erosion of human agency and algorithmic governance.
To address the limitations of existing methods, the AutoVision design platform was developed by the authors for designers working on AVs. By combining elements of ideation methods, agile approaches and impact assessment, AutoVision aims to help designers anticipate long-term socio-economic, environmental, social and ethical impacts of disruptive products such as AVs. The platform has been described in detail in previous work (Lecomte et al. Reference Lecomte, Yannou, Cahen, Thibaud and Étienne2024, Reference Lecomte, Yannou, Cahen, Thibaud and Etienne2026). However, the present paper is the first to present AutoVision as an integrated design platform, to describe its complete operating logic and to evaluate its performance in comparison with professional designers.
AutoVision does not claim predictive certainty. Rather, it functions as an anticipatory and traceable decision-support artefact intended to make dispersed evidence and expert reasoning actionable during early concept design. In this paper, the ability to anticipate such long-term impacts and integrate them into design decision-making is considered a core component of responsible design.
The objective of this article is therefore twofold: first, to present and empirically evaluate AutoVision as a novel Design Science artefact for AV concept generation and evaluation; second, to mobilise the platform in an exploratory experimental setting designed to examine the difficulties encountered by automotive designers when attempting to take long-term impacts into account.
2. Contributions of the paper
This paper contributes to the Design Science community in four ways:
-
• Artefact contribution: it introduces AutoVision as a new anticipatory design platform integrating ideation support with long-term impact assessment.
-
• Methodological contribution: it proposes an experimental protocol comparing designer judgments with transparent evidence-supported platform evaluations.
-
• Empirical contribution: it shows that an AutoVision-generated AV concept can be perceived as at least as convincing as concepts generated by experienced designers.
-
• Theoretical contribution: it provides evidence of cognitive limitations affecting designers’ ability to anticipate long-term socioeconomic, environmental, social and ethical impacts, thereby enriching research on design cognition and responsible design
The remainder of the paper is structured as follows. Section 2 presents the principles, structure and operating modes of the AutoVision design platform, drawing on previously published work (Lecomte et al. Reference Lecomte, Yannou, Cahen, Thibaud and Étienne2024, Reference Lecomte, Yannou, Cahen, Thibaud and Etienne2026) and associated supplementary materials. Section 3 describes the experimental design. Section 4 presents the results. Section 5 discusses their implications for Design Science, responsible innovation and AV design.
3. AutoVision design platform
3.1. Platform structure
The AutoVision platform is built on two original models:
-
- the Study–Method–Impact (SMI) model, which synthesises scientific literature to anticipate quantitative long-term socio-economic and environmental impacts (Lecomte et al. Reference Lecomte, Yannou, Cahen, Thibaud and Etienne2026),
-
- and the Representation–Usage–Impact (RUI) model, which combines expert knowledge from sociology and other fields to anticipate qualitative social impacts (Lecomte et al. Reference Lecomte, Yannou, Cahen, Thibaud and Étienne2024). Experts are sociologists, urban planners, medical doctors, psychologists, geographers and lawyers.
A comparative summary of the models is presented in Table 1. AutoVision is a stimulation platform that allows designers to imagine concepts that are more responsible, but it is not a prescriptive tool as the time scales are obviously too high to predict impacts with certainty. The platform is based on scientific studies and expert opinions. The quality of the platform’s results cannot be verified due to the long-term nature of the anticipated impacts (approximately 30 years in the future according to ERTRAC 2019).
Summary of the two knowledge models used by the AutoVision design platform

Table 1. Long description
The table consists of six columns and two data rows.
Column headers from left to right are: Model, Impact type, Knowledge source, Input characteristics, Examples of impact, and Publications.
Row 1:
- Model: S M I (Study–Method–Impact).
- Impact type: Socio-economic and environmental (quantitative).
- Knowledge source: Scientific studies.
- Input characteristics: Validity domain (e.g. mode of use, type of infrastructure, geographical area of deployment).
- Examples of impact: Average increase in the number of kilometres travelled by 20%; Average decrease in C O sub 2 emissions by 5%.
- Publications: Lecomte et al. (2026).
Row 2:
- Model: R U I (Representation–Usage–Impact).
- Impact type: Social (qualitative).
- Knowledge source: Expert elicitation.
- Input characteristics: Usage made possible by the A V (e.g. sleeping in the vehicle during the journey).
- Examples of impact: Increased dependence on smartphones; Decreased health status of users.
- Publications: Lecomte et al. (2024).
The platform operationalises these two knowledge models – SMI and RUI – through a network of 14 interconnected databases illustrated in Figure 1. This relational architecture is not merely a data-storage solution: it preserves the traceability of the links between design characteristics, knowledge sources, validity conditions and anticipated impacts, thereby allowing designers to inspect and contest the reasoning underlying each recommendation.
Objects used by AutoVision platform are spread across 14 databases.

Figure 1. Long description
The flowchart is divided into two horizontal chains connected by a central R V node.
Upper Chain (R U I model in gold):
From left to right, the nodes are REPRESENTATION (grid icon), EXTRACTION (upload icon), USAGE (hand icon), IMPACT (curved arrow icon), and IMPACT INDICATOR (gauge icon). Above IMPACT is an EXPERT node (I D card icon). Above IMPACT INDICATOR is a THEME node (pentagon icon).
Lower Chain (S M I model in green):
Starting from the R V node on the left, a dashed line connects to VALIDITY DOMAINS (check box icon). This leads to IMPACT (curved arrow icon) and IMPACT INDICATOR (gauge icon). Below the green IMPACT node are two branches leading to STUDY (document icon) and METHOD (stacked layers icon). Below the green IMPACT INDICATOR is a THEME node (card stack icon).
Legend (Bottom-Right):
- Dashed gold line: Link exclusive to AutoVision tool.
- Solid gold line: Link of R U I and S M I models.
- Gold dot: R U I model (Representation-Usage-Impact).
- Green dot: S M I model (Study-Method-Impact).
- Solid grey square: Main objects.
- Outlined square: Secondary objects.
Detailed database attributes are reported in Supplementary Material 5. At the platform level, their integration enables two complementary forms of reasoning: the RUI model broadens the range of socially plausible consequences considered, whereas the SMI model qualifies impact claims through published evidence and explicit validity conditions.
3.2. Epistemological assumptions
Both the RUI and the SMI models are grounded in a shared constructivist and pragmatist epistemology, explicitly designed to address the profound uncertainty that characterises the long-term impacts of disruptive technologies. At their core, both models reject predictive positivism and technological determinism. They assume that impacts are not intrinsic properties of artefacts, but emerge from situated interactions between technologies, usages, social contexts and interpretative frameworks. Consequently, knowledge about impacts is considered partial, provisional and contingent, and its value lies not in forecasting accuracy but in its capacity to support responsible action in the present.
A central common assumption is that anticipation is possible without prediction. Both models acknowledge that long-term impacts cannot be empirically verified ex ante, yet they assert that credible forms of anticipation can be constructed through structured mediation. In the RUI model, this mediation relies primarily on expert judgment in the social sciences, mobilised through representations and usage abstractions that enable projection into plausible futures. In the SMI model, anticipation is grounded in the systematic aggregation and contextualisation of existing scientific studies, making explicit their methods, assumptions and domains of validity. In both cases, uncertainty is not treated as a flaw to be eliminated, but as an intrinsic feature that must be made visible, structured and navigable.
Another strong epistemological convergence lies in their action-oriented stance toward knowledge. Both models assume that knowledge is produced for use, not for theoretical closure. They deliberately favour transparency, traceability and accessibility over causal exhaustiveness, and conceive models as epistemic mediators between science and design rather than as explanatory theories of social change. Making impacts visible is itself understood as a normative act, intended to influence design choices and responsibilities.
The two models differ mainly in the sources and nature of knowledge they mobilise. RUI privileges qualitative, interpretive and forward-looking knowledge elicited from experts, using representations as cognitive catalysts for imagination and sense-making. SMI, by contrast, relies on secondary scientific evidence and adopts a more evidence-aggregative logic, explicitly qualifying the robustness and limitations of published results. Together, they form a coherent epistemological ensemble: RUI explores what could happen, while SMI structures what is already known, both contributing complementary forms of anticipatory knowledge for responsible design.
These epistemological principles are operationalised through two complementary reasoning modes. The Advisor translates desired impact directions into candidate design characteristics, whereas the Impact Guesser translates proposed design characteristics into traceable impact pathways. Their combination forms an iterative anticipatory-design cycle linking normative intention, concept generation, evidence-supported evaluation and concept revision.
3.3. Typical design study with AutoVision
3.3.1. Principle
AutoVision supports two complementary design activities: generating concept directions from an impact-oriented strategy and evaluating the plausible consequences of a proposed concept. The Advisor and Impact Guesser can be used sequentially and iteratively (Figure 2). The Advisor supports divergence by opening concept directions consistent with explicit impact objectives; the Impact Guesser supports convergence and reflexivity by confronting the resulting concepts with documented impact pathways. Its output can then trigger a new generation or revision cycle.
Example of integrating AutoVision into a design process.

Figure 2. Long description
The flowchart moves from left to right through four main stages.
1. Start. A dashed arrow points to the first stage labeled Start: Wanting to create an autonomous vehicle. Below this is a light orange box numbered 1.1.1 with a lightbulb icon, labeled Defining a strategy social, economic, and environmental impacts.
2. Advisor Stage. A clipboard icon leads into a larger orange box numbered 1.1.2. Above it, text reads Using the Advisor to get concept ideas. Inside, a cone-shaped diagram points to a cluster of dots, followed by a black arrow. Below this box is the label Defining a first concept.
3. Impact Guesser Stage. A black dot leads into a smaller orange box numbered 1.1.3. Above it, text reads Using the Impact Guesser to refine the concept. Inside is another cone-shaped diagram with an orange arrow. Below this box is the label Iterative loops, with a return arrow pointing back to the start of this stage.
4. Next Phases. A final black dot leads to a dashed arrow pointing right, labeled Next design phases.
The first Advisor mode is designed to prompt designers to generate responsible AV concepts expressed in terms of usages to promote, usages to avoid and contexts of use to prioritise, starting from a given company strategy. It seeks to fill a gap in existing ideation methods by enabling the direct formulation of responsible usage profiles. More specifically, the Advisor mode identifies AV characteristics – understood here as services or usages – to be encouraged or discouraged on the basis of a set of long-term consequences that designers wish to achieve or avoid (referred to as impacts), such as reducing greenhouse gas emissions or improving users’ health conditions. This ability of the platform to suggest a wide range of design characteristics corresponds to what Le Masson, Hatchuel, & Weil (Reference Le Masson, Hatchuel and Weil2016) describe as generativity.
From a design-science perspective, the Advisor operationalises responsibility as a generative design constraint. It converts abstract normative objectives – such as reducing emissions or protecting health – into actionable usages and deployment conditions that can be manipulated during concept generation. It therefore connects the impact space to the solution space at a stage when design freedom remains high.
The second Impact Guesser mode enables appraising the most plausible impacts of a given AV concept. Together, the two modes implement complementary directions of impact reasoning: an impact-to-design translation in the Advisor and a design-to-impact translation in the Impact Guesser, these two modes use a mechanism similar to case-based reasoning (Kolodner Reference Kolodner1992).
To better understand how the platform works, the following subsections provide an example.
3.3.2. Strategy
The first step for designers using the platform is to define a strategy to follow. In AutoVision, a strategy is not merely an input list but an explicit representation of the impact priorities against which concepts will be generated and evaluated. It makes normative commitments visible and allows different stakeholders – such as manufacturers or territorial authorities – to formulate different desirable impact directions.
A strategy can include a list of impacts to be avoided or prioritised, such as reducing energy consumption or enhancing onboard safety. Supplementary Material 1 offers a comprehensive example of a strategy based on the three strategic topics of Figure 3.
Example of three strategic topics of an automotive group from which a strategy can be defined.

Figure 3. Long description
The diagram consists of three stacked horizontal rectangular panels with rounded corners.
1. The top panel is orange and titled ETHICAL RESPONSIBILITY. It features an icon of a person and a heart. The text states: Respect human rights, provide accessible transportation, promote good health and well-being, foster social and family ties.
2. The middle panel is green and titled ENVIRONMENTAL RESPONSIBILITY. It features an icon of a globe and a leaf. The text states: Reduce emissions and energy consumption. Limit the footprint of infrastructure (parking lots, roads, traffic...).
3. The bottom panel is red and titled SECURITY. It features an icon of a warning triangle with an exclamation mark and wavy lines below it. The text states: Ensure the safety of individuals.
3.3.3. Generation of a concept with the Advisor
Based on a strategy, the Advisor provides a list of usages to promote and avoid, as well as validity domains to promote or avoid (for simplicity, only the validity domains related to the mode of use, such as private or shared, will be discussed as examples). The Advisor has given 12 usages to promote, 16 usages to avoid, 2 modes of use to promote and 1 mode of use to avoid (Supplementary Material 2).
Designers can then use these suggestions to define a concept. In this example, six usages to promote and eight usages to avoid were selected. Concept X thus generated is visible in Supplementary Material 3, and an excerpt is shown in Figure 4.
Extract of Concept X (full concept available in Supplementary Material 3).

Figure 4. Long description
The layout is divided into three main sections.
On the left under the heading Mode of use are two vertical panels.
- The top panel shows a person holding a smartphone with a yellow taxi in the background, labeled Shared taxi.
- The bottom panel shows an autonomous shuttle on a road, labeled Shared carsharing.
In the top-right under the heading Usages to promote are two horizontal panels.
- The first shows three people sitting around a table inside a vehicle with the text: Passengers engage in collective activities during transportation.
- The second shows a person using exercise equipment inside a vehicle with the text: The passenger exercises during transportation.
In the bottom-right under the heading Usages to avoid are two horizontal panels.
- The first shows a young child sitting alone in a high-tech vehicle cabin with the text: The passenger is a minor and travels long distances.
- The second shows a car engulfed in flames on a road with the text: An outsider kills someone by taking control of the vehicle.
Each image panel is accompanied by grey horizontal lines representing placeholder text.
Overall, the Advisor produced a broader set of usages and validity domains than those ultimately retained by the designers. The purpose of this output is not to prescribe a concept, but to enlarge the designers’ exploration space while keeping each suggestion connected to the impact-oriented strategy.
3.3.4. Evaluation of a concept with the Impact Guesser
Based on the characteristics of an AV (e.g., those of Concept X presented earlier), the Impact Guesser can identify potential long-term social, socio-economic, and environmental impacts. These impacts are categorised into 19 themes (see Supplementary Material 3). Furthermore, the Impact Guesser can assign a score to each of these 19 themes. A positive score indicates that the impacts in this theme will be generally favourable to the strategy, while a negative score indicates that these impacts will be unfavourable. For example, a score of −75% on the “environment” theme indicates that the concept is contrary to the environmental objective of the strategy and therefore has the potential to generate more CO2 emissions or consume more energy. The thematic score should be interpreted as a synthetic indicator of alignment between the concept’s documented impact pathways and the selected strategy. It is neither a probability of occurrence nor a validated forecast of future outcomes.
The Impact Guesser does not predict the future consequences of a concept. It externalises impact reasoning by mapping the concept’s usages and validity domains onto impact pathways documented in the SMI and RUI knowledge bases. From a design-science perspective, it acts as a reflexive evaluation device: it exposes consequences that may remain outside designers’ immediate expertise and makes the supporting evidence, assumptions and expert rationales inspectable.
3.4. Advisor operating mode
The Advisor provides responsible creative suggestions to designers (Howard, Culley & Dekoninck Reference Howard, Culley and Dekoninck2011), responsible because they are based on (i) the RUI relations collected from the interrogation of sociology – and related fields – experts, for social impacts and (ii) the SMI relations collected from scientific studies for socio-economic and environmental impacts.
Users can choose trends for different impact indicators and the platform will generate lists of recommended and to-be-avoided usages and validity domains (see Figure 5 and Table 2).
Advisor mode logic diagram.

Impact-to-design transformation performed by the Advisor mode

Table 2. Long description
The table consists of four columns: Stage, Operational content, Illustrative example, and Design-science function.
* Row 1: Normative framing (input). Operational content describes designers selecting social, socio-economic, and environmental impact indicators with specific directions (increase or decrease) to form a design strategy. Illustrative examples include Stress down, C O sub 2 emissions down, and Health condition up. The function is to make normative objectives and value priorities explicit.
* Row 2: Impact-to-design reasoning. Operational content explains how the Advisor traces impact directions through R U I and S M I relations to identify consistent or inconsistent usages and validity domains. Illustrative examples note that R U I relations connect social impacts to usages, while S M I relations connect socio-economic and environmental impacts to validity domains. The function is to translate abstract objectives into design-relevant knowledge while preserving traceability.
* Row 3: Actionable design directions (output). Operational content states the Advisor provides usages and validity domains to promote or avoid as recommendations rather than prescriptions. Illustrative examples include promoting passengers exercising during transport and shared modes of use. The function is to make responsibility actionable during early concept generation while preserving designer agency.
Within the Advisor, RUI relations mobilise socially situated expert knowledge to connect possible usages with social consequences that designers may not spontaneously consider (Figure 6). They thereby broaden responsible concept generation beyond the designers’ immediate experience and disciplinary expertise.
Some databases and links of the Representation–Usage–Impact (RUI) model.

Figure 6. Long description
The flowchart consists of three vertical data tables connected by relational lines.
1. The leftmost table is titled U S A G E. It contains fields for Type, Subject, Action, Context, Impact, and Extraction. A dashed line points to Extraction.
2. The central table is titled I M P A C T. It contains fields for Usage, Indicator, Expert, Date, Trend, Change, Subject, Intensity, Depth, Occurrence, Certainty, and Conditions.
3. The rightmost table is titled I N D I C A T O R. It contains fields for Theme, Name, Description, and Impact.
Relational lines connect the tables. A line between U S A G E and I M P A C T is labeled with N at the top and 1 at the bottom. A line between I M P A C T and I N D I C A T O R is labeled with N at the top and 1 at the bottom.
A legend at the bottom defines the icons used next to field names.
- Four horizontal lines represent Text.
- A calendar icon represents Date.
- A circle with a downward arrow represents Simple choice.
- Three horizontal lines with dots represent Multiple choice.
- A chain link icon represents Database link.
- A hash symbol represents Number (1-3).
Complementarily, SMI relations connect validity domains – such as private ownership or deployment in Europe – with quantitative socio-economic and environmental impacts established in scientific studies (Figure 7). Within the Advisor, they qualify design recommendations through published evidence and explicit domains of validity, thereby limiting the transfer of impact claims beyond the contexts in which they were established.
Some databases and links of the Study–Method–Impact (SMI) model.

Figure 7. Long description
A database schema diagram with three main tables arranged horizontally.
1. Validity Domains (Left): Contains fields for Name (text), Description (text), and Impact (database link). It connects to the central table with a 1 to N relationship.
2. Impact (Center): The central hub containing links to Study, Method, Indicator, and Validity domains. It also includes fields for Trend (simple choice), Certainty (number), Value (number), and Infos (text). It connects to the right table with an N to 1 relationship.
3. Indicator (Right): Contains fields for Theme (multiple choice), Name (text), Description (text), and Impact (database link).
A legend at the bottom defines the icons used in the tables:
* Four horizontal lines represent Text.
* A downward arrow in a circle represents Simple choice.
* Three horizontal lines with dots represent Multiple choice.
* A chain link symbol represents Database link.
* A hash symbol represents Number.
For each recommendation, three complementary indicators (see Appendix A) qualify the underlying knowledge: majority influence indicates direction, the number of impacts indicates evidence coverage and the conflict coefficient indicates disagreement among sources. Their joint interpretation prevents a directional recommendation from being read independently of the amount and consistency of the available knowledge.
The combination of RUI and SMI relations prevents responsible ideation from relying exclusively on either speculative expert judgement or decontextualised quantitative evidence. Detailed recommendation mechanisms are provided in Appendices A and B, while the complete SMI model is presented in Lecomte et al. (Reference Lecomte, Yannou, Cahen, Thibaud and Etienne2026).
In addition to the lists of usages and validity domains, users can also access the links between a usage/validity domain and an impact. Traceability is treated here as a design requirement rather than an interface convenience. For each recommendation, designers can inspect the expert rationale or scientific study supporting the relationship between a design characteristic and an impact. This enables recommendations to be questioned, contextualised or rejected rather than accepted as opaque prescriptions.
Another capability of the Advisor is to display the relevant concepts that closely align with the user’s chosen strategy. For instance, if the user selects a preference for a vehicle with low energy consumption, the Advisor may suggest an existing concept of an ultra-light AV (Figure 8). Retrieving related concepts can support analogical reasoning by exposing designers to precedents consistent with the selected strategy. However, because examples may also induce fixation (Linsey et al. Reference Linsey, Tseng, Fu, Cagan, Wood and Schunn2010; Moreno et al. Reference Moreno, Blessing, Yang, Hernández and Wood2016), these representations should be treated as stimuli to be challenged and recombined rather than as preferred solutions.
Alternative use of the advisor mode to display the closest representations to a strategy.

4. Experiment
4.1. Design of experiment
As previously indicated, the AutoVision platform was developed to support designers in anticipating the long-term socio-economic, environmental, social and ethical impacts of disruptive products such as AVs. We conceptualise this capacity to foresee and integrate long-term impacts into design decisions as responsible design.
The objective of this article is to mobilise the AutoVision platform to construct an experimental and methodological framework capable of revealing the challenges encountered by automotive designers when attempting to account for long-term impacts in the context of responsible AV design. More specifically, the study aims (1) to assess the extent to which designers may exhibit insufficiently responsible decision-making when developing AV concepts and (2) to characterise their cognitive limitations, forms of resistance or attitudes of denial regarding long-term considerations.
Because this framework is grounded in the AutoVision platform, the first part of the paper was devoted to outlining its principles, structure and operational mechanisms. The second part – constituting the core contribution – focuses on the design of the empirical study intended to uncover the phenomena described above. The experiment was constructed to address three research questions by engaging a group of carefully selected designers tasked with making decisions about long-term AV concepts within an automotive company. The three hypotheses are as follows:
H1. A concept generated through the AutoVision Advisor mode is perceived by designers as at least as convincing as a concept they would have developed themselves. Here, ‘convincing’ refers to the perceived alignment between a concept and an impact-oriented strategy, as judged by other designers. This hypothesis examines whether the Advisor can generate a concept that professionals perceive as aligned with this strategy; it does not test the correctness of the anticipated impacts.
H2. Designers’ assessments of the long-term responsibility of autonomous vehicle concepts will diverge from AutoVision’s evidence-supported evaluations, particularly for indirect, systemic, and long-term impacts.
H3. AutoVision’s traceable expert rationales will cover a broader and more nuanced range of consequences than designers’ justifications.
To address the first hypothesis, it is necessary to compare how persuasive a concept generated using the Advisor is for designers in comparison to concepts envisioned by these designers. To examine the second hypothesis, participant evaluations are compared with AutoVision’s evidence-supported evaluations, not as a test of ground-truth accuracy but as an analysis of divergence between two forms of judgment. To test the third hypothesis, it is necessary to qualitatively compare the justifications of the participants with the justifications of experts (Impact Guesser). The experiment was therefore built around these three prerequisites, as shown in Figure 9.
The experiment’s design to test the three hypotheses.

Figure 9. Long description
The flowchart is organized into four columns.
1. Strategy: On the left, a card contains three icons (person with heart, globe with leaf, and warning sign) next to text lines. To its right, two numbered points are listed: 1. The voice of automotive designers, and 2. The voice of impact experts and scientific studies.
2. Design: This column features four concept cards. The top three are labeled Concept A, Concept B, and Concept C, each associated with a numbered person icon (1, 2, and 3). Below a dashed horizontal line is a fourth card in orange labeled Advisor Concept X.
3. Evaluation: This column shows how the concepts are reviewed. Person 1 evaluates B, C, and X. Person 2 evaluates A, C, and X. Person 3 evaluates A, B, and X. Below the dashed line, an Impact Guesser evaluates A, B, C, and X.
4. Outcomes: On the far right, brackets connect the evaluation results to three hypotheses.
- h 1: Concept X is convincing, linked to the top three evaluations.
- h 2: Designer’s knowledge is limited, linked by a dashed line between the upper and lower sections.
- h 3: Expert’s verbatim can advantageously justify a concept, linked to the Impact Guesser evaluation.
The first 20 minutes are spent explaining the context and details to the participants (see Supplementary Material 7).
The experiment involved eight senior automotive designers from a major international automotive group. Although this number may appear limited, these participants represent the organisation’s most experienced and dedicated experts in the long-term design of AV concepts. It would not have been possible to recruit many more. They are divided into three groups of two to three people, and each group must come up with a preliminary concept of AVs (they get 30 minutes). This concept should include a list of desired and undesired usages, as well as one or more modes of use (you can see an example in Figure 4). It must align with the three strategic topics presented in Section 3.3.2, which are related to the automotive company’s public communication where the participants are employed. A list of 30 usages and 3 modes of use is provided to each group. The groups are instructed to choose a minimum of five usages to promote and five usages to avoid. They are also instructed to select one or more modes of use among “private,” “shared: ridesharing” and “shared: carsharing.” For each selection, they are encouraged to provide at least one justification. The concepts generated are labelled as A, B and C.
To have a point of comparison, a fourth concept – called Concept X – is generated by experimenters using the Advisor. This is the concept presented in Section 3.3.3.
The four concepts are evaluated by participants (they also get 30 minutes). Each group is asked to evaluate the (anonymised) concepts of the other two groups, as well as Concept X generated using the Advisor mode. Participants are not informed that Concept X was not created by human designers. The evaluation is conducted for each strategic topic (ethical responsibility, environmental responsibility and security) and is done using an online evaluation form. Written justifications are also required from participants (at least 100 characters) for their ratings.
The four concepts are also evaluated by the Impact Guesser to provide a specific score for each strategic topic (on ethical responsibility, environmental responsibility and security). The Impact Guesser also gives written justifications from experts.
So, as shown in Figure 9, the experiment stages the creation of concepts and their justified evaluation based on (1) “the voice of automotive designers” (the participants) and (2) “the voice of impact experts and scientific studies” (the AutoVision platform).
After a brief intermission, the results are presented to the participants in the form of a ranking of concepts A, B, C and X according to the participants. Concept X is also disclosed to the participants. To provide a glimpse of the AutoVision platform to participants, experimenters then suggest taking the concept with the highest overall score (among A, B and C) and inputting it into the Impact Guesser to assess its potential impacts.
4.2. Criteria
To test the hypothesis (H1), the scores given by the participants for the four concepts A, B, C and X can be used to determine whether the concept generated by the Advisor (X) is at least as convincing or not.
To examine H2, the evaluations made by participants are compared with the evidence-supported evaluations produced by the Impact Guesser. The analysis concerns the direction and magnitude of divergences between these two forms of judgment, rather than the accuracy of either evaluation against an empirically verified future outcome.
The Impact Guesser is used to provide a score on each of the 19 themes of the platform. The scoring is only done for the usages to be promoted (Figure 10, area 3). To compare with participant’s evaluations, the themes need to be converted into scores for each of the three strategic topics. To do this, each theme was assigned to a topic (Table 3).
The dashboard provided to the groups to imagine their concept based on an existing database of usages.

Figure 10. Long description
A digital dashboard layout divided into five numbered sections.
On the right, a legend lists five points:
1. Reminder of the strategic topics to follow.
2. The preferred modes of use and their justification.
3. The usages to favor and their justifications.
4. The usages to avoid and their justifications.
5. The usage database to be included in sections 3 and 4 via drag and drop.
On the left, section 5 is a large 4 by 6 grid containing various square photographic tiles depicting futuristic transportation scenarios, such as passengers sleeping, working, or looking out windows in autonomous vehicles.
In the center column, section 1 shows three horizontal bars labeled with icons for Ethics, Environment, and Security.
Below it, section 2 displays three selected vehicle modes: a car, a van, and a bus.
Section 3, titled Usages à privilégier, is a horizontal row where six tiles from the database have been placed, each with a text justification below it.
Section 4, titled Usages à éviter, is a horizontal row at the bottom containing three tiles, including one showing a vehicle on fire, followed by empty slots for further selection.
Matching between impact themes and the three strategic topics

Table 3. Long description
The table consists of two columns. The first column is titled Strategic topic of the experiment and the second column is titled Impact themes of the AutoVision design platform.
* Row 1: Ethical responsibility matches with Education, Employment, Family, Genre, Health and welfare, Human rights, Identity and cultural heritage, and Stratification.
* Row 2: Environmental responsibility matches with Energy and Environment.
* Row 3: Security matches with Conflict and crime.
* Row 4: None matches with Networks and communication, Population change, Distance, Speed, Time, Traffic, Transport share, and Parking.
The calculation of scores for each strategic topic is done by calculating the average score for each theme corresponding to the topic, weighted by the number of impacts considered for each theme.
To examine H3, participant justifications are qualitatively compared with the expert rationales retrieved by the Impact Guesser, focusing on their breadth, level of elaboration and capacity to articulate contrasting consequences.
4.3. Details of experimentation supports
4.3.1. Concept imagination dashboard
Participants used a standardised Mural dashboard to select modes of use and five to eight usages to promote or avoid, together with written justifications (Figure 10).
Printed cards ensured that all group members could examine the available usages independently of the shared computer (Figure 11).
Sheets distributed to participants to remember the strategic topics and to go through the 30 usages without having to look at the computer (see Supplementary Material 7).

Figure 11. Long description
The image consists of three separate printed materials.
1. On the far left is a square card titled Strategic topics. It lists three categories with icons and brief descriptions:
- ETHICAL RESPONSIBILITY in gold with a people icon.
- ENVIRONMENTAL RESPONSIBILITY in green with a leaf icon.
- SECURITY in red with a shield icon.
2. In the center is a vertical sheet titled Usages 1 forward slash 2. It contains a 3 by 5 grid of 15 square images. Each image is numbered and includes a short caption in French. The images depict various futuristic transportation scenarios, including autonomous pods in nature, interior views of passengers relaxing, and vehicles navigating urban environments. Numbers visible include 1, 23, 30, 13, 3, 20, 28, 8, 27, 18, 26, 16, 15, 5, and 24.
3. On the right is a second vertical sheet titled Usages 2 forward slash 2. It contains the remaining 15 square images in a 3 by 5 grid, numbered from 10 to 11. These images show more specific use cases such as a vehicle on fire (number 19), a passenger sleeping (number 9), a passenger working on a laptop (number 6), and a vehicle interacting with an airplane on a runway (number 21). Other visible numbers include 29, 22, 12, 17, 4, 2, 25, 14, 7, and 11.
All images appear to be A I generated conceptual art illustrating the intersection of technology and daily human life.
The same set of 30 usages was used by both the participants and the Advisor, ensuring that the human- and platform-generated concepts were based on identical design material.
4.3.2. Evaluation form
An online form then collected ratings from 0 to 6 and written rationales for the three strategic topics (Figure 12).
Excerpt from the evaluation questionnaire related to the strategic topic of ethical responsibility (translated into English). For each AV concept, two complementary ratings are also collected: environmental responsibility and security.

Figure 12. Long description
The form is structured as follows:
* Top Instruction: You need to evaluate the concepts based on the choices of the participants, as well as the number and quality of their justifications.
* Header Section: An orange icon of a person and a heart precedes the title ETHICAL RESPONSIBILITY. Below it, a description reads: Respect human rights, provide accessible transportation, promote good health and well-being, foster social and family ties.
* Rating Question: In your opinion, to what extent does this concept meet the objective of ethical responsibility?
* Likert Scale: A horizontal row of seven numbered boxes from 0 to 6.
* Legend for Scale:
0: The objective is not respected at all
1: The objective is hardly respected
2: The objective is somewhat respected
3: The objective is moderately respected
4: The objective is fairly well respected (there are still some areas of uncertainty)
5: The objective is generally respected
6: The objective is fully respected
* Justification Section: A header titled Justifications, important points, discussed elements related to your choice. Below this is a large text input box with placeholder text stating: At least 100 characters.
Complete instructions and experimental materials are provided in Supplementary Material 7; examples of completed dashboards are available in Supplementary Material 3.
4.4. Participants
The experiment took place in a single session with eight skilled designers inside an automotive company. These individuals had decision-making authority and were responsible for actual projects within the company, thus playing a strategic role.
To form three groups, the eight participants were asked to mingle. The goal was to encourage diverse perspectives and prevent biases associated with a specific population. Additionally, this provided them with the chance to meet new people within the company. Groups 1 and 2 had three participants each, and Group 3 had two participants.
4.5. Evaluation distribution
During the evaluation phase, the different concepts were randomly assigned to the groups. Table 4 provides a summary of this distribution. The participants who had a laptop received the links to the (anonymised) concepts that needed to be evaluated via email.
Distribution of the four concepts among the groups for evaluation. The numbers in parentheses correspond to the identifier that participants saw

Table 4. Long description
The table consists of four columns and three rows.
Row 1 (Header): The first cell is Group 1 – Concept A. The following cells are C 11, X 21, and B 31.
Row 2: The first cell is Group 2 – Concept B. The following cells are X 12, C 22, and A 32.
Row 3: The first cell is Group 3 – Concept C. The following cells are B 13, A 23, and X 33.
5. Results
5.1. Participant evaluations
Figure 13 presents the evaluation results for the three strategic topics, as well as an overall average. Concepts A, B, and C were rated by two groups, while Concept X was rated by all three groups. The raw results and detailed calculations can be found in the Supplementary Material 8. The results presented in this section are exploratory and descriptive in nature. Given the small sample size (n = 8), the non-random selection of participants and the partially overlapping evaluation structure (each concept being assessed by different groups), inferential statistical tests were not applied. Under these conditions, statistical significance testing would violate standard assumptions of independence and statistical power and could lead to misleading conclusions. Consequently, the results are interpreted as indicative patterns intended to support qualitative and comparative analysis rather than statistical generalisation.
Human evaluation of the four AV concepts. Means and standard errors of ratings on the 0–6 scale are shown for descriptive purposes. Differences should be interpreted as indicative patterns rather than statistically significant effects.

Figure 13. Long description
A bar chart with a vertical y-axis labeled Average note from groups, ranging from 0 to 6. A legend on the left indicates that dark gray bars represent Concepts from participants (A, B, and C) and a purple-to-orange gradient bar represents the Concept from the Advisor (X). The x-axis is divided into four categories, each containing four bars labeled A, B, C, and X with their mean values listed below.
* Ethical category: Bar A is 2.0, Bar B is 5.5, Bar C is 3.5, and Bar X is 5.0.
* Environmental category: Bar A is 2.5, Bar B is 4.0, Bar C is 5.0, and Bar X is 3.3.
* Security category: Bar A is 4.5, Bar B is 4.5, Bar C is 5.0, and Bar X is 5.3.
* Overall category: Bar A is 3.0, Bar B is 4.7, Bar C is 4.5, and Bar X is 4.6.
Each bar includes a thin vertical error bar representing the standard error. Concept B generally performs best in the Ethical and Overall categories, while Concept C leads in Environmental, and the Advisor’s Concept X leads in Security.
When it comes to ethical responsibility, Concepts B (with an average rating of 5.5) and X (with an average rating of 5.0) outperformed Concepts A (rating of 2.0) and C (rating of 3.5). One group stated that Concept B took into account both individual needs and collective modes of use. The groups evaluating Concept X praised its emphasis on health, well-being and family connections. The groups evaluating Concept A stated that only one usage was related to ethics, without any argumentation. One of the groups evaluating Concept C explained that there was no consideration for accessibility, health/well-being or human rights.
Regarding environmental responsibility, Concept C dominates the others with an average score of 5.0. One of the groups stated for Concept C that the strategic topic had been respected with an emphasis on optimisation. Concept B ranked second with an average score of 4.0. One of the groups explained that environmental aspects seemed less present in the justifications for usages compared to Concept C. Concept X obtained a score of 3.3. The three groups that evaluated it do not agree with each other. One of the groups deemed the proposal as good as the others (rating of 5). Another group explained that there were few arguments regarding the environment (rating of 3). The last group criticised the choice of a usage that allows for sports, which could lead to additional weight (rating of 2). Finally, Concept A obtained an average score of 2.5. The groups justified their ratings by saying that there were only two or three usages related to the environment, without elaborate justifications.
Regarding security, the four concepts have close and fairly high scores. Concept X is the highest with a score of 5.3. The groups that evaluated this concept found that it proposed many arguments about security. One group considered the topic respected but expressed one concern about the absence of first aid options. Concept C obtained a score of 5.0. One of the groups explained that safety was emphasised for both vehicle and external users. Concepts B and A both scored 4.5. For Concept A, one of the groups explained that security was fairly well represented in the usages chosen, but the arguments were less developed than for ethics. Finally, for Concept A, one of the groups stated that the safety aspect was overwhelmingly dominant in the formulated choices (rating of 6), but another group nuanced it by saying that there were too few justifications (rating of 3).
In terms of overall averages, Concept A (score of 3.0) is overshadowed by the other three, which are all very close with each other: B with 4.7, X with 4.6 and C with 4.5. The standard error depicted in Figure 13 suggests that the top three concepts cannot be definitively ranked. However, it is evident that concept A is falling behind the others, primarily due to its lower scores on ethical and environmental topics.
5.2. Impact Guesser evaluations
Figure 14 presents the ratings delivered by the Impact Guesser for the three strategic topics as well as an overall average. The raw results and detailed calculations can be found in the Supplementary Material 8.
Impact Guesser (AutoVision) evaluation of the four AV concepts. The score is given on a scale from −100% to 100%.

Figure 14. Long description
A grouped bar chart with a vertical y-axis labeled Average score from Impact Guesser, ranging from minus 20 percent to 100 percent. A horizontal baseline at 0 separates positive and negative scores. Four categories are listed along the x-axis: Ethical, Environmental, Security, and Overall. Each category contains four bars labeled A, B, C, and X. Bars A, B, and C are solid dark gray representing concepts from participants. Bar X is a purple-to-orange gradient representing the concept from the Advisor.
* Ethical: A is minus 3, B is minus 8, C is 41, and X is 49.
* Environmental: A is 56, B is 33, C is 33, and X is 56.
* Security: A is minus 1, B is minus 15, C is minus 5, and X is 33.
* Overall: A is 18, B is 3, C is 23, and X is 46.
A legend on the left confirms the color coding for participant concepts and the advisor concept.
Concept X received the highest overall Impact Guesser score. Because this concept had been generated using the Advisor, this pattern was expected; however, it should be interpreted descriptively and not as evidence of statistically significant superiority.
Regarding ethics, two concepts received a positive score (C and X). Concept X is the highest with a score of +49%, mainly due to strong scores on the themes of health and welfare and employment. Next, Concept C achieved +41%, thanks to a very good score on employment. Concepts A and B received scores of −3% and − 8% respectively, suggesting that they may have a negative impact on ethical responsibility in the future. The low score of Concept A is primarily because of a very poor score on employment, but it is balanced by positive scores on human rights and identity and cultural heritage. The low score of Concept B is attributed to a poor score on health and welfare and a score close to zero for all other themes.
Regarding the environmental topic, all four concepts received high scores. Concepts A and X scored +56%, while Concepts B and C scored +33%. The two themes of the environmental topic were energy and environment, and their scores were consistently similar across the four concepts.
Regarding security, Concept X was the only concept with a positive alignment score (+33%). The other concepts showed negative alignment scores for this strategic objective: −1% for Concept A, −5% for Concept C and − 15% for Concept B. The topic of security was exclusively represented by the theme of conflict and crime.
Overall, Concept X received the highest Impact Guesser score (+46%), followed by Concepts C (+23%), A (+18%) and B (+3%). Concept B was mainly impacted by its low scores in security and ethics.
5.3. Qualitative comparison of participants’ justifications and expert opinions
To further the analysis, the justifications provided by the participants to justify their concepts were qualitatively compared with the expert opinions from the AutoVision’s Impact Guesser.
The impacts to avoid were not considered, as the Impact Guesser was not used on them. It should also be noted that no expert opinion concerns the environmental strategic topic, as it deals with quantitative impacts drawn from the literature (SMI model, see Lecomte et al. (Reference Lecomte, Yannou, Cahen, Thibaud and Étienne2024)).
On average, participants justified their choices with 250 words, whereas expert opinions from Impact Guesser provided an average of 1,200 words per concept – nearly five times as many words. To improve readability and reduce redundancy, the expert opinions have been synthesised to approximately 600 words per concept. The comparison is shown in Figure 15. Supplementary Material 8 provides more details on this comparison and allows for a more suitable reading experience.
Qualitative comparison between the justifications provided by the groups for their choices, and the summary of expert opinions provided by the Impact Guesser (number of words reduced by two times). This table can also be found in Supplementary Material 8.

Figure 15. Long description
The table compares qualitative data across three rows labeled A, B, and C.
Row A:
Participants list concepts including Ethical Responsibility, Mobility for All, Promote Social Connections, Safety, Less drunkenness, Fatigue, Illness, Accidents, Flow of goods, and Environmental responsibility.
Experts’ opinions provide a long list of impacts including the risk of delivery driver jobs disappearing, improved mobility for elderly and disabled individuals, and reduction of driving under the influence.
Row B:
Participants categorize justifications into Private (optimization of travel time, well-being) and Shared (strengthened social connections, ecology). It also mentions narrower parking spaces and no double parking.
Experts’ opinions discuss the reevaluation of parking spaces, the disappearance of boundaries between private and professional spheres, and the possibility of accessing jobs outside public transport hours.
Row C:
Participants focus on environmental impacts, the efficiency of carpooling, and the advantage of shared transportation for social and collective activities.
Experts’ opinions discuss cleaning centers, motion sickness in autonomous vehicles, and the potential for vehicles to offer unique spaces for social gatherings.
Legend at the bottom:
- Solid green highlight: Common elements.
- Orange horizontal lines: Similar elements.
- Red horizontal lines: Disagreeing elements.
- Grey horizontal lines: No common points.
Text within the table uses these highlights to show relationships. For example, Mobility for All in Row A is highlighted in orange, corresponding to a similar point in the expert column about improved mobility for disabled individuals.
The first thing that stands out is the difference in the accuracy of rationale provided by the participants and the experts. The participants generally did not seek to explain the rationale behind their justifications. Concept A is particularly striking in this regard, as some of the justifications are limited to a few words like “safety” or “environmental responsibility.” This was obviously too broad to find any points of comparison with the experts, as highlighted in yellow.
Another notable aspect is that many of the topics discussed by the experts are not reflected in the justifications provided by the participants. In fact, some elements used to justify a concept are even contradicted by the experts. For example, Concept B justifies the usage of “working in the vehicle” by claiming that it allows for more working time. The experts acknowledge that working in the vehicle can provide flexibility, but it also carries the risk of burnout (highlighted in red). This last example illustrates another point: the lack of nuance in the participants’ justifications. Overall, they did not engage in deep reflection to anticipate the consequences that their choices could have. Instead, they settled for immediate and obvious justifications that are always positive, resulting in depicting rather idealised concepts of AVs.
5.4. Observations during the experiment
The concept imagination phase lasted 50 minutes (instead of 30), and the evaluation phase lasted 46 minutes (instead of 30).
Some participants were unsure about the main goal of the experiment. It appears that they did not grasp the importance for their company to anticipate long-term effects. Some expressed their mindset of “let’s just stick to our usual business practices.” Additionally, some participants found the evaluation intellectually challenging – especially the need to provide a minimum of 100 characters to explain their evaluations.
All groups identified the concept generated using the Advisor before the end of the experiment. One group noticed that Concept X was more detailed compared to the others. This is supported by the number of words used, which was significantly higher than for the other concepts (731 words compared to 244 for the participant’s concept with the most words). Another group thought that the explanations for the concept resembled those that could have been generated by a Large Language Model like ChatGPT. Confident in their convictions, and despite our denials, they described the explanations as “generic” and sometimes even absurd, even though they were exact transcriptions of the experts’ comments used to feed into the AutoVision databases, with no possible LLM hallucination. At this point, no participant was aware that the data used to generate Concept X came from experts or scientific studies.
At the end of the experiment, the Impact Guesser was used in a plenary session on Concept B (the concept that received the highest score from participants). It was shown that by removing the initially chosen private mode of use, the environmental score could be significantly increased. Participants had two reactions: some questioned themselves and admitted their lack of knowledge, while others questioned the platform’s ability to provide accurate information through the case-based reasoning-like mechanism – which was surprising for them.
5.5. Interpretation of the results
We attempted to draw a more comprehensive comparison between the evaluations provided by the participants and those by AutoVision (Impact Guesser). We have therefore overlaid the two evaluations in Figure 16. Overall, the results show that:
-
- Concept X is among the highest-rated concepts in the participant evaluations and receives the highest overall Impact Guesser score.
-
- Concept B receives the highest participant mean but the lowest overall Impact Guesser score.
-
- Concept A receives the lowest participant mean but a higher overall Impact Guesser score than concept B.
-
- The two evaluation profiles diverge particularly on ethical, environmental and security-related dimensions.
Comparison of Human and AutoVision (Impact Guesser) evaluations of the four AV concepts. For visual comparison only, AutoVision scores were linearly rescaled from [−100%, +100%] to [0, 6] using (g = 3 + 0.03 s), so that −100% = 0, 0% = 3 and + 100% = 6. This rescaling does not imply that the two scales measure identical constructs.

Figure 16. Long description
A multi-panel bar chart with a shared Y-axis labeled Grade (0-6). A horizontal dashed line at 3 represents the neutral midpoint. The legend at the top identifies black bars as Human evaluations and purple-to-orange gradient bars as AutoVision evaluations.
* Panel 1 (ETHICAL): Human scores are 2.0, 5.5, 3.5, 5.0 for concepts A, B, C, and X respectively. AutoVision scores are 2.9, 2.6, 4.9, 5.3.
* Panel 2 (ENVIRONMENTAL): Human scores are 2.5, 4.0, 5.0, 3.3. AutoVision scores are 5.6, 4.5, 4.5, 5.6.
* Panel 3 (SECURITY): Human scores are 4.5, 4.5, 5.0, 5.3. AutoVision scores are 3.0, 2.3, 2.8, 4.5.
* Panel 4 (OVERALL): Human scores are 3.0, 4.7, 4.5, 4.6. AutoVision scores are 3.8, 3.1, 4.1, 5.1.
A table at the bottom summarizes these values and includes a row for the Gap (AutoVision minus Human). Significant positive gaps (AutoVision higher) include Environmental A (+3.1) and Environmental X (+2.3). Significant negative gaps (Human higher) include Ethical B (-2.9), Security B (-2.2), and Security C (-2.2).
The descriptive participant ratings indicate that the Advisor-generated Concept X was perceived as similarly convincing to the highest-rated designer-generated concepts. This pattern provides exploratory support for H1; it does not establish statistical equivalence or general superiority.
The low score given to Concept A can be explained by the fact that its justifications were not as developed as those of the other concepts, as highlighted by Groups 2 and 3 who evaluated this concept. Surprisingly, the Impact Guesser prefers Concept A over Concept B on all three criteria. It is also noteworthy that the participants gave the lowest score on the environmental topic, while the Impact Guesser gave the highest score (tied with concept X). This suggests that a concept following a given strategy will not be perceived as such if the justifications are not convincing enough. This discrepancy suggests that participants did not consistently mobilise external evidence when evaluating ethical and environmental dimensions. For example, none consulted available evidence on the environmental implications of private versus shared modes of use during the exercise. Going further, Concepts B and C also received contradictory scores. On average, participants considered Concept B to be the one that best respects the strategic topics. However, it received the worst score from the Impact Guesser. For example, participants gave this concept a high environmental score even though it promotes a private mode of use, which studies have shown to contribute to climate change. These divergences support H2 by showing that participant judgments differed from AutoVision’s evidence-supported evaluations, particularly for environmental and ethical dimensions. They do not establish that the platform is correct or that the designers are inaccurate; rather, they indicate the value of making alternative impact pathways and their supporting evidence explicit before concept selection.
Participant justifications were shorter and covered fewer consequences than the expert rationales retrieved by the Impact Guesser. They also focused more frequently on immediate and positive consequences, whereas the expert rationales articulated a broader range of potential benefits and drawbacks. This pattern supports H3 in terms of breadth and nuance; it does not establish that the expert rationales are necessarily more accurate.
During the debrief session, participants were taught how to use the Impact Guesser to improve Concept B. However, some of them did not recognise their lack of knowledge and instead questioned the platform’s ability to question their design choices. This suggests a potential obstacle to the platform, regarding the trust that users have in it. This may also suggest that some participants may have experienced an illusion of expertise, as they have been working in the automotive industry for a significant period of time.
6. Conclusion
6.1. Findings
This paper presents AutoVision as an original anticipatory design platform developed to support the early-stage design and evaluation of AV concepts under conditions of deep uncertainty. By integrating the SMI and RUI models, AutoVision combines scientific studies, expert judgements and traceable recommendations within a single artefact. While the two underlying models had been introduced separately in previous work, the present study is the first to present their full integration into an operational design platform and to assess its value in comparison with professional designers. This is important because the front end of innovation is precisely the stage at which design freedom is highest, while knowledge about future consequences remains weakest. Conventional brainstorming and agile approaches are useful for generating many ideas quickly, yet they do not necessarily help designers distinguish between desirable and undesirable long-term trajectories. Conversely, impact assessment approaches can help anticipate future effects, but often require a sufficiently stabilised concept and specialised expertise. AutoVision was designed to bridge this gap by combining ideation support with structured anticipatory evaluation.
The exploratory experiment conducted with eight senior designers in a major automotive company yielded three principal findings. First, from the designers’ own perspective, a concept generated through the Advisor mode was judged to be at least as convincing as concepts generated by the designers themselves. This result is notable because the participants were highly experienced professionals with decision-making responsibilities in their organisation. It therefore suggests that, in this exploratory setting, a structured knowledge-based platform can generate a concept perceived as competitive with designer-generated alternatives when assessed against explicit strategic criteria. Second, marked divergences appeared between participant evaluations and the platform’s evidence-supported assessments, particularly regarding environmental and ethical dimensions. This indicates that even experienced designers may struggle to evaluate concepts whose consequences depend on indirect, systemic and delayed mechanisms extending over decades. Third, the justifications derived from AutoVision were substantially richer, more systematic and more nuanced than the rationales provided by participants, who often relied on immediate, positive or relatively generic arguments.
These findings suggest that professional expertise alone may be insufficient when reasoning about disruptive technologies whose impacts unfold over long-time horizons. Several mechanisms identified in prior literature may help explain these results. Designers may rely on familiar solution patterns and industry routines, thereby reproducing fixation effects (Jansson & Smith Reference Jansson and Smith1991; Purcell & Gero Reference Purcell and Gero1996) or routine behaviour (Dorst & Cross Reference Dorst and Cross2001). They may overestimate the transferability of current experience to radically different futures, thereby underestimating the scale of change (Gates Reference Gates1999). They may also exhibit bounded ethicality (Chugh, Bazerman & Banaji Reference Chugh, Bazerman, Banaji, Moore, Cain, Loewenstein and Bazerman2005), ethical fading (Tenbrunsel & Messick Reference Tenbrunsel and Messick2004) or motivated reasoning (Kunda Reference Kunda1990), especially when acknowledging negative impacts implies redesign costs, delayed commercialisation or strategic discomfort. The “advisory” mode may apparently limit creativity (Shah, Kulkarni & Vargas-Hernandez Reference Shah, Kulkarni and Vargas-Hernandez2000Shah, Smith & Vargas-Hernandez Reference Shah, Smith and Vargas-Hernandez2003), but it can also help designers avoid falling into all of the aforementioned pitfalls associated with thinking about disruptive technologies whose impacts unfold over long-time horizons.
The originality of the present study lies not only in empirically evaluating a new artefact but also in documenting how cognitive limitations may affect responsible concept evaluation in an industrial context.
6.2. Contributions
The paper contributes to Design Science at several levels. As an artefact contribution, it introduces AutoVision as a novel epistemic support system for responsible concept design. The platform demonstrates how heterogeneous sources of knowledge – scientific studies, expert interpretations, strategic objectives and concept attributes – can be combined into a usable artefact for designers. As a methodological contribution, the paper proposes an experimental protocol comparing designer judgements with transparent platform evaluations and qualitative reasoning traces. As an empirical contribution, it shows that structured anticipatory support can generate concepts perceived as competitive with those of experienced professionals. As a theoretical contribution, it enriches research on design cognition by documenting how professionals may struggle to reason about uncertain, systemic and long-term impacts.
Beyond these direct contributions, the study suggests broader avenues for a discipline of responsible design. First, responsibility requires anticipation without pretending to predict. Designers cannot know the future with certainty, but they can systematically explore plausible impact pathways, second-order effects and uncertainties (Worthington Reference Worthington1982; Von Schomberg Reference Von Schomberg, Dusseldorp and Beecroft2012; Stilgoe et al. Reference Stilgoe, Owen and Macnaghten2013). In this respect, AutoVision does not function as an oracle. Rather, it structures available knowledge so that uncertain futures become discussable and comparable. Second, responsibility requires reflexivity and value explicitness. Strategic goals, trade-offs and implicit assumptions should not remain hidden behind technical rhetoric. Responsibility must itself become a design value to be surfaced, debated and operationalised (Friedman, Kahn & Borning Reference Friedman, Kahn, Borning, Zhang and Galletta2007; Nihlen, Doorn & van de Poel Reference Nihlen, Doorn, van de Poel, van den Hoven and Poel2015). The strategic framing used in the experiment – ethical responsibility, environmental responsibility and security – illustrates one possible starting point, but organisations may refine these value categories according to their own context.
Third, responsibility requires inclusion and social responsiveness. Technologies reshape daily life unevenly, often affecting vulnerable populations first or most strongly. Designers, therefore, need mechanisms to account for multiple stakeholders, shifting practices and context-specific consequences (Melles et al. Reference Melles, de Vere and Misic2011; De Saille Reference De Saille2015). The RUI model was developed precisely to bring sociological and expert perspectives into concept reasoning. Fourth, responsibility requires responsiveness and revisability. Design processes must retain the capacity to change direction when new evidence accumulates or when emerging harms become visible (Sattlegger et al. Reference Sattlegger, Van den Hoven and Bharosa2022). This means that responsibility is not only deliberative but it is also operational. Fifth, responsibility requires designing against predictable ethical failure modes. Since bounded ethicality, ethical fading and motivated reasoning are normal human tendencies rather than exceptional flaws, organisations should embed safeguards such as explicit impact reviews, adversarial questioning, structured prompts and accountability mechanisms (Kunda Reference Kunda1990; Tenbrunsel & Messick Reference Tenbrunsel and Messick2004; Chugh, Bazerman & Banaji Reference Chugh, Bazerman, Banaji, Moore, Cain, Loewenstein and Bazerman2005). Sixth, responsibility requires treating constraints as generative. Ecological ceilings, safety imperatives and societal boundaries should not be viewed only as restrictions, but as creative drivers of innovation (Auger & Hanna Reference Auger and Hanna2019). In this perspective, AutoVision is less a substitute for designers than a structured companion helping operationalise these principles during concept generation and selection.
6.3. Limits and future work
Several limitations should nevertheless be acknowledged. First, the platform’s aggregation mechanisms may obscure compensatory effects and privilege impacts that are better documented in literature or expert sources. Some relevant phenomena may therefore be underrepresented. Second, the SMI and RUI models still interact only partially, limiting the representation of cross-effects between environmental, socio-economic and social consequences. For example, a usage change may simultaneously affect employment, emissions and wellbeing in ways not yet fully captured. Third, some dimensions such as security are currently represented narrowly and could be broadened to include reliability, cybersecurity, resilience, misuse scenarios or operational robustness. Moreover, some participant rationales referred to operational safety, whereas AutoVision represented the strategic topic of security only through the “conflict and crime” theme. Comparisons on this dimension should therefore be interpreted cautiously. Fourth, the experiment was exploratory, based on a small and non-representative sample, and group dynamics or charismatic participants may have influenced outcomes. Fifth, participants eventually inferred that Concept X had been generated by the platform because of the density and style of its justifications. Sixth, additional criteria such as economic potential, manufacturability, strategic desirability or regulatory feasibility would also have enriched the evaluation framework.
A last limitation concerns the generalisability of the observed patterns. The empirical study was conducted with a small group of eight senior designers from a single automotive company, within a specific organisational culture and in relation to AV concepts. The results should therefore not be interpreted as statistically generalisable to all designers, firms or sectors. Rather, they should be understood as analytically transferable patterns grounded in mechanisms already documented in prior literature. The cognitive tendencies observed during the experiment – such as fixation on familiar solutions (Jansson & Smith Reference Jansson and Smith1991; Purcell & Gero Reference Purcell and Gero1996), routine-based reasoning (Dorst & Cross Reference Dorst and Cross2001), overconfidence in expert judgment, bounded ethicality (Chugh, Bazerman & Banaji Reference Chugh, Bazerman, Banaji, Moore, Cain, Loewenstein and Bazerman2005), ethical fading (Tenbrunsel & Messick Reference Tenbrunsel and Messick2004) and motivated reasoning (Kunda Reference Kunda1990) – are not specific to the automotive context and have been identified across multiple professional decision environments. It is, therefore, plausible that similar difficulties emerge whenever designers or innovation teams must evaluate disruptive products whose impacts are systemic, uncertain and long-term, such as in healthcare technologies, robotics, energy systems, AI services or smart-city infrastructures. However, the intensity and expression of these mechanisms are likely to vary depending on sectoral regulation, organisational incentives, design maturity and stakeholder exposure. Future research should consequently examine the replication of these patterns across industries, countries, professional profiles and technological domains, in order to distinguish what is specific to autonomous mobility from what may constitute broader regularities of responsible design under uncertainty.
Future work should therefore proceed in several directions. Larger replications across multiple companies would help determine whether the observed cognitive patterns extend beyond the focal organisation. Cross-sector studies in domains such as healthcare, energy systems, robotics or smart infrastructure would test the transferability of the approach to other disruptive technologies. Longitudinal studies following real design projects could examine whether early use of AutoVision actually changes downstream decisions, project trajectories or impact outcomes. On the platform side, future versions could include richer ontologies of impacts, stronger coupling between the SMI and RUI models, dynamic scenario modules and interfaces allowing designers to challenge or enrich the knowledge base. AutoVision could also serve as a training environment, helping practitioners recognise their own reasoning limitations and institutionalise more reflective design routines (Cash et al. Reference Cash, Elias, Dekoninck and Culley2012).
A final implication concerns the growing role of AI in design support. AutoVision illustrates a form of epistemic augmentation tool that differs substantially from generic large language models. It relies on curated and traceable evidence rather than probabilistic fluency. It provides explicit links between design choices and impact rationales rather than opaque textual plausibility. It is less exposed to hallucinations, fabricated references, instability across prompts or internally inconsistent reasoning. Its knowledge base can be audited, updated and governed according to domain-specific responsibility criteria. More broadly, it suggests that future AI for design should not only generate persuasive outputs but also strengthen judgment, accountability and anticipatory reasoning. The broader lesson of this paper is therefore concise: responsibility in disruptive design may require epistemic augmentation tools.
Supplementary material
The supplementary material for this article can be found at http://doi.org/10.1017/dsj.2026.10074.
A. Appendix A
A.1. How to formulate recommendations on preferred usages using the RUI model
As explained in Section 3.3.2, a strategy consists of a list of impact indicators for which desirable trends have been identified. For example, a designer may want the stress indicator to decrease, that is passengers experience less stress compared to today when using transportation.
It is from this strategy that recommendations are provided to the user. The aim is to indicate usages to promote and usages to avoid. For example, recommending the usage of “sleeping in the vehicle” which can help reduce stress according to experts.
As output, the Advisor mode provides three metrics for each usage of the autonomous vehicle:
-
• The majority influence $ {M}_u $
 , which indicates whether the usage should be favoured (
$ {M}_u=1 $
) or avoided (
$ {M}_u=-1 $
).
-
• The number of impacts $ {n}_u $
that experts have associated with this usage. -
• The conflict coefficient $ {k}_u $
, which expresses whether there is consensus (
$ {k}_u\approx 0 $
) among the experts or not (
$ {k}_u\approx 1 $
).


Examples of interpretation for these three metrics are provided in Table A1. The following paragraphs detail their calculation.
Example of calculating and interpreting
$ {M}_u $
 ,
$ {n}_u $
 and
$ {k}_u $
 metrics based on five usages, following the selection of one or more social impact trends by a user

Table A1. Long description
The table consists of five columns and four data rows.
Column headers are: Usage (u sub x), Majority influence (M sub u sub x), Total number of impacts (n sub u sub x), Conflict coefficient (k sub u sub x), and Interpretation.
* Row 1: Usage u sub 1. Majority influence is 1. Total number of impacts is 2. Conflict coefficient is 82 percent. Interpretation: There is little data on usage 1, and the impacts contradict each other (high conflict). We cannot give importance to the majority influence.
* Row 2: Usage u sub 2. Majority influence is 1. Total number of impacts is 31. Conflict coefficient is 18 percent. Interpretation: Usage 2 clearly favours the selected trends.
* Row 3: Usage u sub 3. Majority influence is minus 1. Total number of impacts is 3. Conflict coefficient is 0 percent. Interpretation: There is little data on usage 3, but all three impacts indicate the same trend (no conflict). We can say that usage 3 could unfavourably impact the selected trends.
* Row 4: Usage u sub 4. Majority influence is minus 1. Total number of impacts is 28. Conflict coefficient is 94 percent. Interpretation: There is a lot of data on usage 4, but the impacts contradict each other (high conflict). We cannot conclude on the majority influence.
To calculate the majority influence
$ {M}_u $
 , the average intensity
$ \overline{{Q_I^{\ast}}_u} $
 of impacts caused by the usage
$ u $
 (according to the experts) is first calculated (Equation A1). This average is calculated with respect to the direction of trends selected by the user: for each impact, if trend (
$ T $
 ) is the same as the trend selected by the user (
$ {T}^{\prime } $
 ), then the average intensity is positively influenced. The average intensity is normalized and ranges from −1 (the usage only causes negative impacts) to 1 (the usage only causes positive impacts).

-
- $ {L}_u $
is the subset of impacts that are influenced by the usage
$ u $
. -
- $ {L}_s $
is the subset of impacts corresponding to the indicators selected by the user. -
- $ {T}_j $
is the trend of impact
$ j $
. -
- $ {T_j}^{\prime } $
is the trend selected by the user for impact
$ j $
. -
- $ {q}_j^{\ast } $
is the normalised certainty of impact
$ j $
. -
- $ {Q_I^{\ast}}_j $
is the normalised intensity of impact
$ j $
.


Depending on the sign of this average intensity, it is then possible to calculate the majority influence (Equation A2).

The total number of impacts for the usage
$ u $
 corresponds to the set of impacts influenced by this usage (
$ {L}_u $
 ) and selected by the user (
$ {L}_s $
 ) (Equation A3).

Finally, the conflict coefficient
$ {k}_u $
 (Equation A4) is equivalent to a weighted standard deviation of intensity
$ {Q_I^{\ast}}_u $
 .

Figure A1 graphically represents the average intensity (
$ \overline{Q_{I_u}^{\ast }} $
 ), the conflict (
$ {k}_u $
 ) and the number of impacts (
$ {sn}_u $
 ).
Graphical representation of average intensity (
$ \overline{{Q_I^{\ast}}_u} $
 ), conflict (
$ {k}_u $
 ) and total number of impacts (
$ {n}_u $
 ), weighted by certainty (
$ {q}_j^{\ast } $
 ), for a given usage
$ u $
 . The size of the circles represents the level of certainty
$ {q}_j^{\ast}\in \left[0,1\right] $
 .

Figure A1. Long description
The graph features a vertical Y axis labeled Q super star sub I j T prime sub j, representing Normalized intensity times Selected trend, with values from negative 1 to 1. The horizontal X axis is labeled j in L sub u intersection L sub s, representing Impact. Eight data points are plotted as black dots surrounded by light orange circles of varying sizes, representing certainty q super star sub j.
From left to right, the points are located at impact indices 5, 16, 21, 37, 45, 46, 50, and 52. Points at 5, 16, 37, 46, 50, and 52 are positive, while points at 21 and 45 are negative. Vertical dashed lines connect each point to the X axis.
A solid horizontal orange line represents the average intensity Q super star sub I u overline. A double-headed vertical orange arrow on the right side, labeled k sub u, indicates the conflict range between the average line and the zero baseline. A long double-headed horizontal orange arrow at the bottom, labeled n sub u, spans the width of the impact points to indicate the total number of impacts. A legend in the bottom right corner shows three circles of increasing size corresponding to the certainty value q super star sub j.
B. Appendix B
B.1. How to formulate recommendations on preferred validity domains using the SMI model
As explained in Section 3.3.2, a strategy consists of a list of impact indicators for which desirable trends have been identified. For example, a designer may want the CO2 emissions indicator to decrease.
It is from this strategy that recommendations are provided to the user. The aim is to indicate validity domains to promote and to avoid. For example, recommending a shared mode of use that can help reduce CO2 emissions, according to scientific studies.
In the output, the Advisor mode provides three metrics for each validity domain:
-
• The majority influence $ {M}_v $
, which indicates whether the validity domain should be favoured (
$ {M}_v=1 $
) or avoided (
$ {M}_v=-1 $
). -
• The number of impacts $ {n}_v $
associated with this validity domain by the studies. -
• The conflict coefficient $ {k}_v $
, which expresses whether there is consensus among the studies (
$ {k}_v\approx 0 $
) or not (
$ {k}_v\approx 1 $
).


Their operation is similar to what was presented in the previous section (Table A1). The following paragraphs detail their calculation.
To calculate the majority influence
$ {M}_v $
 , the average of values
$ \overline{V_v^{\ast }} $
 of impacts linked to the validity domain (according to studies) is first calculated (Equation A5). This average is calculated with respect to the direction of trends selected by the user: for each impact, if the value is in the same direction as the trend selected by the user (
$ T^{\prime } $
 ), then the average is positively influenced. The average of values is normalized and ranges from −1 (the validity domain is only linked to negative impacts) to 1 (the validity domain is only linked to positive impacts).

-
- $ {L}_v $
is the subset of impacts that are linked to the validity domain
$ v $
. -
- $ {L}_s $
is the subset of impacts corresponding to the indicators selected by the user. -
- $ {V}_j^{\ast } $
is the value of impact
$ j $
(normalised by the highest value of the corresponding indicator). -
- $ {T_j}^{\prime } $
is the trend selected by the user for impact
$ j $
. -
- $ {q}_j $
is the certainty of impact
$ j $
(calculated based on the impact factor, number of citations and whether the study from which the value has been extracted is peer-reviewed or not).


Depending on the sign of this average value, it is then possible to calculate the majority influence (Equation A6).

The total number of impacts for the validity domain
$ v $
 corresponds to the set of impacts linked to this validity domain (
$ {L}_v $
 ) and selected by the user (
$ {L}_s $
 ) (Equation A7).

Finally, the conflict coefficient (
$ {k}_v $
 ) (Equation A8) is equivalent to a weighted standard deviation of values
$ {V}_j^{\ast } $
 .

Figure B1 graphically represents the average of normalised values (
$ \overline{V_v^{\ast }} $
 ), conflict (
$ {k}_v $
 ) and the number of impacts (
$ {n}_v $
 ).
Graphical representation of the average of normalised values (
$ \overline{V_v^{\ast }} $
 ), conflict
$ \Big({k}_v $
 ) and total number of impacts (
$ {n}_v $
 ) by certainty (
$ {q}_j $
 ), for a given validity domain (
$ v $
 ). The size of the disks represents the level of certainty
$ {q}_j\in \left[0,1\right] $
 .

Figure B1. Long description
A scatter plot with a vertical y-axis labeled V sub j super asterisk T prime sub j, representing Normalised value times Selected trend, ranging from negative 1 to 1. The horizontal x-axis is labeled j is an element of L sub v intersection L sub s, representing Impact.
A solid green horizontal line represents the average V bar sub v super asterisk, positioned slightly above 0. To the right of the plot, a vertical double-headed arrow labeled k sub v indicates the conflict range. Below the x-axis, a horizontal double-headed arrow labeled n sub v spans the width of the data points.
Eight data points are plotted as black dots surrounded by light green circular halos of varying sizes, representing certainty q sub j. Dashed vertical lines connect each point to the x-axis at specific impact indices:
* Impact 2: Positive value, medium certainty.
* Impact 6: Positive value near 1, small certainty.
* Impact 14: Negative value, small certainty.
* Impact 22: Positive value near 1, small certainty.
* Impact 44: Negative value near negative 1, small certainty.
* Impact 47: Positive value, large certainty.
* Impact 51: Positive value, small certainty.
* Impact 64: Positive value, small certainty.
A legend in the bottom right corner shows four green disks of increasing size labeled q sub j.


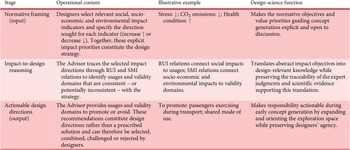


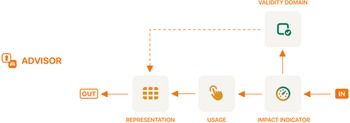





 Open access

