1. Introduction
A monsoon climate, characterized by a seasonal reversal of wind and precipitation, influences the hydrography, oceanography, ecological structure and even sediment deposition in the Arabian Sea (Schott & McCreary, Reference Schott and McCreary2001). The Indus Fan in the Arabian Sea is the second largest submarine fan system in the world (Fig. 1), after the Bengal Fan in the Bay of Bengal. The Indus Fan covers ∼1.12 × 10⁶ km2 in the Arabian Sea, stretching ∼1500 km into the Indian Ocean, with a maximum width of 960 km and thickest deposit of >7 km (Clift et al. Reference Clift, Shimizu, Layne, Blusztajn, Gaedicke, Schlüter, Clark and Amjad2001). Although the age of the formation of the Indus Fan is not certain, the initiation of fan sedimentation was related to the uplift of the Himalayas during middle Oligocene to early Miocene times (Clift et al. Reference Clift, Shimizu, Layne, Blusztajn, Gaedicke, Schlüter, Clark and Amjad2001, Reference Clift, Shimizu, Layne, Blusztajn, Gaedicke, Schlüter, Clark and Amjad2002). The International Ocean Discovery Program (IODP) Expedition 355 was conducted in 2015 to drill through the Indus Fan (Pandey et al. Reference Pandey, Clift and Kulhanek2016). The primary drilling objectives were to investigate tectonic–climatic interactions and their direct impacts on weathering and erosion of the western Himalayas over a wide range of timescales and to obtain the basement in the eastern Arabian Sea. As a result, IODP Expedition 355 succeeded in recovering sediment sections spanning ∼60 Ma, although the sedimentary sequence contains a very long hiatus (∼50 Ma) and large mass-transport deposits (Pandey et al. Reference Pandey, Clift and Kulhanek2016).
Study area of the Arabian Sea with seasonal monsoon winds (red arrow – summer monsoon; blue arrow – winter monsoon). Red star represents this study site (U1457) drilled in the Laxmi Basin. Solid dot marks other drilled site.

Land plants are classified into C3 (tree and shrub) and C4 (grassland) types, depending on their photosynthetic pathways (Smith & Epstein, Reference Smith and Epstein1971). Terrestrial C3 plants operate the RuBisCO carboxylation mechanism (Calvin–Benson cycle) for photosynthesis of organic matter whereas C4 plants prefer the phosphoenolpyruvate (PEP) carboxylation (Hatch–Slack cycle) mechanism for synthesis of organic matter. Consequently, the δ13C values (−30 to −23 ‰) of C3 plants are distinguishable from those (−17 to −9 ‰) of C4 plants (Smith & Epstein, Reference Smith and Epstein1971; O’Leary, Reference O’Leary1988). Because C4 photosynthesis overcomes the limitation of photorespiration, improving photosynthetic efficiency and minimizing water loss, C4 plants prefer living in hot, dry environments (Edwards & Walker, Reference Edwards and Walker1983). Thus, C3/C4 vegetation shifts are influenced primarily by various ecological conditions such as precipitation, temperature and atmospheric pCO2 (Collatz et al. Reference Collatz, Berry and Clark1998).
Quade et al. (Reference Quade, Cerling and Bowman1989) reported that δ13C values of pedogenic carbonate in the Siwalik Group (northern Pakistan) shifted considerably at ∼7 Ma, which has been interpreted as a result of the fundamental ecological change from C3 to C4 biomass in the Himalayan foreland. Such a late Miocene major expansion of C4 land plants is directly related to enhanced aridity in the Asian interior and the onset and intensification of the east Asian monsoon system, resulting from the uplift of the Himalaya–Tibetan Plateau at ∼9–8 Ma (An et al. Reference An, Kutzbach, Prell and Porter2001), although recent climate modelling has shown that monsoon strength is more related to surface heat flux rather than elevated terrain (Boos & Kuang, Reference Boos and Kuang2010). In contrast, Cerling et al. (Reference Cerling, Harris, MacFadden, Leakey, Quade, Eisenmann and Ehleringer1997) hypothesized that an abrupt and widespread vegetation change to C4 land plants between 8 and 6 Ma might have resulted from a global decline of atmospheric CO2 concentration, which is supported by the late Miocene (8 to 6 Ma) changes in temperature, climate and ecosystems reported by Herbert et al. (Reference Herbert, Lawrence, Tzanova, Peterson, Caballero-Gill and Keely2016). However, the decline of atmospheric CO2 level contradicts an observation of low (∼280 ppm) atmospheric pCO2 level and little change between 10 and 5 Ma (Pearson & Palmer, Reference Pearson and Palmer2000).
Nonetheless, the major floral change in the continental interior as a result of a precipitation pattern change may be related to monsoon intensification, which also affected the marine environment. For example, the abundance of monsoon-induced upwelling-related planktonic foraminifera (Globigerina bulloides) increased rapidly at 7.4 Ma in the western Arabian Sea (Kroon et al. Reference Kroon, Steens, Troelstra, Prell, Niitsuma, Emeis, Al-Sulaiman, Al-Tobbah, Anderson, Barnes, Bilak, Bloemendal, Bray, Busch, Clemens, de Menocal, Debrabant, Hayashida, Hermelin, Jarrad, Krissek, Kroon, Murray, Nigrini, Pedersen, Ricken, Shimmield, Spaulding, Takayama, ten Haven and Weedon1991; Zhuang et al. Reference Zhuang, Pagani and Zhang2017). A large shift in δ13C values in turbidite sediments at ∼7 Ma in the Bengal Fan also supports a late Miocene vegetation change in the Ganges–Brahmaputra river catchment (France-Lanord & Derry, Reference France-Lanord and Derry1994). Burbank et al. (Reference Burbank, Derry and France-Lanord1993) reported that sediment accumulation decreased significantly in the Bengal Fan at ∼7–8 Ma owing to several factors, including slope stabilization as a result of vegetation change. A historical increase in leaf wax δ13C values from 10 to 5.5 Ma at ODP Site 722 in the western Arabian Sea confirmed a marked increase in C4 land plants on the Arabian Peninsula, which indicates that the source region of the plant waxes was more arid or experienced a decrease in monsoon rainfall (Huang et al. Reference Huang, Clemens, Liu, Wang and Prell2007).
The deep-sea sediments are dominated by autochthonous marine organic matter with less dilution or replacement by terrigenous organic matter, whereas marine sediments on the continental shelf, including coastal and estuarine environments, preserve a mixture of marine and riverine terrigenous organic matter (Stein, Reference Stein1991; Mayer, Reference Mayer, Engel and Macko1993; Calvert et al. Reference Calvert, Pedersen, Naidu and von Stackelberg1995). Both the western margin of the Arabian Sea, with no major rivers, and the northern and eastern margins of the Arabian Sea, with major rivers, are overwhelmed by marine organic matter (e.g. Smallwood & Wolff, Reference Smallwood and Wolff2000; Cowie et al. Reference Cowie, Mowbray, Kurian, Sarkar, White, Anderson, Bergnaud, Johnstone, Brear, Woulds, Naqvi and Kitazato2014). Calvert et al. (Reference Calvert, Pedersen, Naidu and von Stackelberg1995) reported that δ13CSOM values (−21 ‰ to −19 ‰) of sedimentary organic matter (SOM) on the continental shelf are slightly lower than the deep-sea δ13CSOM values (−19‰ to −18‰) in the eastern Arabian Sea. Compared to terrigenous δ13CSOM values, these δ13CSOM values reflect the presence of a small proportion of terrigenous organic matter at shallow water depths. The Arabian Sea is characterized by an oxygen minimum zone (OMZ) at between 300 and 900 m in depth (Wyrtki, Reference Wyrtki1971). van der Weijden et al. (Reference van der Weijden, Reichart and Visser1998) concluded that the preservation potential of organic matter is high within the OMZ in the Arabian Sea, although Pedersen et al. (Reference Pedersen, Shimmield and Price1992) argued a lack of enhanced preservation under the OMZ along the Oman Margin. Thus, downslope movement of sediment by turbidity flows or reworked hemipelagic sedimentation can capture terrestrial organic matter in deep-sea sediments. Turbidite sedimentation in the Indus Fan was more active during the last glacial period, depositing fluvial and terrigenous sediments supplied from the Indus River (Prins et al. Reference Prins, Postma, Cleveringa, Cramp and Kenyon2000; Bourget et al. Reference Bourget, Zaragosi, Rodriguez, Fournier, Garlan and Chamot-Rooke2013). δ13CSOM values of turbidite sediments in the Bengal Fan show a striking terrestrial climate change during late Miocene time (France-Lanord & Derry, Reference France-Lanord and Derry1994), although Muzuka et al. (Reference Muzuka, Macko, Pedersen, Prell, Niitsuma, Emeis, Al-Sulaiman, Al-Tobbah, Anderson, Barnes, Bilak, Bloemendal, Bray, Busch, Clemens, de Menocal, Debrabant, Hayashida, Hermelin, Jarrad, Krissek, Kroon, Murray, Nigrini, Pedersen, Ricken, Shimmield, Spaulding, Takayama, ten Haven and Weedon1991) reported that the mean δ13CSOM value (−20.4 ‰) from the Pliocene to the Holocene at ODP Site 724 in the western Arabian Sea indicated less input of terrigenous-derived allochthonous materials to the Oman Margin.
Here we document the geochemical data (CaCO3, total organic carbon, total nitrogen and C/N ratios) and δ13CSOM values of sediments recovered from the Indus Fan (IODP Expedition 355 Site U1457) in the eastern Arabian Sea to provide insight into the degree of terrestrial contribution and environmental change in its catchment area since late Miocene time. In addition, the relative contributions of organic matter from terrestrial C3 and C4 plants and marine phytoplankton were calculated from a three-end-member simple mixing model using an isotope mass-balance equation to support our interpretation.
2. Materials and methods
The Laxmi Basin in the eastern Arabian Sea forms a 200–250 km wide depression that developed in a NW–SE direction parallel to the west coast of India. IODP Expedition 355 Site U1457 (17° 9.95′ N, 67° 55.80′ E; 3534 m depth) lies on the western edge of the Laxmi Basin, at the toe of the slope leading toward the structural and topographic high of the Laxmi Ridge (Fig. 1). Drilling at Site U1457 recovered a 1108.6 m long sedimentary sequence from three holes (U1457A, U1457B and U1457C) (Pandey et al. Reference Pandey, Clift and Kulhanek2016). The shipboard definition of lithologic units at Site U1457 was based on diverse factors such as visual core description, microscopic examination of smear slides and thin-sections, and magnetic susceptibility and colour spectral observations (Pandey et al. Reference Pandey, Clift and Kulhanek2016). Five lithologic units (I to V) were defined onboard using a compilation of holes U1457A through U1457C at Site U1457.
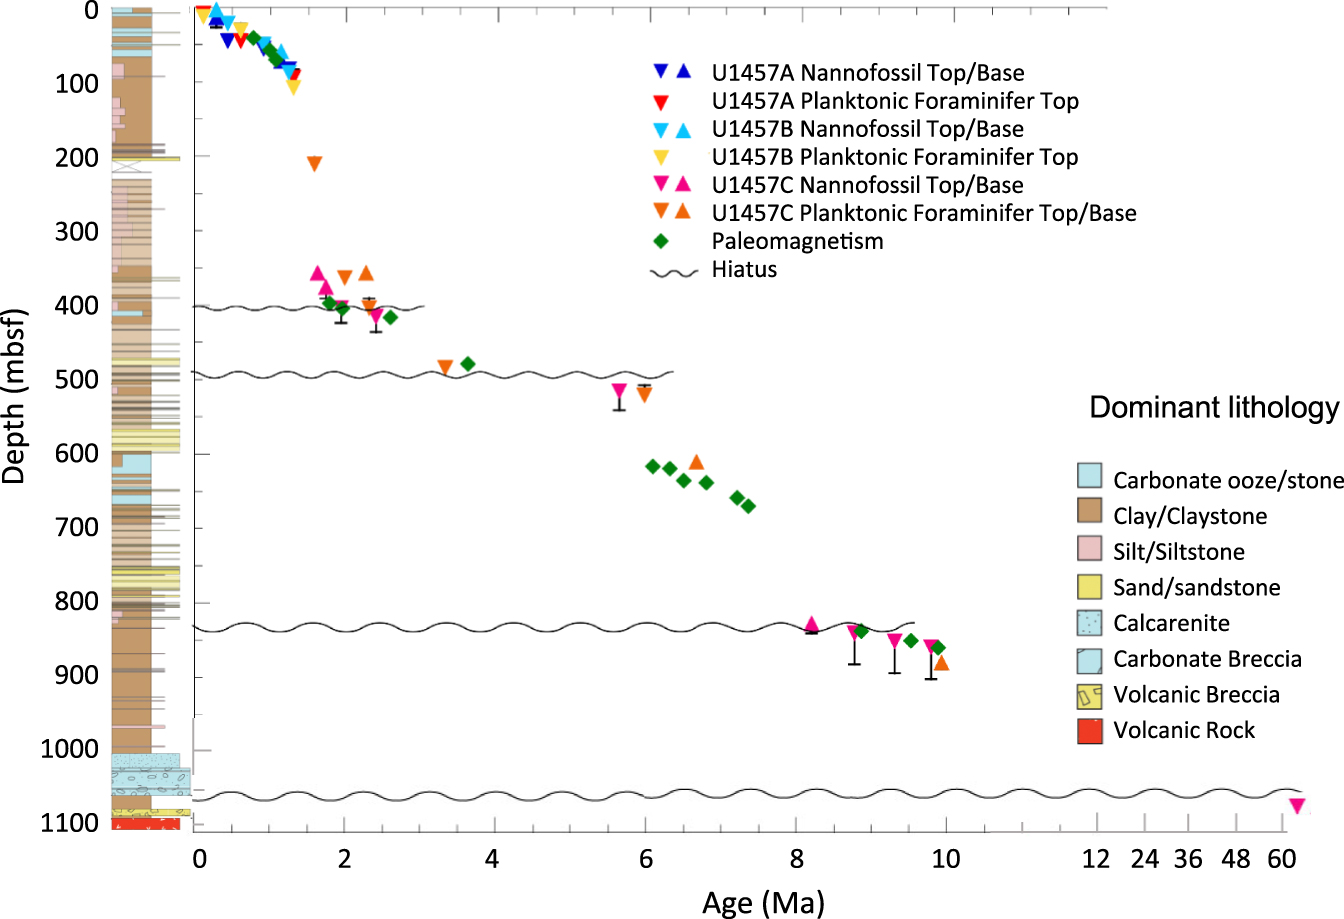
The preliminary age model for Site U1457 was determined onboard based on biostratigraphy of calcareous nannofossil and planktonic foraminifera, together with magnetostratigraphy (Fig. 2). Based on the succession of calcareous nannofossil and planktonic foraminifera events, the sedimentary sequence at Site U1457 spans the lower Paleocene through Holocene, despite a very long hiatus (∼50 Ma from the lower Paleocene to the upper Miocene) at ∼1062 metres below seafloor (mbsf) (Pandey et al. Reference Pandey, Clift and Kulhanek2016; Routledge et al. in prep). The biostratigraphic framework also identified three unconformities (∼0.8 Ma duration at ∼8 Ma; ∼2 Ma between the Miocene/Pliocene boundary and the lower Pliocene; and ∼0.45 Ma during the lower Pleistocene) above the middle Miocene (Fig. 2). The sedimentation rate was relatively consistent (∼17 to ∼10 cm ka−1) during late Miocene time. A lower sedimentation rate (∼4 cm ka−1) was measured between ∼7.4 and 6.0 Ma and between late Pliocene and early Pleistocene times, although the sedimentation rate was very high (∼58 cm ka−1) during an interval of early Pleistocene time. Since then and into the Holocene period, it decreased to ∼7 cm ka−1.
Schematic lithologic columnar section and age–depth plot at Site U1457 (modified after Pandey et al. Reference Pandey, Clift and Kulhanek2016).

A total of 234 sediment samples were collected, largely from the turbidite and hemipelagic layers based on sediment lithology and magnetic susceptibility in a discrete interval from a composite section (26 samples from Hole U1457A, 34 samples from Hole U1457B and 174 samples from Hole U1457C) at Site U1457. Information on the samples is summarized in online Supplementary Material Table S1. Total carbon (TC) and total nitrogen (TN) contents were measured using a Flash 2000 elemental analyser at Pusan National University. The analytical errors for TC and TN were less than ± 0.1 % and ± 0.01 %, respectively. Total inorganic carbon (TIC) content was measured using a UIC CO2 coulometer (Model CM5014). Assuming that all TIC was in the form of calcium carbonate, TIC content was converted to CaCO3 content as a weight percentage using the multiplication factor 8.333 (a ratio of molecular weight between CaCO3 and C). The analytical precision of TIC as a relative standard deviation was ± 0.1 %. Total organic carbon (TOC) content was calculated by the difference between TC and TIC. δ13C values were measured at Iso-Analytical Ltd (UK). In brief, prior to δ13C analysis, sediment samples were acidified with 1M HCl. The samples were ground after being neutralized by repeatedly washing with distilled water and subsequently oven dried at 60 °C. Tin capsules containing sediment powder or reference material were loaded into an auto-sampler of a Europa Scientific elemental analyser. The resultant CO2 chromatographic peak entered the ion source of a Europa Scientific 20–20 Isotope Ratio Mass Spectrometer. The reference material used during δ13C analysis was IA-R001 (wheat flour, δ13CV-PDB = −26.43 ‰). For quality control purposes, samples of standards IA-R001, IA-R005 (beet sugar, δ13CV-PDB = −26.03 ‰) and IA-R006 (cane sugar, δ13CV-PDB = −11.64 ‰) were also analysed. IA-R001, IA-R005 and IA-R006 are calibrated against and traceable to IAEA-CH-6 (sucrose, δ13CV-PDB = −10.43‰). IAEA-CH-6 is an inter-laboratory comparison standard distributed by the International Atomic Energy Agency, Vienna. δ13C values were expressed in conventional delta notation, which is the per mil deviation from the Vienna Pee Dee belemnite (V-PDB) standard. Precision for δ13C was c. ± 0.08‰. All analytical data are summarized in online Supplementary Material Table S1.
The relative contributions of organic matter from terrestrial C3 and C4 plants and marine phytoplankton were calculated from a three-end-member simple mixing model using the isotope mass-balance equation of
 $${\rm{{\delta }}^{{\rm{13}}}}{{\rm{C}}_{{\rm{sample}}}}{\rm{ \,=\, }}{{\rm{f}}_{\rm{1}}}{\rm{(}}{{\rm{\delta }}^{{\rm{13}}}}{{\rm{C}}_{\rm{3}}}{\rm{) \,+\, }}{{\rm{f}}_{\rm{2}}}{\rm{(}}{{\rm{\delta }}^{{\rm{13}}}}{{\rm{C}}_{\rm{4}}}{\rm{) \,+\, }}{{\rm{f}}_{\rm{3}}}{\rm{(}}{{\rm{\delta }}^{{\rm{13}}}}{{\rm{C}}_{{\rm{MP}}}}{\rm{)}}$$
where f1, f2 and f3 represent the fractional contribution of organic matter from C3 and C4 land plants and marine phytoplankton (MP), respectively. δ13C3, δ13C4 and δ13CMP represent the isotope ratios of the three end-members of C3 and C4 plants and marine organic matter, respectively. δ13Csample represents the measured δ13C value of a given sample. Assuming the three end-members are the major sources of organic matter, the sum of the three fractions should be equal to unity. Therefore,
 $${{\rm{f}}_{\rm{1}}}{\rm{ \,+\, }}{{\rm{f}}_{\rm{2}}}{\rm{ \,+\, }}{{\rm{f}}_{\rm{3}}}{\rm{ = 1}}$$
A unique solution for equations (1) and (2) is underdetermined mathematically as it involves three variables in two equations. However, the most feasible solution can be decided by using the source partitioning mixing model (IsoSource), which was developed by Phillips & Gregg (Reference Phillips and Gregg2001, Reference Phillips and Gregg2003, Reference Phillips and Gregg2005) based on the isotope mass-balance equation.
The program IsoSource (version 1.3) was used to calculate the relative contributions of organic matter at Site U1457 from C3 and C4 terrestrial plants and marine phytoplankton. In general, δ13C values of organic matter are different among terrestrial C3 plants (−30 to −23 ‰; Smith & Epstein, Reference Smith and Epstein1971), C4 plants (−17 to −9 ‰; Smith & Epstein, Reference Smith and Epstein1971) and marine phytoplankton (−22 to −19 ‰; Fry & Sherr, Reference Fry and Sherr1984). In this study, mean δ13C values of C3 plants (−26 ‰), C4 plants (−13 ‰) and marine phytoplankton (−21 ‰) were assumed as end-members from previous literature (Fontugne & Duplessy, Reference Fontugne and Duplessy1986; Calvert et al. Reference Calvert, Pedersen, Naidu and von Stackelberg1995; Maya et al. Reference Maya, Soares, Agnihotri, Pratihary, Karapurkar, Naik and Naqvi2011; Krishna et al. Reference Krishna, Naidu, Subbaiah, Sarma and Reddy2013; Cowie et al. Reference Cowie, Mowbray, Kurian, Sarkar, White, Anderson, Bergnaud, Johnstone, Brear, Woulds, Naqvi and Kitazato2014), because the direct measured data were not available. The IsoSource model gives a range of feasible source contributions. For the graphical representation of the data, the mean (50 percentile) value of the range of feasible contributions from each source was taken for every sample (online Supplementary Material Fig. S1). A measurement error of ± 0.08 ‰ in the δ13C analysis of samples and each end-member (C3, C4 and MP) was included in the calculation of the most feasible source contributions by setting a mass-balance tolerance of 0.1 ‰ (Phillips & Gregg, Reference Phillips and Gregg2001) in the model.
3. Results
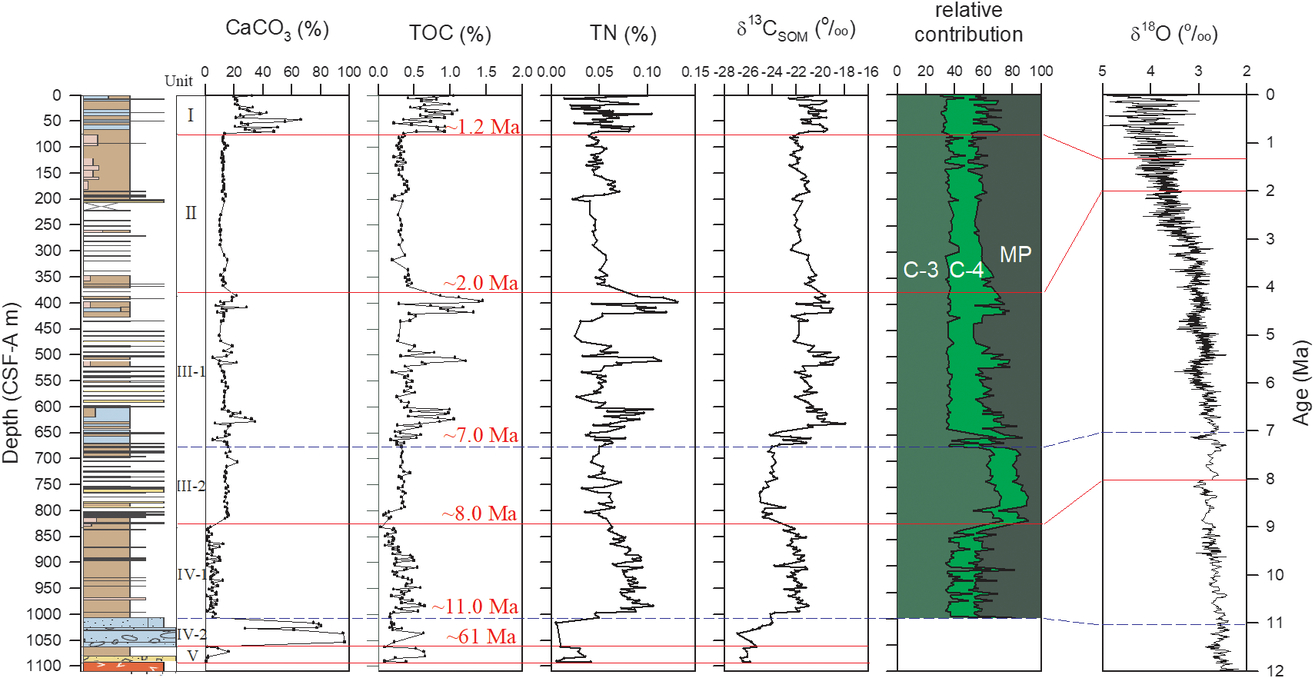
The five lithologic units (I to V) at Site U1457 are characterized by a different depositional environment (Pandey et al. Reference Pandey, Clift and Kulhanek2016), although this study does not specify each depositional condition. Based on preliminary examination of the sediment mineralogy, the Indus River, whose sediment load is currently ∼250 × 106 tons yr−1 (Milliman & Syvitski, Reference Milliman and Syvitski1992), might have been the main sediment supplier to Site U1457 in the eastern Arabian Sea (Pandey et al. Reference Pandey, Clift and Kulhanek2016). Because of insufficient age constraints and several long hiatuses, downcore profiles of geochemical properties (CaCO3, TOC and TN) and δ13CSOM values at Site U1457 were plotted using a depth scale, and not chronologically. Instead, the ages of the lithologic unit boundaries were estimated from the interpolation of shipboard age data (Pandey et al. Reference Pandey, Clift and Kulhanek2016).
The geochemical properties, δ13CSOM values and their variations at Site U1457 support the recognition of five lithologic units at Site U1457 (Fig. 3). The variation in geochemical properties is similar to that of the preliminary shipboard measurements (Pandey et al. Reference Pandey, Clift and Kulhanek2016). Some analytical data (TOC, TN and δ13CSOM) at Site U1457 are also comparable to those from low-resolution measurements at Site U1456 (Tripathi et al. Reference Tripathi, Tiwari, Lee and Khim2017). In this study, the geochemical properties and δ13CSOM values suggest that units III (∼450 m in thickness) and IV (∼225 m in thickness) can be further divided into two subunits (1 and 2). In particular, units III-1 and III-2 are distinctly differentiated by TOC contents (c. 0.59% versus c. 0.29 %) and δ13CSOM values (c. −20.8‰ versus c. −24.2‰), whereas units IV-1 and IV-2 are clearly discriminated by CaCO3 contents (c. 4.9% versus c. 74.2%), TN contents (c. 0.078% versus c. 0.005%) and δ13CSOM values (c. −22.1 ‰ versus c. −25.2 ‰).
Downcore geochemical properties (CaCO3, TOC and TN contents), δ13CSOM values and relative contributions to δ13CSOM values from C3 plants, C4 plants and marine phytoplankton (MP) at Site U1457. For lithology refer to the legend in Figure 2; a detailed lithology was described in Pandey et al. (Reference Pandey, Clift and Kulhanek2016). The ages of lithologic unit boundaries estimated from the interpolation of shipboard age data (Pandey et al. Reference Pandey, Clift and Kulhanek2016) are correlated to the global climate change during the last 11 Ma shown using δ18O from Zachos et al. (Reference Zachos, Pagani, Sloan, Thomas and Billups2001).

All geochemical (CaCO3, TOC and TN) data and δ13CSOM values at Site U1457 are summarized for each lithologic unit in terms of mean, maximum and minimum (Table 1). Unit I is characterized by high CaCO3 (c. 31.5 %) and high TOC (c. 0.71 %) contents and high δ13CSOM values (c. −20.6‰), as well as by large variations and frequent fluctuations in values/contents (Fig. 3). Fluctuations in TOC and TN contents in Unit I seem to be in parallel with the δ13CSOM values. The high CaCO3 component is biogenic carbonate ooze (Pandey et al. Reference Pandey, Clift and Kulhanek2016). The geochemical properties and δ13CSOM values of Unit II are almost consistent or lower than those of Unit I, showing low CaCO3 contents (c. 12.5%), low TOC contents (c. 0.33 %), moderate TN contents (c. 0.049%) and relatively high δ13CSOM values (c. −21.6‰). Although the CaCO3 contents (c. 14.8%) of Unit III-1 are similar to those of Unit II, this unit also presents three distinct concurrent peaks in TOC content (max. 1.45%), TN content (max. 0.132%) and δ13CSOM values (max. −17.9‰). High TN content (c. 0.065%) was associated with high TOC content (c. 0.59%) in Unit III-1. The geochemical properties (CaCO3c. 15.1 %; TOC c. 0.29 %; TN c. 0.053%) of Unit III-2 are similar to those of Unit II, but δ13CSOM values (c. −24.2‰) are obviously lower. Unit IV-1 is most characterized by very low CaCO3 contents (c. 4.9%) and noticeably high TN contents (c. 0.078%), although TOC contents (c. 0.31%) are not high. Unit IV-2 shows the highest CaCO3 contents (c. 74.2%) and the lowest TN contents (c. 0.005%) with fairly low δ13CSOM values (c. −25.2‰). Differing from Unit I, the CaCO3 component of this unit is detrital carbonate rock (Pandey et al. Reference Pandey, Clift and Kulhanek2016). Similar to Unit IV-1, Unit V is lacking in CaCO3 content (c. 4.5%), and similar to Unit IV-2, Unit V is characterized by extremely low δ13CSOM values (c. −26.1‰).
Based on the three-end-member simple mixing model, the relative contributions of organic matter from terrestrial C3 and C4 plants and marine phytoplankton is depicted in Figure 3. As described previously, the simple model deals with only δ13C values to discriminate these three components. That is why the results encompass somewhat unreliable estimates and sometimes may be overestimated or underestimated. Despite the limitation of absolute estimates, the relative contributions among the three components can be emphasized to indicate which component is an important contributor. In the present study of δ13CSOM values, the underlying assumption is that, within the SOM in the eastern Arabian Sea, the marine organic matter derived from in situ biological production was mixed with the terrestrial organic matter of C3 and C4 type plants. Based on the simple calculation, the most feasible contributions from C3 and C4 plants and marine phytoplankton were estimated to be in the range of 29 to 74%, 15 to 48 %, and 9 to 50%, respectively (Fig. 3). The prominent increase (more than 65%) in C3 terrestrial organic matter is distinct in Unit III-2, which corresponds to low δ13CSOM values during this interval. Another noticeable appearance of intermittent peaks (up to 48%) in C4 land plants occurred in Unit III-1. In addition, the frequent fluctuations between C3 and C4 components are interesting in Unit I.
4. Discussion
4.a. Terrestrial contribution from TOC and TN ratios and δ13C values
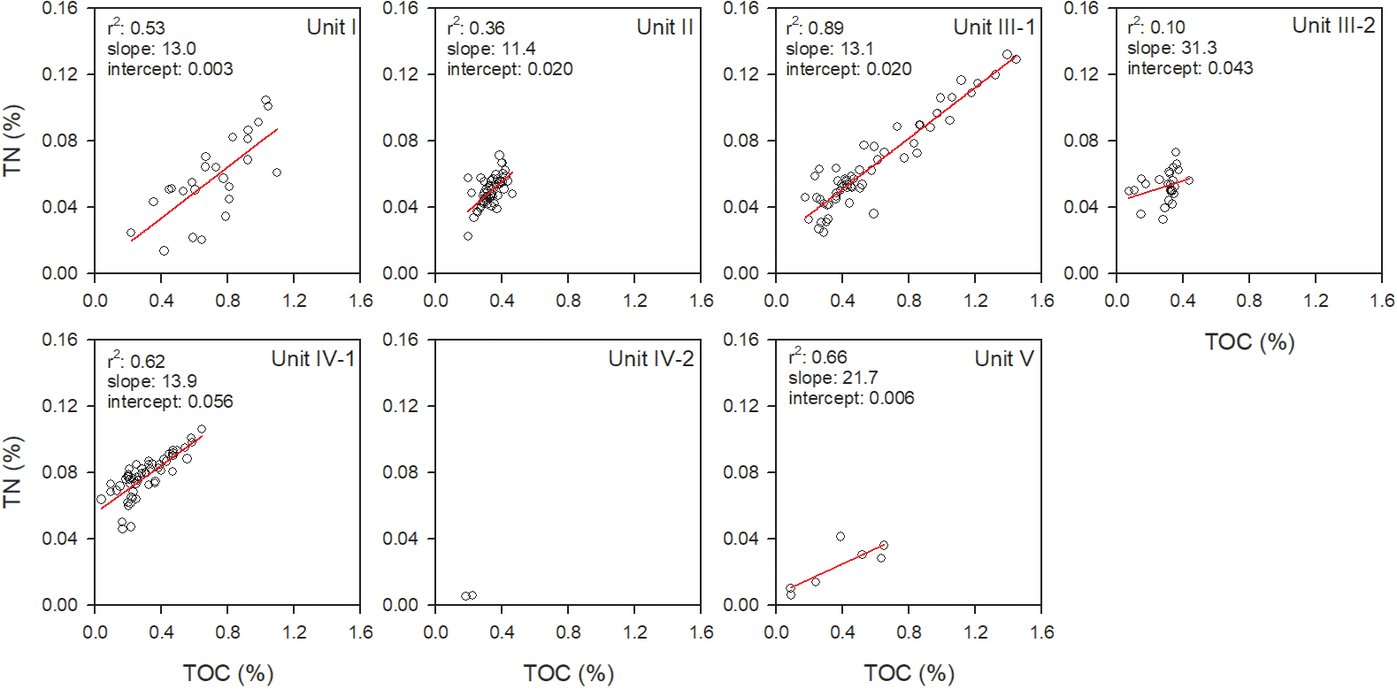
In general, the greater amount of organic matter within the marine sediments, expressed as TOC and TN content, is related to increased primary productivity, enhanced preservation potential, higher sedimentation rate and/or more input of terrestrial components aside from early diagenesis (e.g. Stein, Reference Stein1991). It is of note that the variation pattern between TOC and TN contents throughout the sedimentary sequence is very similar at Site U1457 (Fig. 3), indicating that their production is from the same process. C/N (TOC/TN) ratios of these sediments allow the discrimination of the origin of organic matter (Meyers, Reference Meyers1994) and the evaluation of preferential remineralization of the protein composition (Mayer, Reference Mayer, Engel and Macko1993). For example, higher C/N ratios are generally attributed to more terrestrial organic matter. A C/N ratio higher than that of fresh algal organic matter is also attributed to selective loss of nitrogen-rich protein constituents during deposition. However, the latter condition is commonly observed in elevated marine productivity areas such as upwelling systems (Meyers, Reference Meyers1997). Figure 4 shows the correlation between TOC and TN contents for the lithologic units, showing that the slope (i.e. C/N ratio) for each lithologic unit is slightly different (from ∼11 to ∼31), attributable to the contribution of the terrestrial component (Stein, Reference Stein1991).
Relationship between total organic carbon (TOC) and total nitrogen (TN) contents for each lithologic unit at Site U1457. The y-intercept of each linear correlation represents the amount of inorganic nitrogen, which is high in units III-1, III-2 and IV-1. Note that only two samples were measured in Unit IV-2 because the total nitrogen content is below the limit of detection by elemental analyser.

The relationship between TOC and TN contents also provides a signal of the inorganic fraction of total nitrogen. Rather than its slope, the intercepts represent the amount of inorganic nitrogen delivered by adsorption of ammonium to clay minerals, which protects the organic fraction during the degradation of organic matter (Müller, Reference Müller1977). The intercept of the linear correlation between TOC and TN contents is distinctly large, particularly for units III-1 (0.020%), III-2 (0.043%) and IV-1 (0.056%) at Site U1457, reflecting that a large fraction of inorganic nitrogen was contained within the sediments in these units (Fig. 4). The incorporation of inorganic nitrogen is usually typical of deep-sea sediments (e.g. Stevenson & Cheng, Reference Stevenson and Cheng1972). Thus, after adjustment for the incorporated fraction of inorganic nitrogen, C/N ratios of these lithologic units consequently increased, indicating the possibility that more terrestrial organic matter contributed to the deposition of these lithologic units. Pandey et al. (Reference Pandey, Clift and Kulhanek2016) reported that units III and IV are characterized by distal turbidity current and mass-transport deposits, respectively. Hence, preservation of terrestrial organic matter within these lithologic units appears more favourable.
The TOC contents and their δ13C values provide information on the degree of marine productivity in the surface water as well as on the contribution of terrestrial organic matter. Although only a small fraction of the organic matter assimilated in the surface water is ultimately preserved in the deep-sea bottom sediments (Meyers, Reference Meyers1994), variation in TOC content in the marine sediments has been accepted as a productivity proxy, despite other influential factors such as redox conditions, sedimentation rate and influx of terrigenous matter (Schoepfer et al. Reference Schoepfer, Shen, Wei, Tyson, Ingall and Algeo2015). The Arabian Sea is characterized by a monsoon climate (Schott & McCreary, Reference Schott and McCreary2001). Strengthened monsoon winds result in enhanced productivity in the Arabian Sea. For example, a strong summer monsoon causes increased upwelling, leading to enhanced productivity along the western margin of the Arabian Sea (e.g. Reichart et al. Reference Reichart, Den Dulk, Visser, Van Der Weijden and Zachariasse1997; Schulte et al. Reference Schulte, Rostek, Bard, Rullkötter and Marchal1999), whereas a dominant winter monsoon activates productivity via increased nutrient injection to the surface water along the eastern margin of the Arabian Sea (e.g. Thamban et al. Reference Thamban, Rao, Schneider and Grootes2001; Pattan et al. Reference Pattan, Masuzawa, Naidu, Parthiban and Yamamoto2003; Banakar et al. Reference Banakar, Oba, Chodankar, Kuramoto, Yamamoto and Minagawa2005; Naik et al. Reference Naik, Saraswat, Lea, Kurtarkar and Mackensen2017). In particular, because the strengthened summer monsoon climate is associated with heavy precipitation and increased river discharge, terrestrial particles and organic matter might have contributed more to deposition in the Arabian Sea. Thus, TOC contents and δ13C values would increase during the high production of marine organic matter. Figure 5 displays the biplot between TOC content and δ13CSOM value at Site U1457 with respect to the lithologic units. The relationship between TOC content and δ13CSOM value is slightly linear for units I, III-1 and IV-1. Such a positive correlation seems dependent on the degree of marine productivity (Azharuddin et al. Reference Azharuddin, Govil, Singh, Mishra, Agrawal, Tiwari and Kumar2017; Nagoji & Tiwari, Reference Nagoji and Tiwari2017), demonstrating that these units were influenced by the increase in marine production.
Relationship between TOC content and δ13CSOM value for each lithologic unit at Site U1457.

4.b. Terrestrial catchment conditions from δ13C values of sedimentary organic matter
In the shallow marine and coastal environment of western India, low δ13C values have been measured for suspended particulate organic matter (−30.6 to −27.2‰) and estuarine sediments (−25.2 to −23.6‰) (Maya et al. Reference Maya, Soares, Agnihotri, Pratihary, Karapurkar, Naik and Naqvi2011; Cowie et al. Reference Cowie, Mowbray, Kurian, Sarkar, White, Anderson, Bergnaud, Johnstone, Brear, Woulds, Naqvi and Kitazato2014). These results confirm that δ13C values of terrestrial organic matter generally centre around −26‰ (Fontugne & Duplessy, Reference Fontugne and Duplessy1986). The δ13C values become higher across the shelf and the shelf break (−19.4 to −21.3‰; Cowie et al. Reference Cowie, Mowbray, Kurian, Sarkar, White, Anderson, Bergnaud, Johnstone, Brear, Woulds, Naqvi and Kitazato2014) to the slope (−20‰; Calvert et al. Reference Calvert, Pedersen, Naidu and von Stackelberg1995) of the eastern Arabian Sea. Agnihotri et al. (Reference Agnihotri, Bhattacharya, Sarin and Somayajulu2003) reported that mean δ13CSOM values of surface sediments along the western continental margin of India and of the Holocene sediments are −20.3 ‰ and −20.1 ‰, respectively, supporting the dominance of marine phytoplankton (−22 to −19 ‰; Fry & Sherr, Reference Fry and Sherr1984). Naik et al. (Reference Naik, Godad, Naidu, Tiwari and Paropkari2014) also obtained similar δ13CSOM values (−22 to −21‰) for Holocene sediments in the eastern Arabian Sea, emphasizing that deposition of organic matter has been mostly of marine origin. In contrast, according to the broad range of δ13CSOM values (−23.2 to −16.7‰), the eastern continental margin of India is characterized by a mixture of terrestrial and marine organic matter (Krishna et al. Reference Krishna, Naidu, Subbaiah, Sarma and Reddy2013).
Fontugne & Duplessy (Reference Fontugne and Duplessy1986) observed that the input of terrestrial organic matter was not significantly different between the Holocene and Last Glacial Maximum in the Arabian Sea. In contrast, Thamban et al. (Reference Thamban, Rao, Schneider and Grootes2001) invoked that a higher input of terrestrial organic matter occurred during the period of reduced productivity, although most δ13CSOM values (−19.5 to −21.6 ‰) of Holocene sediments are representative of a marine origin along the southwestern continental margin of India. Thus, although δ13CSOM values are related to marine productivity change as demonstrated by Sarnthein et al. (Reference Sarnthein, Winn, Duplessy and Fontugne1988), the variation in δ13CSOM values clearly indicates the degree of terrestrial organic matter contribution.
δ13CSOM values of Unit I fluctuate between −22.6‰ and −19.4 ‰ during the last ∼1.2 Ma when orbital-scale climate changes were distinct (Table 1). Unit I is composed of alternations between pelagic/hemipelagic sedimentation (nannofossil ooze with foraminifera-rich nannofossil ooze and nannofossil-rich clay) and turbidite layers (interbedded silty clay and silty sand) (Pandey et al. Reference Pandey, Clift and Kulhanek2016). These fluctuations are likely related to the orbital-scale change, despite the poor age constraints and low-resolution sampling in this study. Because our sampling centred on the hemipelagic and turbidite sediments, the low (c. −22.0 ‰) and high (c. −19.0 ‰) δ13CSOM values in Unit I represent the contribution of terrestrial and marine organic matter, respectively, to Site U1457 (Laxmi Basin) during the middle to late Pleistocene period. Model results show that the relative contributions of organic matter from terrestrial plants and marine phytoplankton also reproduce the frequent fluctuations between these end-members (Fig. 3).
Based on the model estimate, the δ13CSOM values (c. −22.0 ‰) in Unit I represent a greater contribution from marine phytoplankton (∼42%), compared to C3 (∼34%) and C4 (∼24 %) plants (Fig. 3). The land plants in the catchment area seem to have been more dominated by C3 biomass during the middle to late Pleistocene period, although the manifestation of C4 plants is difficult to resolve in this study. The low δ13CSOM values are similar between units I and II (Table 1). Unit II consists of terrigenous sediments such as sandy silt and silty claystone, which are interpreted as turbidites deposited in a distal basin plain environment rather than an active proximal lobe (Pandey et al. Reference Pandey, Clift and Kulhanek2016). The lower Pleistocene Unit II is also characterized by a very high sedimentation rate (∼58 cm ka−1). Despite no clear observation of orbital-scale fluctuations, Unit II contains a steady contribution of terrestrial organic matter from dominant C3 land plants in the catchment environment, as confirmed by the relative contribution change based on the model (Fig. 3). Thus, it is reasonable to suggest that C3 land plants were predominant relative to C4 land plants in the catchment environment over the last 2 Ma.
The δ13CSOM values at Site U1457 are different in the lower lithologic units (Table 1). Compared to units I and II, units III-1, III-2 and IV-1 are characterized by slightly lower δ13CSOM values (Fig. 3) as well as by a large inorganic nitrogen fraction (Fig. 4). In particular, the δ13CSOM values of Unit III-2 are clustered at c. −24‰ (Fig. 5). These units (III-1, III-2 and IV-1) represent mostly redeposited turbidite sediments (Pandey et al. Reference Pandey, Clift and Kulhanek2016). For example, rip-up clasts of deformed claystone patches commonly observed within sandstone indicate rapid sedimentation from a high-energy, erosive current (i.e. turbidity currents). In addition, occurrence of tiny wood fragments implies that the sediments were transported from a terrestrial environment, which is also supported by the high inorganic nitrogen. These lower δ13CSOM values may be attributed to either a relative reduction in marine productivity or enhanced contribution of C3 plants. Because TOC content differs among these units, marine productivity is an unlikely explanation for the lower δ13CSOM values. Instead, the contribution of terrestrial organic matter might have increased, particularly between ∼8 and ∼7 Ma, from the catchment areas occupied by dominant C3 plants (∼67 %). However, Burbank et al. (Reference Burbank, Derry and France-Lanord1993) reported that the reduced sediment accumulation in the Bengal Fan at 8 Ma was due to a decrease in mechanical weathering by monsoon intensification, in contrast to the increased sedimentation rate supplying more terrestrial organic matter to the Laxmi Basin between ∼8 Ma and ∼7 Ma. Nonetheless, although the catchment environment of the Arabian Sea maintained dominant C3 land plants, the contribution of terrestrial organic matter might have differed, depending on the formation of lithologic units during the last ∼11 Ma.
Summary of geochemical and isotope values of lithologic units at Site U1457

Unit III-1 is distinctly characterized by several peaks in TOC and TN content and δ13CSOM values from ∼7 Ma to ∼2 Ma with a hiatus of ∼2 Ma (Fig. 3). These concurrent peaks and a positive correlation between TOC content and δ13CSOM value in Unit III-1 are likely a result of enhanced marine productivity during late Miocene to Pliocene times. However, the high δ13CSOM values (c. −17 ‰) in Unit III-1 are much higher than those (c. −19 ‰) of Unit I. Thus, rather than increased marine productivity, a higher contribution of terrestrial organic matter of high δ13CSOM values is a better explanation for these peaks and the higher δ13CSOM values in Unit III-1. The high inorganic nitrogen (0.020 %) of Unit III-1 implies a greater amount of clay minerals provided from the nearby continent. Because the δ13CSOM values of these peaks are higher than those (−22‰ to −19‰; Fry & Sherr, Reference Fry and Sherr1984) of marine phytoplankton, terrestrial organic matter in the catchment area should have been generated from C4 plants during these intervals, although C3 land plants were widespread during the formation of Unit III-1. Based on the three-end-member simple mixing model, the relative contributions of organic matter from terrestrial C3 and C4 plants and marine phytoplankton also show the increase (∼28 %) in C4 plants (Fig. 3). δ13C values of fatty acid at Site U1457 reflect the distinct shift from C3 to C4 plants in the same unit (Kenta Suzuki, pers. comm.) Corresponding high δ13CSOM values were also observed at ∼7.4 Ma at Site U1456 (Tripathi et al. Reference Tripathi, Tiwari, Lee and Khim2017). Based on the measurement of plant wax carbon and hydrogen isotopes at Site U1456, Liddy et al. (Reference Liddy, Feakins, Clift, Tauxe, Kulhanek, Scardia, Warny, Bendle, Galy and Zhou2016) discovered the expansion of C4 grassland in the Indus floodplains and a shift of dominant moisture source region at ∼7 Ma. The appearance of a δ13CSOM peak at ∼7 Ma in Unit III-1 at Site U1457 coincides with the δ13C shift of pedogenic carbonate in the Siwalik Group (northern Pakistan; Quade et al. Reference Quade, Cerling and Bowman1989) and the δ13CSOM change in turbidite sediments in the Bengal Fan (France-Lanord & Derry, Reference France-Lanord and Derry1994), both of which indicate dramatic terrestrial climate change and the dominance of C4 biomass in the Himalayan foreland. C3/C4 vegetation shifts are controlled mainly by diverse ecological conditions such as precipitation, temperature and the partial pressure of atmospheric carbon dioxide (Collatz et al. Reference Collatz, Berry and Clark1998). Nonetheless, the wide occurrence of C4 plants in the catchment area and a greater contribution of this terrestrial organic matter was observed at ∼7 Ma in the eastern Arabian Sea.
Figure 3 shows that very low δ13CSOM values (c. −25.2‰) at Site U1457 were measured in Unit IV-2, which is characterized by very high CaCO3 content and, thus, these low δ13CSOM values may reflect relatively more contribution of organic matter from terrestrial C3 plants to this unit. It should be noted that Unit IV-2 is formed by an upper Miocene large-scale mass-transport deposit consisting of calcarenite and calcilutite, breccia and limestone (Fig. 3). Equivalent and thicker mass-transport deposits were also observed at Site U1456 (Pandey et al. Reference Pandey, Clift and Kulhanek2016). These shallow-water detrital carbonates, emplaced as coherent rafts or boulders, represent transportation from the Indian continental margin, not in situ carbonate sedimentation, as Calvès et al. (Reference Calvès, Huuse, Clift and Brusset2015) proposed. Thus, δ13CSOM values for this unit may not be pristine. Despite the very small number of analysed samples, Unit IV-2 is also characterized by extremely low TN contents (c. 0.005%). Therefore, there is a possibility that the very low δ13CSOM values of Unit IV-2 might be affected by another unknown reason such as isotope fractionation during carbonate lithification.
The lowest δ13CSOM value was observed in Unit V (c. −26.1‰). The lower Paleocene Unit V, directly overlying the basaltic basement, consists mostly of claystone and volcaniclastic breccia as well as volcaniclastic sedimentary rocks with a wide range of grain sizes (Pandey et al. Reference Pandey, Clift and Kulhanek2016). Such a volcanic signature was apparent by the inclusion of volcanic glass and the identification of smectite with a distinct peak intensity. This lithologic unit is also characterized by very low TN contents (c. 0.024%) (Fig. 3). Thus, the extremely low δ13CSOM values may be attributed to the preferential degradation of labile organic compounds. In addition, because the appearance of C4 land plants during this unit (lower Paleocene) is not supported, other data are required for the interpretation of the low δ13CSOM values of the lower Paleocene sediments. Hence, the inference of catchment environmental conditions before ∼11 Ma is difficult given the low δ13CSOM values of Unit V similar to Unit IV-2 at Site U1457.
5. Conclusions
IODP Expedition 355 drilled the huge sedimentary deposit (the Indus Fan) to 1108.6 m at Site U1457 in the Laxmi Basin of the eastern Arabian Sea, which is well known for its seasonal monsoon climate. The five onboard-defined lithologic units at Site U1457 were corroborated by geochemical (CaCO3, TOC and TN) and isotopic (δ13CSOM) properties, which further divided units III and IV into two subunits (1 and 2). The relationship between TOC and TN contents of the lithologic units demonstrates that the slope (i.e. C/N ratio) of each lithologic unit indicates the contribution of terrestrial components as well as preferential remineralization of the protein composition. In particular, the intercept of the linear correlation between TOC and TN contents provides the amount of inorganic nitrogen, reflecting the terrestrial influence. High inorganic contents in units III-1, III-2 and IV-1 might be attributed to the adsorption of ammonium to clay minerals, supporting better preservation of terrestrial sediments formed by distal turbidity current and mass-transport deposits. Most of the low δ13CSOM values reflect the contribution of terrestrial organic matter from the catchment areas where C3 land plants have been dominant since late Miocene time. However, the appearance of high δ13CSOM values during deposition of Unit III-1 (7 to ∼2 Ma) might be attributed to an ecological shift in which C3 biomass was replaced by C4 biomass in the catchment environment. The three-end-member simple mixing model, based on δ13CSOM values, provides the relative contributions of organic matter from terrestrial C3 and C4 plants and marine phytoplankton, supporting the ecological shift in the terrestrial catchment environment. Although the main controlling factors for the C3/C4 vegetation shifts are still under debate, the appearance of dominant C4 biomass in the Himalaya foreland at ∼7 Ma reflects dramatic climate change, including enhanced terrestrial aridity. Thus, palaeoclimate change should require close linkage to the palaeoceanographic variation related to monsoon intensification in the Arabian Sea, which supports the tectonic–climate interaction caused by the uplift of the Himalaya–Tibetan Plateau.
Author ORCIDs
Boo-Keun Khim 0000-0002-0229-7990; Dhananjai K. Pandey 0000-0001-6899-8995
Acknowledgements
This research used samples provided by IODP, and data collected onboard the vessel JOIDES Resolution (IODP Expedition 355-Arabian Sea Monsoon). Constructive comments by two anonymous reviewers for the improvement of data interpretation were greatly appreciated. A National Research Foundation of Korea grant (2016R1A2B4008256) was appreciated for the completion of this study.
Supplementary material
To view supplementary material for this article, please visit https://doi.org/10.1017/S0016756818000870.
Consortia
IODP Expedition 355 Scientists:
Sergio Ando1, James A.P. Bendle2, Sophia Aharonovich3, Gundiga P. Gurumurthy4, Annette Hahn5, Masao Iwai6, Anil Kumar7, A. Ganesh Kumar8, Hannah M. Liddy9, Huayu Lu10, Mitchell W. Lyle11, Ravi Mishra12, Tallavajhala Radhakrishna13, Claire M. Routledge14, Rajeev Saraswat15, Rakesh Saxena16, Giancarlo Scardia17, Girish K. Sharma18, Arun D. Singh19, Lisa Tauxe20, Zhaojie Yu21
1Department of Earth and Environmental Sciences, University of Milano-Bicocca, Piazza della Scienza 4, 20126 Milan, Italy
2School of Geography, Earth and Environmental Sciences, University of Birmingham, Edgbaston, Birmingham, B15 2TT, United Kingdom
3Department of Earth and Planetary Sciences, Faculty of Science and Engineering, Macquarie University, Level 2, The Australian Hearing Hub, 16 University Avenue, Sydney, NSW 2109, Australia
4Manipal Centre for Natural Sciences, Manipal University, Dr. T.M.A. Pai Planetarium Building, Manipal 576104, India
5MARUM, University of Bremen, Leobener Strasse, 28359 Bremen, Germany
6Center for Advanced Marine Core Research/Natural Science Cluster, Kochi University, 2-5-1 Akebono-cho, Kochi 780-8520, Japan
7Wadia Institute of Himalayan Geology, 33 GMS Road, Dehradun Uttrakhand 248001, India
8Marine Biotechnology Department, National Institute of Ocean Technology, Velachery-Tambaram Main Road, Pallikaranai, Chennai 600100, India
9Department of Earth Sciences, University of Southern California, 3651 Trousdale Parkway, Los Angeles CA 90089, USA
10School of Geographical and Oceanographical Sciences, Nanjing University, 163 Xianlin Avenue, Nanjing 210023, China
11College of Earth, Ocean and Atmospheric Sciences, Oregon State University, 104 CEOAS Administration Building, Corvallis OR 97331, USA
12IODP-India National Centre for Antarctic and Ocean Research (NCAOR), Vasco da Gama, Goa 403804, India
13Geosciences Division, National Centre for Earth Science Studies, Aakkulam, Trivandrum 695031, India
14University College London, Gower Street, London WC1E 6BT, United Kingdom
15Geological Oceanography Division, National Institute of Oceanography, Dona Paula, Goa 403004, India
16ONGC 11 High, Bandra-Sion Link Road, Mumbai 400017, India
17Instituto de Geociências e Ciências Exatas, Universidade Estadual Paulista, 1515 Avenida 24-A Rio Claro SP 13506-900, Brazil
18Department of Geology, Kumaun University, Nainital 263002, India
19Department of Geology, Banaras Hindu University, Varanasi, Uttar Pradesh 221005, India
20Scripps Institution of Oceanography, 9500 Gilman Drive, La Jolla CA 92093-0220, USA
21Laboratoire Géosciences Paris-Sud (GEOPS, UMR8148-CNRS), Université de Paris-Sud (Orsay) Bâtiment 504 91405, Orsay Cedex, France