

DISCUSSION POINTS
-
• The current rate of carbon emissions is 10 times larger than the worst “climate catastrophes” known in Earth history.
-
• There is no uncertainty in the contribution of fossil fuel emissions to the current carbon problem—they are ALL of it!
-
• Earth's carbon cycles work in an extraordinary way to maintain its habitability; perturbing them to the extent we are doing is a serious matter.
Introduction: Climate change and carbon cycle(s)
Discussion of climate change usually focuses on the rise of Earth's global average surface temperature. Because of the variability in temperature—daily, weekly, seasonal, annual, decadal—and the seemingly small temperature rise Reference Ciais, Sabine, Bala, Bopp, Brovkin, Canadell, Chhabra, DeFries, Galloway, Heimann, Jones, Le Quéré, Myneni, Piao, Thornton, Stocker, Qin, Plattner, Tignor, Allen, Boschung, Nauels, Xia, Bex and Midgley15 (about 1 °C) recorded so far, global surface temperature increase is difficult to appreciate for many people. 61 The more dramatic effects of warming—melting glaciers and sea ice—are happening in high latitude regions where few people live. The observed temperature increase is itself misleading; although seemingly modest, it is an underestimate of the effect, because the temperature will continue to rise based on the current greenhouse gas content of the atmosphere and the projected continued emissions. The temperature rise to date is only a fraction of that already programmed into the Earth system. Reference Ciais, Sabine, Bala, Bopp, Brovkin, Canadell, Chhabra, DeFries, Galloway, Heimann, Jones, Le Quéré, Myneni, Piao, Thornton, Stocker, Qin, Plattner, Tignor, Allen, Boschung, Nauels, Xia, Bex and Midgley15,59
The root cause of climate change is what could be called “carbon cycle change.” To change climate, the amount of carbon dioxide and other so-called greenhouse gases in the atmosphere needs to change. Reference Berner7,61,Reference Pierrehumbert67,Reference Ruddiman71 To change the amount of CO2 in the atmosphere, there must be a change in the way carbon is transferred among the various forms and places it exists in and on the Earth. The movement of carbon between storage “reservoirs” on the Earth, including the atmosphere, is complicated and still under investigation. Reference Ciais, Sabine, Bala, Bopp, Brovkin, Canadell, Chhabra, DeFries, Galloway, Heimann, Jones, Le Quéré, Myneni, Piao, Thornton, Stocker, Qin, Plattner, Tignor, Allen, Boschung, Nauels, Xia, Bex and Midgley15,Reference Houghton34,Reference Sigman and Boyle77 This study is an attempt to present a simplified version of the carbon cycle, to place the current discussions of climate change in a geological perspective and provide an entry point for those wishing to understand more about carbon and climate. Most parts of this story have been explained at various levels of detail and depth, and several insightful recent reviews have been published, Reference Archer, Eby and Brovkin2,Reference Schmitz80,Reference Zeebe88 including the most recent update of the Intergovernmental Panel on Climate Change (IPCC) reports, which constitute comprehensive, although quite technical, reviews. Reference Ciais, Sabine, Bala, Bopp, Brovkin, Canadell, Chhabra, DeFries, Galloway, Heimann, Jones, Le Quéré, Myneni, Piao, Thornton, Stocker, Qin, Plattner, Tignor, Allen, Boschung, Nauels, Xia, Bex and Midgley15
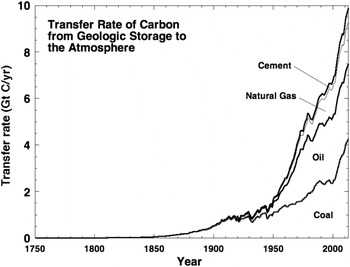
Unlike the global temperature signal, the changes in the carbon cycle in the last 100 years are not subtle (Fig. 1). These changes have been produced almost entirely by burning of fossil fuel, with a smaller (decreasing and less problematical in the long term) contribution from destruction of forests. Reference LeQuere44 Discussion of the human-induced changes has in some cases been muddied by comparison to the large rates of carbon exchange between atmosphere, biosphere, and oceans. These large exchange fluxes are neither the ones that have changed drastically nor are they particularly significant for understanding what is happening due to burning of fossil fuel. The main change, which is the focus of this study, is the rate that carbon is moved from deep Earth storage—in rocks—to the atmosphere. This transfer does happen naturally and is responsible for many familiar aspects of Earth, including the fact that the planet has maintained a hospitable climate that has allowed life to flourish for billions of years. Reference Kasting38,58,60,Reference Sleep, Zahnle and Neuhoff78 However, in the absence of human actions, the transfer is done mainly by volcanoes, and at a small rate. Reference Burton, Sawyer and Granieri11,Reference Gerlach29,Reference Morner and Etiope52 Fossil fuel burning has increased this transfer rate by at least 40–50 times (Fig. 2), which is not something that can argued about—the change is so huge that no likely level of uncertainty about the numbers can change the conclusion that virtually all the transfer of deep Earth carbon to the atmosphere is currently a result of fossil fuel burning and cement production. Reference Gerlach29 This radical change represents something that has never before been done on Earth, even if we look back hundreds of millions of years. It is the magnitude of fossil carbon emissions that is the problem, and this can be understood in terms of relatively simple concepts and bookkeeping.
Transfer rate of carbon from geologic storage as coal, oil, natural gas, and limestone to the atmosphere in units of GtC/yr. The major increases have occurred since 1850 and most of the increase has occurred since 1950.

Rates of transfer of carbon from geologic storage in rocks to the atmosphere from 1750 to 2014, plotted on a logarithmic scale and compared to natural geologic rates estimated for the modern Earth. Data on combustion and cement are from ORNL database. Geologic rates are from Ref. Reference Burton, Sawyer and Granieri11. Total geologic is the rate of carbon emission, mostly as CO2, from volcanic areas plus metamorphism in nonvolcanic mountain ranges. Estimates of total geologic emissions are close to the estimates of carbon removal from the atmosphere-ocean-biosphere system by sedimentation in the oceans Reference Nakamori56 and hence are likely to be reasonably accurate.

Over the past 50 years we have developed a good, although certainly not complete, understanding of how climate has changed on the Earth in the geologic past, and how it is related to the amount of atmospheric CO2 (National Research Council 2012; Ref. 61). The primary means of maintaining the surface temperature of the Earth is by capture and radiation of solar energy, and the relationship between greenhouse gas concentrations in the atmosphere and global surface temperatures is straightforward, Reference Arrhenius4 even if there are a number of issues worth continuing exploration. Reference Knutti and Hegerl43,Reference Pierrehumbert67 Research has also led to better and better estimates of the rates of carbon movement on the modern Earth and the size of various reservoirs where carbon is stored. Reference Ciais, Sabine, Bala, Bopp, Brovkin, Canadell, Chhabra, DeFries, Galloway, Heimann, Jones, Le Quéré, Myneni, Piao, Thornton, Stocker, Qin, Plattner, Tignor, Allen, Boschung, Nauels, Xia, Bex and Midgley15,Reference Kasting35 If one looks backward millions of years into deep geologic time, there are examples of times when the atmosphere contained higher amounts of CO2 than it has now, and this has occurred as a result of natural processes that can change the amount of atmospheric CO2 by large amounts, but only slowly over thousands or millions of years. Reference Berner7,Reference McInerney and Wing50,Reference Pearson and Palmer66,Reference Zachos, Dickens and Zeebe87 However, there were no humans on Earth during any of the previous times the atmospheric CO2 concentrations were high. Although it is uncertain whether high CO2 levels would have prevented humans from thriving at earlier times in Earth history, recent studies have shown that moderately elevated CO2 concentrations can affect human behavior. Reference Satish, Mendell, Shekhar, Hotchi, Sullivan, Streufert and Fisk75 And whether or not we fully understand the implications, it is nevertheless true that prior to about 1950 humans had not experienced atmospheric CO2 concentrations higher than about 300 ppm.
The natural carbon cycle(s)
The term carbon cycle refers to natural processes, such as volcanic eruptions, photosynthesis and respiration, weathering of rock to form soil, forest fires and forest growth, transport of dissolved chemicals in rivers, and the growth and death of marine organisms and their shells. These processes and others act in concert to move carbon around in the environment. The plural form “cycles” is used here mainly to call attention to the fact that there are rapid cycles of carbon embedded within slower, larger cycles. The term “cycle” implies that carbon is moved in and out of different storage sites, and over an extended period can circulate among those sites. The growth and flowering of trees and plants in Spring, and their death and loss of foliage in Autumn, are one of the most familiar parts of the carbon cycle. Plants grow by photosynthesis, which involves removing CO2 from the air, converting it to organic compounds that constitute the living things, and returning O2 to the atmosphere. When plants die they decompose, and this process takes O2 from the air and returns methane and CO2, and the methane soon gets converted to CO2. Every year, large amounts of carbon are transferred to living plants and animals and then returned to the atmosphere later. Reference Kasting35 Every year, the amount of CO2 in the atmosphere decreases a bit in the Northern hemisphere Spring and Summer, and then increases again in Fall and Winter. Reference Graven, Keeling, Piper, Patra, Stephens, Wofsy, Welp, Sweeney, Tans, Kelley, Daube, Kort, Santoni and Bent31,Reference Machta47,Reference Patra, Maksyutov and Nakazawa64
The annual cycle is an example of a rapid and large transfer of carbon between two “reservoirs,” in this case between the atmosphere and the land biosphere. Another example is transfer of atmospheric CO2 to and from the oceans. Because CO2 is soluble in water to some degree, and because gas transfer from air to the oceans occurs rapidly, there is a large exchange of carbon between the atmosphere and the oceans every year. Reference Keeling, Piper, Bacastow, Wahlen and Whorf39,Reference McNeil, Matear, Key, Bullister and Sarmiento51,Reference Sabine, Feely, Gruber, Key and Lee72,Reference Sarmiento74 Because the concentration of CO2 in the atmosphere has been rising, there is a net tendency for atmospheric CO2 to dissolve in the oceans although the total amount of transfer into and out of the oceans is about 30 times larger than the net transfer to the oceans. The ocean-atmosphere boundary is dynamic and CO2, water vapor, and other constituents are always evaporating from the ocean surface as well as being transferred from the atmosphere to the oceans. Living plant matter also is transformed into dead litter and stored in soil. Soil organic carbon is not static but tends to decompose through microbial activity and be returned to the atmosphere as CO2 or CH4. Reference Davidson and Janssens20,Reference Gaudinski, Trumbore, Davidson and Zheng28
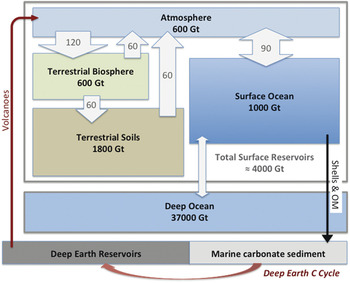
The four major surface reservoirs of carbon are depicted in “box model” form in Fig. 3 along with the next larger reservoir of carbon—the deep ocean. The four surficial storage sites for carbon (atmosphere, land biosphere, soils, surface ocean), which together contain roughly 4000 GtC (GtC signifies 109 metric tons of carbon), are the focal point for understanding what is happening with carbon in the modern world. The deep ocean also exchanges carbon with the four surface reservoirs, but we will begin the analysis first without considering the role of the deep ocean. The surface reservoirs exchange carbon so rapidly that the first step in understanding carbon cycle change is to think of the four surface reservoirs as a single Earth carbon reservoir. The rates of carbon transfer between these reservoirs are 60–120 GtC/yr. Reference Houghton34 Hence, from these exchange rates and the size of the reservoirs, it can be inferred that carbon does not remain in any of the four reservoirs much longer than a few decades. Reference Sigman and Boyle77 The transfer of carbon into and out of the surface reservoir box is much slower, more than 1000 years with the deep ocean and much more slowly with the geologic reservoirs. These other parts of the carbon cycle will be examined in more detail in the next section.
Simplified “box model” representation of where carbon is stored in near-surface reservoirs and the rates at which carbon is exchanged annually between the reservoirs. Fluxes, shown on the arrows, are in units of GtC/yr and are approximate to 10 Gt/yr. The soil carbon mass of 1800 GtC is in the lower range of recent estimates. Reference Ciais, Sabine, Bala, Bopp, Brovkin, Canadell, Chhabra, DeFries, Galloway, Heimann, Jones, Le Quéré, Myneni, Piao, Thornton, Stocker, Qin, Plattner, Tignor, Allen, Boschung, Nauels, Xia, Bex and Midgley15 The overall storage in the surface reservoirs is roughly 4000 GtC. The atmospheric mass represents the preindustrial amount; the current value as of 2014 is about 830 GtC. The terrestrial biosphere mass has changed over the past 200 years but not by a large amount (approximately 50 GtC). Solid arrows depict the normal geologic flux of about 0.23 Gt/yr carbon from deep geologic reservoirs to the atmosphere. To a good approximation, the reservoirs within the gray box are the ones that are most affected, over the next few hundred years, by the increased flux of carbon from deep reservoirs caused by fossil fuel burning and cement production.

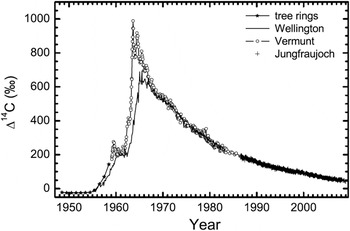
A reasonable question might be—how do we know the rates of carbon transfer between the surface reservoirs? There are several approaches to measuring and estimating the rates of carbon exchange between the four surface reservoirs, Reference Keeling, Piper, Bacastow, Wahlen and Whorf39 but a demonstration of the order of magnitude of these rates is provided by the record of atmospheric radiocarbon over the past 60 years (Fig. 4). An excess of the carbon isotope 14C was produced in the atmosphere as a result of nuclear weapons testing in the 1950s and 1960s. During the period from 1957 to 1966, the proportion of carbon present as the isotope 14C increased by about 60–80% (∆14C = 600–800‰). Atmospheric testing was all but stopped at that time. Since then the 14C excess in the atmosphere, denoted as ∆14C, has decreased by about 50% every 10–12 years. The decrease occurred because the excess 14C, initially contained solely in the atmosphere, was gradually redistributed to the land biomass and the ocean (including to some degree the deep ocean) and mixed with carbon in those other reservoirs that contained much less 14C. Although 14C is radioactive, it decays much too slowly (half life ≈ 5700 years) to account for any of this decrease (in 60 years, less than 1% of the 14C excess was removed by radioactive decay). In more recent years, a larger fraction of the ∆14C decrease is attributable to 14C-free carbon (∆14C = −1000) coming from fossil fuel combustion. Reference Naegler and Levin55 Nevertheless, a simple model in which atmospheric carbon is exchanged with the ocean and land biomass requires transfer rates of about 50–60 GtC/yr to account for the rapid disappearance of the excess 14C in the atmosphere and its appearance in the terrestrial biosphere and the surface ocean. 58,Reference Naegler and Levin55 Thus, although this calculation is simplified, the 14C data provide a clear demonstration that there are large exchange fluxes between the surface reservoirs, and hence that these four surface reservoirs can be considered as one well-mixed reservoir for understanding carbon cycle variations on time scales longer than 100 years.
The radiocarbon content of the atmosphere from 1950 to 2010, expressed in units of permil deviation (∆14C) from the approximately 1950 value of 14C/12C in the atmosphere (Figure from Ref. Reference Levin, Naegler, Kromer, Diehl, Francey, Gomez-Pelaez, Steele, Wagenbach, Weller and Worthy45). Between the late 1950s and the mid-1960s, the 14C content of the atmosphere increased by about 60–80% (600–800‰) due to testing of nuclear weapons. The 14C is produced from nuclear blasts in much the same way it is produced naturally, by neutrons released from the explosions reacting with atmospheric nitrogen. The gradual return of the atmospheric ∆14C value to zero is a measure of the rate at which atmospheric C is exchanged with the oceans and biosphere. For a simplified model where this effect is caused by exchange between the atmosphere and surface ocean (1000 GtC) and land biosphere (600 GtC), the annual exchange rates needed to account for the approximately 10–15 year time scale of ∆14C decay are about 50–60 GtC/yr, Reference Naegler and Levin55 which is evidence for the large magnitude of exchange fluxes shown in Fig. 3. In the last 25 years, the decreasing ∆14C is significantly influenced by fossil fuel carbon emissions, since fossil fuel carbon contains no 14C (∆14C = −1000) and hence tends to accelerate the decrease of ∆14C.

Where else is the carbon in and on the earth?
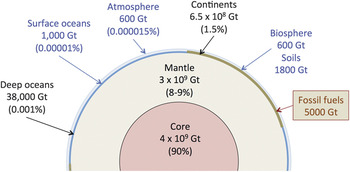
The four major surface reservoirs are the starting point for discussing carbon on the Earth, especially if one is concerned about the next 100–300 years, but to get a more comprehensive picture, other reservoirs of carbon need to be considered. We start with a summary of where the Earth's deeper carbon is stored (Fig. 5).
Distribution of carbon in the Earth. A large proportion of Earth's carbon is stored in the core, where it is isolated and not available to significantly affect the surface environment. The Mantle and Continents are large reservoirs of carbon that exchange with the surface slowly over millions and billions of years. The surface reservoirs, shown in blue type, are much smaller but determine the amount of carbon in the atmosphere and hence climate. The deep ocean is an intermediate storage reservoir—it exchanges carbon with the surface reservoirs on a time scale of 1000 years, much shorter than the mantle and continents, but much slower than the exchange among the surface reservoirs. The mass of the remaining fossil fuel stores (5000 GtC) that could still be extracted and burned are not precisely known, but are believed to be roughly equal to the amount of carbon stored currently in the surface reservoirs, and 5–10 times the amount currently in the atmosphere.

Most of the Earth's carbon is thought to be in Earth's metallic core, buried some 2900 km below the surface and not accessible by any process we know about. The core is made mostly of iron and nickel but has some amount of lower atomic number alloying elements in it. It is not precisely known how much of which elements the core contains besides Fe and Ni, but the most likely suspects are C, S, O, and Si, because they are common and abundant elements in the Sun and in planets and are known to form alloys with Fe at high pressure and temperature. Reference Wood, Li and Shahar83 A conservative estimate is that the Fe–Ni alloy in the core contains about 0.2% by weight carbon. Because the mass of the core is 2 × 10¹² Gt, it therefore contains about 4 billion GtC, which constitutes about 90% of the Earth's carbon (and 1 million times more than is in the surface reservoirs). The amount of carbon contained in the core is interesting but not relevant for understanding climate change except during the earliest stages of formation of the Earth 4.5 billion years ago. Reference DasGupta18
The next biggest repository of carbon is the Earth's mantle. The rocks of the mantle, which are largely silicate compounds of Mg, Fe, Ca, and Al, contain about 0.01% (100 ppm) carbon by weight (probably between 60 and 100 ppm). The carbon is contained in the mantle as diamond and as impurities in the major mineral phases. Reference Dasgupta and Hirschmann19 The mass of the Mantle is almost exactly twice that of the Core (4 × 10¹² Gt), and hence the Mantle contains about 240–400 million GtC; about 8–9% of the total, and about 100,000 times more than is in the surface reservoirs. Together, the mantle and core contain about 98–99% of the carbon in the Earth. Although the carbon contained in the Earth's core cannot be transferred to the atmosphere by any known geologic process, the carbon contained in the Earth's mantle can, and is, regularly transferred to the atmosphere through volcanoes and other means of leakage through the Earth's crust. This is an important part of Earth's carbon story.
The so-called “crust” of the Earth comprises the continents, which are slightly silica-enriched rocks forming a layer about 40 km thick and that largely is exposed above sea level, and the ocean floor, which is about 6 km thick and largely submerged below sea level by an average of almost 5 km. Most of the carbon stored in the crust is stored as limestone and dolomite (Ca,Mg)CO3, and it's metamorphic equivalent—marble—and most of it is in the continental crust. The rest, and a much smaller amount, of the carbon is stored as organic material (petroleum, peat, and coal) or as graphite. The amount of carbon stored in the crust is estimated to be about 60–70 million Gt, about 20–25% of the amount in the Earth's mantle. The carbon stored in the crust might seem to be inert and irrelevant for climate change, but there are geologic processes that release CO2 from limestone and marble and allow it to enter the atmosphere. Minerals like calcite (chemical formula CaCO3) break down and release CO2, when they are heated to high temperature in the Earth. Reference Fraser, Johnston, Turchyn and Edmonds26,Reference Kerrick and Caldeira41 The released CO2 finds its way to the surface and is transferred to the atmosphere by springs, geysers, and seepage through soils and rocks. A similar process is involved in the making of cement. Limestone is heated until it breaks down and releases CO2. This calcining process leaves calcium oxide, which is needed for cement. The global cement-making industry produces CO2 at the rate of about 0.5 GtC/yr, Reference Ciais, Sabine, Bala, Bopp, Brovkin, Canadell, Chhabra, DeFries, Galloway, Heimann, Jones, Le Quéré, Myneni, Piao, Thornton, Stocker, Qin, Plattner, Tignor, Allen, Boschung, Nauels, Xia, Bex and Midgley15 which is roughly 5 times more than the entire Earth normally makes naturally by metamorphism (Fig. 2).
The next biggest repository of carbon not accounted for in the surface reservoirs, and one that is quite important for understanding carbon and climate, is the deep ocean, which contains almost 38,000 GtC (0.001% of the Earth's carbon), most of it dissolved in the form of the bicarbonate ion (HCO3 −) but with some dissolved CO2 and organic carbon as well. The deep ocean carbon reservoir is about 10 times larger than the sum of the four surface reservoirs, and hence quite large, but still much smaller than the geologic reservoirs. The deep ocean, however, unlike the geologic reservoirs, is directly connected to the surface reservoirs, and there is a large amount of carbon exchanged between the surface ocean and the deep ocean. Reference Ciais, Sabine, Bala, Bopp, Brovkin, Canadell, Chhabra, DeFries, Galloway, Heimann, Jones, Le Quéré, Myneni, Piao, Thornton, Stocker, Qin, Plattner, Tignor, Allen, Boschung, Nauels, Xia, Bex and Midgley15,Reference Houghton34 The only way that the surface reservoirs can lose carbon over the next few thousand years is by transport through the surface ocean to the deep ocean, and ultimately to ocean sediments. As discussed further below, the limited number of mechanisms that can take carbon out of the surface reservoirs is the reason that adding carbon to the atmosphere in large amounts is problematical.
Connecting the surface reservoirs to the deep earth
To understand climate change on the different time scales in which it is known to occur naturally, from thousands of years to billions of years, we need to place the four surface reservoirs into the broader context of deeper Earth carbon cycles. The longer the time scale considered the more and deeper the carbon that is involved.
The surface reservoirs exchange carbon with the much larger deep ocean at a substantial rate, but because the deep ocean is so large, the time necessary for the surface reservoirs to mix their carbon with the deep ocean is more than one thousand years. Reference Kasting35 This exchange rate can also be estimated from radiocarbon data. The radiocarbon “age” of deep waters in the ocean is in the range of 1000–2000 years. Reference England and Maier-Reimer24 This age is a measure of the amount of time since the deep ocean carbon was last in the atmosphere. Transfer of carbon between the deep ocean and the surface reservoirs is important for understanding climate change. Current models for the last ice age, e.g., suggest that compared to the present, the deep ocean contained about 600 Gt more carbon at the expense of the atmosphere (200 Gt less C) and the terrestrial biosphere (400 Gt less C). Reference Sigman and Boyle77,Reference Yu, Broecker, Elderfield, Jin, McManus and Zhang85 Hence, climate can change on a several thousand-year time scale by shifting carbon between the surface reservoirs and the deep ocean. The exact causes and mechanisms of the glacial–interglacial shift are not agreed upon, Reference Sigman and Boyle77 but the time scale is right for the carbon shift to involve the deep ocean reservoir. The climate and atmospheric CO2 transition at the end of the last glacial period took roughly 6000 years. Reference Monnin, Indermuhle, Dallenbach, Fluckiger and Stauffer53 The 1000-year time scale of the deep ocean-surface reservoir exchange is also important because it defines the amount of time needed for the deep ocean to contribute to absorbing anthropogenic carbon emissions. Reference Archer, Eby and Brovkin2
Planetary carbon cycle and long-term climate change
The amount of carbon in the four active surface reservoirs plus the deep ocean effectively determines Earth's global climate and can change slowly due to geologic processes. As implied above, one source of carbon for the atmosphere is volcanoes. Volcanic eruptions involve the release of gases (CO2, but also H2O, SO2, and others) as well as the eruption of lava and ash. The CO2 that comes from volcanoes is extracted from Earth's mantle and deep continental crust, so it is “new” carbon for the surface reservoirs that is transferred from long-term geologic storage to the atmosphere. It is challenging to estimate how much carbon comes from volcanoes each year, but the most recent estimates yield a number of about 0.15 GtC/yr, Reference Burton, Sawyer and Granieri11 which is somewhat higher than previous estimates. Reference Gerlach29 In addition to volcanic emissions, there is another 0.08 GtC/yr that comes from metamorphism that takes place in largely nonvolcanic mountain building zones like the Alps and Himalaya. Reference Kerrick and Caldeira41,Reference Morner and Etiope52 The total carbon emitted from the Earth's crust and mantle therefore is estimated to be about 0.23 Gt/yr, which is close to being compatible with carbon removal rates of about 0.18–0.24 GtC/yr by sedimentation in the oceans. Reference Nakamori56 This amount of carbon emitted each year, if not compensated by removal mechanisms, would be enough to increase the CO2 concentration in the atmosphere by about 0.1 ppm per year. However, the natural processes that remove this added carbon from the atmosphere into marine sediments compensate for the volcanic and metamorphic additions, so that the natural atmospheric CO2 concentration changes are typically much less than ±0.1 ppm/yr over thousands and even millions of years.
Under normal circumstances the primary planetary flow of carbon is from the solid Earth to the atmosphere and then into the oceans. The extra carbon that is added to the oceans does not stay in the oceans for long but is turned into calcium carbonate by marine organisms making their shells, and then buried in sediment on the ocean floor, both in the deep ocean as well as on continental shelves (e.g., coral reefs) and other near-short environments. Ultimately, this planetary carbon “cycle” takes carbon from the solid rock of the Earth, puts it into the atmosphere via volcanoes and metamorphism, the atmosphere shares it with the biosphere and the ocean, and then it is put back into rock on the ocean floor. The existence of a mechanism for removing carbon from the atmosphere and surface reservoirs and returning it to geologic storage is what makes the Earth a habitable planet. Reference Kasting and Catling37,Reference Walker, Hays and Kasting82
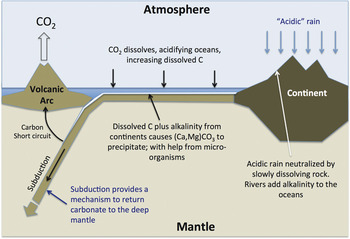
Carbon cannot be returned to solid rock storage unless the continents and the hydrologic cycle get involved (Fig. 6). The CO2 in the atmosphere dissolves in the ocean and in atmospheric water vapor to create a weak acid—carbonic acid. When rainwater and groundwater are in contact with rocks of the Earth's crust, they slowly dissolve the silicate minerals, a process referred to as “weathering,” which effectively neutralizes the acid. The water that is returned to the oceans by rivers thus is more alkaline than rainwater and tends to offset the acidity of the oceans while also supplying cations like Ca2+ and Mg2+ that have been leached from the rocks. The divalent cations combine with carbonate ions (CO3 2−) in the ocean to produce Ca,Mg-carbonate minerals. The formation of the solid carbonate minerals on the modern Earth is mostly mediated by microorganisms growing carbonate shells Reference Lowenstein, Kendall and Anbar46,Reference Sandberg73 rather than just by inorganic precipitation, although earlier in Earth history most of the carbonate precipitation was inorganic. Reference Sleep, Bird and Pope79 The carbonate shell material accumulates on the ocean floor first as a soft carbonate mud, and later by gradual heating and compaction is turned into chalk and then limestone. Additional carbonate forms inorganically filling fractures within the volcanic oceanic crust. Reference Staudigel81
Diagram of the geologic carbon cycle that regulates the amount of CO2 in the atmosphere and surface reservoirs over long time scales of millions of years and has kept the Earth “habitable” over most of its 4.5 billion year lifetime. The key feature of the Earth is that carbon (from the Mantle) released to the atmosphere by volcanic emissions can be returned to the deep Earth rather than retained in the atmosphere where it would accumulate to exceedingly high levels over geologic time. The CO2 released from geologic storage by volcanoes tends to acidify rainwater (and the oceans), which slowly dissolves rocks in a process referred to as “weathering.” Weathering generates alkalinity, including aqueous Ca2+ (and Mg2+) ions, that when added to the oceans can combine with dissolved carbonate ions to form solid carbonate (mostly as shelled organisms on the modern Earth), which accumulate on the sea floor and form limestone by compaction and chemical processing over millions of years. Limestone can be added to the continents and stored as sedimentary or metamorphic rock for hundreds of millions of years, or it can be “subducted” back into the deep mantle where it can be retained for one or two billion years. The strength of the feedback between volcanic CO2 emissions, which tend to acidify the oceans and increase atmospheric CO2, and weathering which tends to make the ocean more alkaline and decrease atmospheric CO2, can change slowly over millions of years, resulting in slow swings in global climate between hotter and cooler states (see following figure).

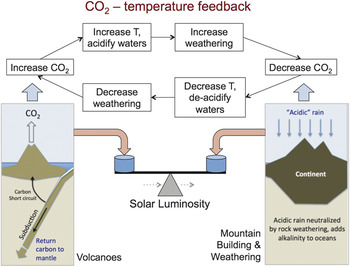
The carbon content of the surface reservoirs and deep ocean is maintained within a narrow range by a dynamic balance between volcanic and metamorphic carbon supply, and a removal process involving weathering of continental rocks exposed at the Earth's surface. Because adding CO2 to the ocean-atmosphere system has the effect of both acidifying natural waters and raising the air temperature, increasing CO2 tends to accelerate weathering rates, which acts to counterbalance the increase of atmospheric CO2. Reference Berner7,Reference Berner, Lasaga and Garrels9,Reference Caldeira12,Reference Walker, Hays and Kasting82 This weathering feedback cycle (Fig. 7) is a key feature of the Earth that allows it to maintain an equitable surface temperature over millions to billions of years. Reference Kasting and Catling37 There are aspects of this cycle that are not completely understood. The key idea, that weathering rate increases when atmospheric CO2 increases, has not been proven but is regarded as inescapable (see Ref. Reference Edmond and Huh23), although the mechanism is debated. Reference Maher and Chamberlain48
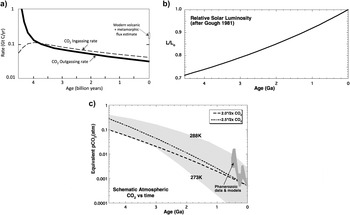
Diagrammatic representation of the CO2-temperature feedback that regulates Earth's surface temperature. Atmospheric CO2 is supplied at a small but significant rate, currently estimated at about 0.23 GtC/yr (probably larger in the geologic past) by volcanic emissions and metamorphism. Weathering has the net effect of removing CO2 from the atmosphere-ocean system and converting it to solid carbonate minerals. Weathering reactions are accelerated by higher temperature and lower pH, so it is inferred that increased atmospheric CO2 and temperature will accelerate weathering. Hence there is feedback, where any increase in volcanic emissions, which will tend to increase atmospheric CO2 and temperature, will be counterbalanced by an increase in weathering, with a lag time of roughly 100,000 years. Reference Walker, Hays and Kasting82 The rate of volcanic emissions can change due to the strength of the “carbon short circuit,” and the rate of weathering can change as a result of continent–continent collisions, which accelerate weathering by creating high mountain ranges where erosion is rapid, making more mineral surface area available for weathering reactions. Over millions to hundreds of millions of years, Earth's climate can drift between warmer and cooler regimes. Ultimately, the strength of the feedback is determined by the absorption of solar energy by the atmosphere, and because the brightness of the Sun has increased gradually over the past 4.5 billion years, there has been a tendency for the CO2 content of the atmosphere to decrease gradually during Earth history (Fig. 9). As the Sun's luminosity increases, less CO2 is required to balance weathering.

The climate feedback cycle is effective. There is evidence that the surface temperature of the Earth has been kept in a fairly narrow range, probably between about 5 and 35 °C over the past 3.5 billion years. 60 However, the cycle is also sluggish. This can be illustrated by considering the amount of carbon in the surface reservoirs and ocean, which is roughly 40,000 Gt at present and probably somewhat more at various times in the geologic past. Using a volcanic and metamorphic emission rate of 0.23 GtC/yr, it can be inferred that the time scale over which the geologic climate feedback operates is a little more than 150,000 years (≈40,000/0.23). This calculation means that any perturbation, such as a sudden increase in volcanic emissions, will be compensated by an increase in weathering, but the system won't reach a new equilibrium for about two to three times this inferred time scale, roughly 300–400,000 years. This time scale is important because it defines the time needed for the geologic cycle (rock weathering in particular) to contribute to compensating anthropogenic carbon emissions. Reference Archer, Eby and Brovkin2
The effect of the Sun on the Earth's carbon cycle is strong but constant when considering time scales even as long as 10 million years. But over the history of the Earth, the Sun is believed to have become gradually hotter and brighter as the internal composition evolved. Reference Gough30 The standard model has the Sun's luminosity increasing gradually and systematically starting from about 70% of the modern value at 4.4 billion years ago. Relative to the modern situation, where about 280 ppm CO2 in the atmosphere is adequate to keep the average Earth surface temperature at about 15 °C, when the Sun was only 70% as bright, about 300,000 ppm CO2 would have been needed Reference Kasting38 (Fig. 8). The atmosphere composition could, e.g., have been about 70% N2 and 30% CO2 (there was little or no O2 in the atmosphere at that time). The required greenhouse warming could have been partly supplied by methane rather than CO2, (or potentially by other mechanisms) which would mean somewhat lower concentrations of CO2 were needed. Reference Kasting36,Reference Kasting and Catling37,Reference Pavlov, Kasting, Brown, Rages and Freedman65,Reference Wordsworth and Pierrehumbert84 Nevertheless, it is clear that the biggest perturbation to climate over the history of the Earth is the brightening of the Sun. This point is shown schematically as a fulcrum in Fig. 7 to emphasize the large role that solar luminosity plays in driving the climate system and by inference the atmospheric CO2 concentration. The effectiveness of the weathering feedback is demonstrated by the fact that Earth's surface temperature has remained within a few 10's of degrees above the freezing point of water over most of the last 4 billion years even though the luminosity of the Sun has changed by a large amount. Reference Kasting and Catling37
(a) Plausible rate of outgassing of deep mantle carbon to the atmosphere over the course of Earth history (from Ref. Reference Zhang and Zindler89). The inferred modern rate is 0.03 GtC/yr and the rate at 3.0 billion years ago is about 0.06 GtC/yr. Other estimates are as much as twice these numbers (e.g., Ref. Reference Dasgupta and Hirschmann19). At the rates shown, approximately all the original carbon in the mantle would have been released to the atmosphere over the past 4+ billion years. In this case, and even more so if the rates were higher, the fact that the Earth's mantle still contains a lot of carbon would suggest that there is an efficient mechanism to return carbon from the atmosphere back to the mantle. (b) Results of a simple calculation showing the partial pressure of CO2 needed in the atmosphere to maintain the Earth's surface temperature between 0 and 15 °C to compensate for the changing luminosity of the Sun.

Moving carbon in and out of the deep earth
Although the natural, geologic rate of carbon release from rocks to the atmosphere seems quite small, over the long extent of geologic time, a huge amount of carbon is moved. At the estimated modern rate of 0.23 GtC/yr, over just the limited time between Pleistocene ice ages—100,000 years—natural processes release 23,000 Gt carbon to the atmosphere from the solid Earth, about half the amount needed to completely replace the carbon in the oceans, atmosphere, and biosphere. Over the past 1 million years, again assuming the same rate, about 230,000 Gt carbon would have been naturally released to the atmosphere by geologic processes, which is about 5 times more than is contained in the surface reservoirs. These numbers show that carbon is indeed “cycled” through the surface reservoirs and originates in the geologic reservoirs. Over the past million years, we have reasonable estimates of the CO2 concentration of the atmosphere from ice cores, 25 and the amount of carbon in the atmosphere has remained between 400 and 600 Gt. Even though huge amounts of carbon are injected into the atmosphere at a slow rate, Earth's carbon cycling system regulates the amount of carbon in the atmosphere and keeps it almost constant. If the time scale is stretched to 50 million years, the volcanic emission rates are less certain (probably somewhat higher), but nevertheless the same calculation suggests that geologic processes have injected more than 12 million Gt carbon into the atmosphere. Over this longer time period, the atmosphere has been more variable in carbon content, having changed from about 2000 Gt carbon at about 50 million years ago to about 600 Gt carbon today Reference McCauley, DePaolo and Ruddiman49,Reference Pearson and Palmer66 (see Fig. 10). Over this 50 million year time span the carbon in the atmosphere, biosphere, and oceans has been completely replaced more than 200 times.
If we use the volcanic emission rate of 0.15 GtC/yr and consider the entire 4.5 billion year history of the Earth, the total transfer of carbon from the Earth's mantle to the atmosphere would be 6.75 × 10⁹ Gt carbon. This number is about twice the estimated amount of carbon in the mantle and crust and would imply even the carbon in the mantle has been replaced at least twice during Earth history. One problem with this calculation is that much of the 0.15 GtC/yr modern volcanic emission rate is thought to be due to the “carbon short circuit” that affects volcanoes associated with subduction zones Reference Edmond and Huh23,Reference Fraser, Johnston, Turchyn and Edmonds26 (Fig. 7). A more likely number for the modern flux of deep mantle carbon to the atmosphere is much smaller—about 0.03–0.05 GtC/yr, although the rate might have been higher in the Earth's past when the mantle was hotter. Reference DasGupta18 The outgassing of carbon from the mantle is believed to have decreased gradually as the Earth lost some of its initial heat and mantle convection slowed Reference Zhang and Zindler89 (Fig. 8). An average value for the transfer rate, inferred from Fig. 8, might for example be 0.05 GtC/yr over the last 4 billion years. At this rate, about 2 × 10⁸ Gt carbon would have been transferred from the mantle to the atmosphere over 4 billion years, still a large fraction of Earth's internal carbon inventory.
There are two interesting points related to this number of 2 × 10⁸ Gt carbon transferred from the mantle to surface reservoirs. Venus, which is a planet similar in size to the Earth, but that does not have liquid water at its surface and hence has no mechanism for removing carbon from its atmosphere, Reference Kasting35 currently has 1.26 × 10⁸ Gt carbon in its atmosphere, almost all of it as CO2. Hence, Venus can be viewed as evidence that it is possible to transfer large amounts of carbon from a planet's mantle to its atmosphere. Another point is that, of the 2 × 10⁸ Gt carbon or more that has been transferred out of the Earth's mantle, we can currently account for only about 1/3 of it (about 6–7 × 10⁷ Gt carbon) in the continental crust plus the surface reservoirs (Fig. 5). Hence, there is evidence that a large fraction of the carbon that is expelled from the deep mantle is returned to the mantle, presumably by subduction as shown in Fig. 6 (see Ref. Reference DasGupta18). Thus, the deep carbon reservoirs of the Earth are part of a carbon “cycle” that operates on a time scale of a billion years or above more.
Water on the earth—no water, no carbon cycle
Implicit in the discussion above is the presence on the Earth's surface of a large amount of liquid water. Atmospheric CO2 cannot be removed without the acidification of rainwater and groundwater, and the consequent rock weathering that occurs. Reference Walker, Hays and Kasting82 Flowing rivers constitute the means of returning the alkalinity to the oceans, and the ocean provides the environment within which carbonate rocks can form and provide long-term storage for carbon. It is also believed that the small amount of water dissolved in minerals in Earth's Mantle changes the rock viscosity and facilitates plate tectonics and certain aspects of the solid state convection in Earth's interior that provide a means to return carbon from the surface reservoirs and the continental crust into the deeper parts of the Mantle. Reference Richards, Yang, Baumgardner and Bunge69 The presence of surface water on Earth means that most of the carbon continuously supplied by volcanism does not accumulate in the atmosphere but instead is returned to geologic storage deep in the Earth.
Maintaining the surface water inventory of Earth requires that the surface temperature of the Earth be above the freezing point of water but not too close to the boiling point. If at any time in the Earth's past, the atmospheric temperature was high enough that there had been a large fraction of the H2O in the atmosphere, then it may have been possible, through H2O dissociation and loss of hydrogen from the top of the atmosphere, to have greatly depleted the Earth's store of water. Reference Kasting and Catling37 The fundamental difference between Venus and Earth in this regard is attributed to the fact that Venus is sufficiently close to the Sun that water cannot be kept in the liquid state, and hence through hydrogen loss, water is nowhere to be found at or above the surface and there is an accumulation of about half a planet's worth of C in the atmosphere. This accumulated carbon, which enhances the greenhouse effect, makes it impossible to escape this state once it is reached. Earth currently occupies the “Habitable Zone” in terms of distance from the Sun in the Solar System, Reference Kasting and Catling37 being neither too close to allow complete vaporization of water at the surface, but not so far as to allow all the water to freeze into ice.
“Extreme” carbon events in the earth’s past
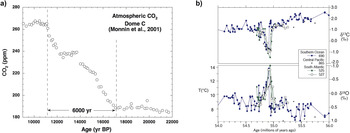
There are examples in geologic history where the amount of CO2 in the atmosphere was changing “rapidly,” before humans were around to have an effect. A recent example is the period between 18,000 and 12,000 years ago, the end of the last Ice Age, when glaciers were melting in the Northern hemisphere [Fig. 9(a)]. During this time, about 150 Gt carbon was added to the atmosphere by natural processes. Reference Monnin, Indermuhle, Dallenbach, Fluckiger and Stauffer53,Reference Yu, Broecker, Elderfield, Jin, McManus and Zhang85 The rate of addition, 150 Gt carbon per 6000 years, equates to a transfer rate of 0.025 GtC/yr. Considering the relatively rapid climate changes in this time period, this carbon transfer rate must be considered extreme by geologic standards. Nevertheless, this “rapid” rate is almost 200 times smaller than the rate that CO2 is currently accumulating in the atmosphere (4–5 GtC/yr, or about half the total emissions). During the 6000-year deglaciation period, and analogous to the present, there was more carbon being moved into and out of the atmosphere than was accumulating in the atmosphere. Overall, it is estimated that there was about 600 Gt carbon transferred from the deep ocean through the atmosphere and into the land biomass during the 6000-year deglaciation interval. This rate (600 Gt in 6000 years) is about 0.1 GtC/yr, still 100 times smaller than the modern rate of 10 GtC/yr emissions by burning of fossil fuels (Figs. 1 and 2).
(a) Atmospheric CO2 during the climate transition from the last glacial maximum, from 22,000 years ago to 9000 years ago. Reference Monnin, Indermuhle, Dallenbach, Fluckiger and Stauffer53 During the period from 17,000 to 11,000 years ago, atmospheric carbon concentration changed by about 70 ppm, corresponding to an atmospheric carbon increase of 150 GtC in 6000 years or about 0.025 GtC/yr. (b) Carbon isotope record and estimated deep ocean temperature during the Paleocene-Eocene Thermal maximum (PETM) about 50 million years ago. These signals correspond to the addition of 3000–7000 GtC in 6000 years, a rate of 0.5–1.2 GtC/yr (figures from Ref. Reference Zachos, Pagani, Sloan, Thomas and Billups86).

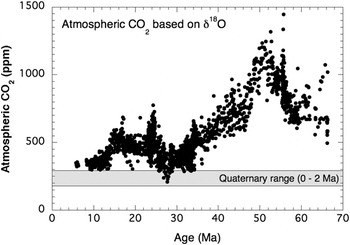
The prime example from the geologic past of a rapid addition of CO2 to the atmosphere happened about 55 million years ago in an event referred to as the “Paleocene-Eocene Thermal Maximum” or PETM. Reference McInerney and Wing50,Reference Zachos, Pagani, Sloan, Thomas and Billups86,Reference Zachos, Dickens and Zeebe87 At that time, the Earth already had a high atmospheric CO2 concentration (1000 ppm or more; Fig. 10) and was overall much warmer than it is at present. Due to some kind of “catastrophic” geologic process, possibly involving release of methane from the seafloor, Reference Dickens, O’Neil, Res and Owen22,Reference Kennett and Stott40 in a “relatively short” period of about 6000 years, an estimated 3000 to 7000 Gt carbon was transferred from geologic storage to the atmosphere. Reference McInerney and Wing50,Reference Zachos, Dickens and Zeebe87 This “catastrophic” event involved carbon transfer at a maximum rate of about 0.5–1.4 GtC/yr, Reference Cui, Kump, Ridgwell, Charles, Junium, Diefendorf, Freeman, Urban and Harding17 still about 10–20 times slower than the present rate of 10 GtC/yr due to combustion and cement production. The addition of atmospheric carbon 55 million years ago produced roughly a doubling (possibly more) of the amount of carbon in the atmosphere over this 6000-year time period, from about 1000 to about 2000 ppm or more (Figs. 9 and 10). Currently, we are in the process of doubling atmospheric CO2 over a period of about 150 years, which is 40 times faster and apparently unprecedented in Earth history. Climate models indicate that a doubling of atmospheric CO2 concentration produces an increase in Earth surface temperature of 2–5 °C. Reference Knutti and Hegerl43 At 55 million years ago, the doubling of atmospheric CO2 caused an already warm Earth with no polar ice caps to become even warmer. At present, we are starting from a relatively cold Earth with polar ice caps and rapidly headed for an atmosphere with high CO2 concentration while the polar ice caps are still present. If this situation ever happened before on Earth, the last time was probably about 700 million years ago, long before any kind of complex life was present, and the conditions that would have prevailed are so unlike the present that it strains the best minds to create models that might describe the Earth's climates at that time. Reference Hoffman, Kaufman, Halverson and Schrag32,Reference Hoffman and Schrag33,Reference Kirschvink, Gaidos, Bertani, Beukes, Gutzmer, Maepa and Steinberger42,Reference Pierrehumbert, Abbot, Voigt and Koll68,Reference Schrag, Berner, Hoffman and Halverson76
Representation of atmospheric CO2 history from 5 to 65 million years ago based on oxygen isotopes in marine benthic foraminifera. Oxygen isotope data are from references given in Ref. Reference Zachos, Pagani, Sloan, Thomas and Billups86. The formula for CO2 concentration is modified slightly from Ref. Reference McCauley, DePaolo and Ruddiman49: (CO2) = 280 × 1.5^(2.6-δ18O). Other estimates of CO2 history are described in Refs. Reference Beerling and Royer5, Reference Pagani, Zachos, Freeman, Tipple and Bohaty63, and Reference Pearson and Palmer66, but show generally similar values. The spike to high CO2 concentrations at 55 million years is associated with the so-called PETM where a large release of carbon to the atmosphere over about 6000 years temporarily increased atmospheric CO2 concentration by as much as 1000 ppm above the ambient (already high) level of about 1000 ppm Reference Zachos, Dickens and Zeebe87 (Fig. 9). The Antarctic ice cap began to form at about 34–38 Ma, after atmospheric CO2 had dropped below 600–700 ppm. Reference DeConto and Pollard21 Current atmospheric CO2, at 400 ppm, is higher than it has been for about the last 10 million years. If continued fossil carbon release drives CO2 much above 1000 ppm, it will then be higher than it has been for roughly 100 million years, with the exception of the geologically brief PETM event.

How to understand what is happening now
Since the beginning of the industrial revolution, human activity has increased the amount of carbon being transferred from geologic storage (as limestone, coal, oil, and natural gas) to the atmosphere. The rate of this transfer is 10 GtC/yr in 2014 (Fig. 1), and the rate is increasing by 1 GtC/yr every 4 years. The current transfer rate is roughly 40–50 times higher than what is normal for the Earth (Fig. 2). This carbon is effectively dumped into the surface reservoir “box,” where it is distributed between the atmosphere, the ocean, soils, and the biosphere in a matter of decades. The problem is that this carbon cannot be returned to geologic storage at anywhere near the rate it is being added because there is no natural mechanism to do it.
Most of the 10 GtC/yr being injected into the atmosphere by fossil fuel burning and cement production is staying in the surface reservoirs. However, the deeper ocean plays a significant mitigating role. The net transfers of carbon between the various reservoirs at present are shown in Fig. 12 (based on Refs. Reference Ciais, Sabine, Bala, Bopp, Brovkin, Canadell, Chhabra, DeFries, Galloway, Heimann, Jones, Le Quéré, Myneni, Piao, Thornton, Stocker, Qin, Plattner, Tignor, Allen, Boschung, Nauels, Xia, Bex and Midgley15 and Reference Houghton34). The net transfers are determined by a combination of means that are described in detail in the IPCC reports and also summarized on an annual basis by the Global Carbon Project (www.globalcarbonproject.org). Currently, the transfer of 10 GtC/yr from geologic storage to the atmosphere is partly compensated by transfer of about 2 GtC/yr from the surface reservoirs to the deep ocean. Consequently, 8 GtC/yr is accumulating in the surface reservoirs. The normal geologic transfers are small in comparison, and the tiny transfer of carbon into geologic storage as carbonate and buried organic material (0.23 GtC/yr) just compensates for the continuing volcanic and metamorphic emissions.
The overall, but simplified, picture is that there is no way for the ocean system to keep up with the 10 GtC/yr anthropogenic input. Predictions are that the ocean sink will continue to operate as it is for the foreseeable future. Reference Archer, Eby and Brovkin2,Reference Ciais, Sabine, Bala, Bopp, Brovkin, Canadell, Chhabra, DeFries, Galloway, Heimann, Jones, Le Quéré, Myneni, Piao, Thornton, Stocker, Qin, Plattner, Tignor, Allen, Boschung, Nauels, Xia, Bex and Midgley15,Reference McNeil, Matear, Key, Bullister and Sarmiento51,Reference Sabine, Feely, Gruber, Key and Lee72 The ocean has been taking up a consistent fraction of total emissions for the past 40 years, about 30% of annual fossil emissions. The other 70% is distributed between the atmosphere and the biosphere. The atmosphere is currently accumulating about 50% of the fossil emissions, and the biosphere about 20%. Optimistic projections for the future are that the biosphere proportion will remain constant or increase somewhat, but many models suggest that after the mid-21st century, the terrestrial carbon sink will start to shrink and by the end of the century there will be no more capacity for the biosphere to absorb carbon. Reference Canadell, Pataki, Gifford, Houghton, Luo, Canadell, Pataki and Pitelka14,Reference Cox, Betts, Jones, Spall and Totterdell16,Reference Friedlingstein, Meinshausen, Arora, Jones, Anav, Liddicoat and Knutti27
As of 2014, about 400 Gt carbon has been transferred from geologic storage to the surface reservoirs, Reference Ciais, Sabine, Bala, Bopp, Brovkin, Canadell, Chhabra, DeFries, Galloway, Heimann, Jones, Le Quéré, Myneni, Piao, Thornton, Stocker, Qin, Plattner, Tignor, Allen, Boschung, Nauels, Xia, Bex and Midgley15 an amount that is about 10% of the original inventory in these reservoirs. Of this amount, 250 Gt carbon has been added to the atmosphere and about 150 Gt carbon has been added to the oceans. Much of the 150 Gt carbon added to the oceans has been transferred to the deep ocean. The terrestrial biosphere and soils have been approximately carbon neutral overall because the loss of carbon due to land use change starting before 1750 has been largely balanced by increased carbon uptake over the past 50 years.
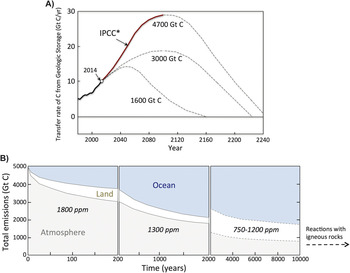
Three assumed (approximate) limiting carbon emissions curves for the next 300 years are shown in Fig. 11. At the current (and increasing) rate of carbon emissions, the 400 Gt carbon total transfer will increase to about 1200 Gt carbon by the end of the century. The total available amount of coal, oil, and gas that could be combusted is estimated at roughly 5000 Gt carbon, Reference Archer and Brovkin1 and if the annual rate were to reach 20 GtC/yr, there could be 2000 GtC transferred just between 2100 and 2200 AD. If an additional 4500 Gt carbon is emitted over the next 250 years, and the oceans continue to take up 30%, the ocean inventory will increase by 1350 Gt carbon. If the biosphere were to continue to take up 20%, then its carbon mass would increase by 900 Gt. The biosphere mass is currently only about 600 Gt, so it is probably unlikely that it will be able to take up as much as an additional 900 Gt carbon Reference Canadell, Pataki, Gifford, Houghton, Luo, Canadell, Pataki and Pitelka14,Reference Friedlingstein, Meinshausen, Arora, Jones, Anav, Liddicoat and Knutti27 unless the transfer of this carbon to soils becomes much faster and the soils can somehow retain that carbon in the face of increasing temperatures. Reference Davidson and Janssens20 Nevertheless, in this scenario, the remaining 2250 Gt carbon is retained in the atmosphere. When added to the 840 Gt carbon currently in the atmosphere, the total would be about 3100 GtC, which translates to a concentration of 1470 ppm (a little more than 5 times the preindustrial value of 280 ppm). If the terrestrial biosphere were to take up no more carbon over the next 250 years, then the atmospheric inventory would reach 4000 Gt carbon, and the concentration would be 1900 ppm (almost 7 times the preindustrial value). The 1470–1900 ppm range of concentration values is similar to that produced by the various more detailed models that have been used. Reference Archer, Eby and Brovkin2,Reference Ridgwell and Hargreaves70 If, alternatively, total emissions can be kept to about 1200 Gt carbon, the impacts would be much less. Peak atmospheric concentration might be about 680 ppm, and this would require that the terrestrial biosphere take up about 160 Gt carbon, an amount that may be possible.
(a) Three possible emission scenarios for the next 200+ years and the total integrated emissions to which they correspond. Black line is historical emissions to 2014. Redline is the IPCC “worst case” scenario to 2100. Dashed lines are other arbitrary possibilities with lower emissions. (b) Graph depicting where 5000 Gt of fossil CO2 emissions is likely to be stored over the next several thousand years, if only “natural” carbon removal mechanisms are at work (figure adapted from Ref. Reference Ciais, Sabine, Bala, Bopp, Brovkin, Canadell, Chhabra, DeFries, Galloway, Heimann, Jones, Le Quéré, Myneni, Piao, Thornton, Stocker, Qin, Plattner, Tignor, Allen, Boschung, Nauels, Xia, Bex and Midgley15. This model assumes that 5000 GtC is added to the atmosphere at one time at time zero, which would correspond approximately to the year 2100 in the graph in Fig. 11(a) and the scenario where a total of 4700 GtC is emitted. The atmospheric amount shown is the amount in addition to the 600 GtC that was in the preindustrial atmosphere. After 2000 years (which would be the year 2100 + 2000 = 4100), there would still be 1800 + 600 = 2400 GtC in the atmosphere, equivalent to about 1100 ppm. By the year 12,000, the concentration would have decreased only to about 800 ppm and would drift down slowly after that over the subsequent 200–300 thousand years. In the next 50 years, we will choose the emission scenario that will determine the Earth's climate over the next 100,000 years or more.

Carbon cycle approximately 2014. The transfer of rate of 10 GtC/yr from geologic reservoirs now dwarfs the natural rate from volcanoes and metamorphism, and the flux of carbon into sediments as carbonate shells and buried organic material is similarly dwarfed. The only relief from accumulation of the 10 GtC/yr flux in the surface reservoirs is the transfer to the deep ocean, which is significant at about 2 GtC/yr, but much smaller than 10 GtC/yr.

Undoing the deed using the Earth system
In most projections of the future of carbon emissions, it is assumed that in the worst case we will burn all the accessible combustible carbon (coal, oil, and natural gas). The total amount is estimated to be 5000 Gt carbon, and this incorporates the assumption that we will continue to get better at finding and extracting carbon fuels from the Earth. The expectation, therefore, is that if we continue on our current trajectory, we will use up all the carbon fuels over the next 300 years (Fig. 11). Since we know that the Earth system cycles and recycles carbon, it might be expected that, after all the carbon is combusted, the carbon buildup in the atmosphere and other surface reservoirs will decrease as natural Earth processes operate, and the whole system will return to the preindustrial state. This is likely to be true, but because of the sluggishness of Earth processes, the amount of time it takes is long. Reference Archer, Eby and Brovkin2,Reference Ciais, Sabine, Bala, Bopp, Brovkin, Canadell, Chhabra, DeFries, Galloway, Heimann, Jones, Le Quéré, Myneni, Piao, Thornton, Stocker, Qin, Plattner, Tignor, Allen, Boschung, Nauels, Xia, Bex and Midgley15,Reference Ridgwell and Hargreaves70 Once atmospheric CO2 concentrations get as high as 1470–1900 ppm, it is estimated that it will take several thousand years to come back down to 1000 ppm, and then more than 100,000 years to get close to the preindustrial value of 280 ppm (Fig. 11). This is a key point—as a consequence of the time scales discussed above, even though we add 5000 Gt carbon to the atmosphere and surface reservoirs in 300 years, it will take 100–1000 times as long to get that carbon out of the surface reservoirs and back into geologic storage through natural mechanisms. Returning the atmosphere to the preindustrial 280 ppm CO2 concentration will require that most of the extra 5000 Gt carbon added to the surface reservoirs and deep ocean be turned into carbonate sediments on the seafloor.
The slow return to background levels of atmospheric carbon is due to the normal sluggishness of the natural cycles as discussed above and to complications with the chemistry of the oceans. The oceans can take up a substantial fraction of the atmospheric CO2, but only if the deep ocean is involved. Hence, the rate at which the oceans can take up carbon is limited by the rate at which the surface ocean can mix with the deep ocean; this time scale is 1000 years as noted above. Even if the absorbed atmospheric CO2 is distributed uniformly throughout the shallow and deep ocean, the uptake of carbon by the ocean will eventually slow down by a large factor. The slowdown occurs because the oceans become too acidic to absorb more CO2. They reach a new equilibrium with the atmosphere when the ocean has absorbed about half the excess carbon—about 2500 Gt carbon. Reference Archer, Kheshgi and Maier-Reimer3,Reference Ridgwell and Hargreaves70 At that point the atmospheric CO2 concentration would still be above 1000 ppm (Fig. 11).
When the oceans cannot take up more CO2 by simply allowing it to dissolve in ocean water, a much slower process comes into play. That process is the dissolution of limestone (calcium carbonate) from the seafloor. Reference Archer, Eby and Brovkin2,Reference Archer, Kheshgi and Maier-Reimer3,Reference Broecker, Takahashi, Simpson and Peng10 The dissolution would occur because the oceans had become acidic enough that calcite would no longer be stable on the ocean floor. The models of this process are not particularly certain, but estimates are that the time scale for dissolution is about 10,000 years. So the projections are that after 1000 years, while the atmospheric concentration will continue to decrease, it will take another 10,000 years to bring the atmospheric concentration down to 600–700 ppm (Fig. 11).
The 600–700 ppm level of atmospheric CO2 is a significant number, because that is the value above which it is believed that the great East Antarctic ice sheets are not stable. The East Antarctic ice sheets contain an amount of water that is equal to 65 m of sea level rise. A plausible history of atmospheric CO2 over the past 65 million years is shown in Fig. 10. This particular CO2 history is inferred from the record of deep-sea temperature derived from the oxygen isotope records of bottom-dwelling foraminifera Reference Zachos, Pagani, Sloan, Thomas and Billups86 ; it is generally consistent with other measurements and estimates. Reference Beerling and Royer5,Reference Pagani, Zachos, Freeman, Tipple and Bohaty63,Reference Pearson and Palmer66 The record shows that atmospheric CO2 was high about 50 million years ago (≥1000 ppm) and decreased systematically between 50 and about 35 million years ago. Prior to about 34–38 Ma, there were no Antarctic ice sheets. Studies suggest that the Antarctic glaciers did not start to form until the atmospheric CO2 concentration decreased to below about 600–700 ppm. Reference DeConto and Pollard21 Hence, if atmospheric CO2 remains above this level for 10,000 years or more, it will mean that the conditions may be suitable to cause melting of the East Antarctic ice sheet. Ten thousand years is probably not enough time to melt a large fraction of the East Antarctic ice sheet because it is so large, but exactly how much could melt is uncertain.
During the time that ocean acidification and deep sea carbonate dissolution are helping to lower atmospheric CO2, the weathering cycle will also be contributing to reducing atmospheric CO2. However, because the time scale for that process is order 100,000 years, it will not be doing much in comparison to the other processes. Nevertheless, once the effect of dissolution of deep-sea calcite is exhausted, then only the weathering process will be operating to lower atmospheric CO2. Consequently, it would take another 100,000 years or more to get the atmospheric CO2 concentration from 600–700 ppm back to 280 ppm solely by natural processes.
The curves shown in Fig. 11 suggest that the next 50–100 years is a critical time. Whatever we decide to do may determine the Earth's climate for the next 10,000 to 100,000 years. In terms of climate and carbon cycles, the 21st is the most important century in Earth's history at least since the end of the last Ice Age. We apparently have the option to return the atmosphere to a state that it was last in 50–150 million years ago. This is an exciting, if dangerous, experiment, and one for which we cannot precisely predict the outcome because, as far as we know, the Earth's atmosphere has never before gone from 280 to 2000 ppm CO2 in 200 years.
Undoing the deed with engineering and discovery
There are of course options for limiting emissions of fossil carbon to the atmosphere. One obvious one is to stop burning carbon as an energy source, replacing carbon fuel combustion with other forms of energy production such as solar, wind, and nuclear. Reference Caldeira, Jain and Hoffert13,Reference Pacala and Socolow62 Getting to this point is expected to take many decades, and the problem globally is that the demand for energy is growing faster than the production rate of these alternative energy sources, especially in countries outside of Europe and North America. Reference LeQuere44 Solar, wind, nuclear, and hydroelectric can provide for electricity production but will not be suitable for air or sea transportation, so there is still a need for liquid fuels. The hope is that biofuels or fuels from artificial photosynthesis can be used for these transportation applications. 57 Biofuel and fuels made by artificial photosynthesis, at least ideally, could be near-zero net carbon sources to the atmosphere since the carbon in the fuel comes from the atmosphere through photosynthesis.
An alternative technology that would allow for some continued carbon combustion is carbon capture and storage (CCS). In CCS, carbon released from large stationary sources like coal- and natural gas-powered electricity plants would be captured, compressed into a denser supercritical state, and injected underground into deep porous rock formations situated more than 1 km below the Earth's surface. Reference Benson and Cook6 Ideally, the injected CO2 would be permanently retained underground, and in the long term could be returned to permanent geologic storage as carbonate minerals by the same process (weathering of silicate minerals to neutralize the acidifying effect of CO2 dissolved in subsurface water, followed by precipitation of carbonate minerals) that normally regulates CO2 levels in the atmosphere. If broadly deployed globally this technology could probably intercept about 3–5 GtC/yr from being released to the atmosphere, which would allow for some continued combustion of carbon-based fossil fuels. If applied to burning of biomass (formed with carbon from the atmosphere via photosynthesis) it could also allow for gradual extraction of CO2 from the atmosphere.
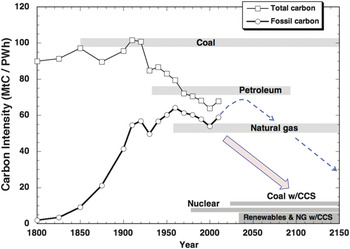
One measure of the efficacy of the global energy system is the carbon emission intensity of energy production—the amount of carbon released to the atmosphere per unit energy produced. 57 Although this measure is not discussed frequently, it provides a way to measure progress toward the ultimate energy goals. Currently, global primary energy production (the amount of energy released from the energy generation systems; not the amount actually available for use) is roughly 160 Petawatt-hour (PWh) per year. This energy generation is associated with the release of 10 GtC/yr, so the intensity is about 63 MtC/PWh (MtC = 106 metric tons of carbon; Fig. 13). Globally, this number has decreased since about 1900 as coal- and wood combustion have gradually been replaced first by oil, and then by natural gas, hydroelectric, and other noncarbon energy sources. However, prior to about 1850, most of the combusted carbon fuel was not fossil carbon. In terms of fossil carbon combusted per unit energy produced, the carbon intensity increased from near zero in 1800 (prior to widespread coal use) to a maximum of about 65 MtC/PWh in 1960. Subsequently, in the latter part of the 20th century this number was decreasing, but starting in 2000 it started to rise again due to extensive construction of coal-fired power plants in China and India. Ultimately, the intensity needs to decrease to less than 5 MtC/PWh by next century to keep integrated global carbon emissions below about 1200–1500 Gt carbon and still meet projected energy demand. This number can only be achieved by a combination of noncarbon energy sources and combustion with CCS. In the interim, switching from coal to natural gas, increasing the efficiency of coal-fired power generation, and replacing oil and its by-products with fuels produced from biomass or artificial photosynthesis will help. To reach the target, the carbon intensity of energy generation needs to decrease by about 5 MtC/PWh each decade until the middle of next century (Fig. 13).
Carbon intensity of global primary energy production (squares and light line) from 1800 to 2010. Prior to the early 1900s, coal and biomass were the main sources of energy, so the carbon intensity of energy production reflects their relatively low efficiency (90–100 MtC/PWh). Subsequent to about 1920, the gradual addition of petroleum, then natural gas, nuclear, hydro, and renewables, caused a systematic decrease in carbon intensity through 2000. Since 2000, the large number of new coal-fired power plants in China and India has reversed the trend. Reference LeQuere44 The carbon intensity for fossil carbon (circles and bold line) shows a different trend. From 1800 to 1920, the proportion of energy generated from coal rather than biomass increased until about half of energy production was from coal. Fossil carbon intensity continued to increase through 1960 but at a slower rate as a larger proportion of energy was generated from petroleum. Subsequent to 1960, the trend was downward as natural gas, nuclear, and hydropower played a larger role. The ultimate objective for next century is to get the fossil intensity down to below 5 MtC/PWh. This objective will require that carbon intensity decrease by 4–5 MtC/PWh each decade, which means systematically shifting to nuclear and renewables plus possibly CCS-aided coal and natural gas combustion. The recent announcement by China that it will not reach peak carbon emissions until 2030, means that the necessary steep trajectory toward low intensity will have been set back by 30–40 years. The difference between the two arrows shown represents approximately an additional 1200 GtC of total emissions. This graph also shows that while natural gas combustion is preferable to coal and petroleum, its carbon intensity is still far too high to get to the needed levels by next century. The carbon intensity numbers for the various energy sources are adapted from Ref. 58 and other sources.

Summary and conclusions
The Earth's natural systems move carbon among the various forms (minerals, living and dead organic material, CO2 and methane, dissolved carbon, etc.) and reservoirs (atmosphere, oceans, biosphere, soils, crust, and mantle) it exists in and on the Earth. Atmospheric CO2 concentration has varied between the recent ice age values of about 170 ppm, to levels that may have been more than a thousand times higher billions of years ago. However, natural Earth processes always move carbon very slowly, and the previous high atmospheric carbon concentrations occurred long before humans had evolved. Since humans have existed—the last 1–2 million years—the Earth's atmosphere has never had more than about 300 ppm CO2 until 65 years ago.
The only way that the atmospheric CO2 concentration can increase by a large factor, as it is doing now, is by transfer of carbon from geologic storage—as coal, oil, gas, limestone—to the atmosphere, where it is then distributed between the surface reservoirs (atmosphere, oceans, biosphere, soils) within a matter of decades. The normal transfer rate of geologic carbon to the atmosphere is about 0.2–0.25 GtC/yr, and in extreme and rare cases far in the geologic past that are considered to have been catastrophic to climate and life, this rate may have been temporarily as high as 0.5 to 1.4 GtC/yr. The modern rate due to fossil fuel combustion and cement production reached 10 GtC/yr in 2014, which is 40–50 times higher than the normal rate and about 10 times higher than the highest rate documentable in the geologic record. The current rate of transfer of carbon from geologic storage to the atmosphere is unprecedented in Earth history, especially as it is occurring during a time of polar glaciation and low atmospheric CO2 concentration, and consequently there are uncertainties in predicting the Earth system response. Ancient examples of periods of exceptional carbon transfer rates are inadequate analogs because they occurred at times when climates were warmer, there were no polar ice caps, and atmospheric CO2 concentrations were already much higher.
Until now (2014) about 400 Gt carbon has been transferred from geologic storage to the atmosphere by combustion of fossil fuel and production of cement. Reference Ciais, Sabine, Bala, Bopp, Brovkin, Canadell, Chhabra, DeFries, Galloway, Heimann, Jones, Le Quéré, Myneni, Piao, Thornton, Stocker, Qin, Plattner, Tignor, Allen, Boschung, Nauels, Xia, Bex and Midgley15 With major decreases over the next several decades in the fraction of global energy production coming from fossil fuel combustion, the total amount transferred might be held to 1200–1500 Gt carbon. In the absence of such drastic changes, the current increasing rate of emissions suggests that up to 5000 Gt carbon could be transferred to the atmosphere over the next 200 years or so. There is a huge difference in outcomes for these two scenarios. If “natural” processes are left to remove and redistribute the excess atmospheric carbon, their natural sluggish operation will take tens to hundreds of thousands of years to return the atmospheric CO2 concentrations to values below 300 ppm that are normal for human habitation. Although the current uptake of carbon by both the oceans and the land biosphere is a “natural” process in that the process happens without any purposeful intervention by man, the rates of uptake are unnatural. The current and anticipated uptake rates are larger than the normal rates by about 50 times for the oceans, and even more for the land biosphere. If a goal of limiting atmospheric CO2 concentrations to less than about 600 ppm (still worrisomely high) is to be addressed with new types of energy production combined with CO2 mitigation technologies such as CCS, the objective must be to decrease the carbon intensity of energy production from its current value of 65 MtC/PWh to about 5 MtC/PWh by 2150. To achieve this objective, the carbon intensity needs to decrease by 5 MtC/PWh each decade starting now. Delays will mean that the rate of decrease will need to be faster to achieve the same limit on total integrated emissions.
Acknowledgments
The author thanks A.P. Alivisatos and S.M. Benson for encouragement to prepare this review, and to the Office of Science, Department of Energy, for its support of an Energy Frontier Research Center in carbon storage science.