Introduction
The timing of leaf flush, flowering and fruiting governs resource availability in tropical forests and is controlled by an interplay of distinct classes of drivers (Morellato et al. Reference Morellato, Camargo, Gressler and Schwartz2013; Reich Reference Reich1995; van Schaik et al. Reference van Schaik, Terborgh and Wright1993). We distinguish three throughout: abiotic environmental cueing (responses to microclimatic variables such as water availability, light, temperature and photoperiod); endogenous rhythm (internal developmental pacing largely independent of immediate conditions); and biotic selective pressures (imposed by pollinators, seed predators and herbivores). These are not mutually exclusive; our focus is the spatial signature of abiotic cueing, which the others may reinforce or erode.
At broad scales, abiotic cueing generates striking spatial synchrony in reproduction: interannual seed production is correlated over hundreds of kilometres through the spatial coherence of weather (the Moran effect: Koenig Reference Koenig1999; Koenig and Knops Reference Koenig and Knops2013; Liebhold et al. Reference Liebhold, Koenig and Bjørnstad2004; Moran Reference Moran1953) reinforced at shorter range by pollen coupling (Satake and Iwasa Reference Satake and Iwasa2002). Biotic pressures, by contrast, are expected to weigh most heavily on reproductive phenology, especially in weakly seasonal forests where the abiotic cue is muted: flowering and fruiting synchrony is classically understood through its consequences for pollination and seed-predator satiation (Augspurger Reference Augspurger1981, Reference Augspurger1983; Bawa Reference Bawa1990). This reproductive selection can differ among sexual systems: dioecious species are obligately outcrossing and more pollinator-dependent than hermaphroditic ones (Bawa Reference Bawa1990), so if pollinator-mediated selection structures reproductive timing, sexual systems might differ in how their reproductive phenophases are patterned.
Between these scales lies a gap. If the abiotic cues that trigger phenophases vary among microsites (as soil water, drainage, light and topography are known to vary over tens of metres, structuring tropical tree distributions and water relations (Borchert Reference Borchert1994; Clark et al. Reference Clark, Palmer and Clark1999)), then the timing of cued phenophases should be spatially autocorrelated at the within-stand scale, with nearby conspecifics more similar in timing than distant ones. Tropical tree phenologies are diverse, from annual to continual and subannual patterns that follow no fixed calendar (Newstrom et al. Reference Newstrom, Frankie and Baker1994); we therefore treat the four phenophases not as a schedule every species obeys but as an ordered developmental series: leaf flush and flowering as cue-proximate initiation events, fruit development and ripening as their downstream consequences after a developmental lag (Borchert et al. Reference Borchert, Meyer, Felger and Porter-Bolland2004; Wright and Calderón Reference Wright and Calderón2006). Because leaf flush is expressed closest to its abiotic trigger and is not mediated by the pollinators and dispersers that intervene before seed maturation, we expect it to record a microsite cue most directly and its spatial autocorrelation to be strongest. The question is sharpened in a perhumid forest, where near-continuous rainfall weakens the seasonal cue and endogenous control is expected to dominate (Reich Reference Reich1995; Wright and van Schaik Reference Wright and van Schaik1994); detecting spatial structure there would imply that microsite-scale cueing operates even where the seasonal signal is muted.
We addressed these questions with a decade of weekly phenological monitoring in a Neotropical perhumid forest, using the spatial autocorrelation of timing as an indirect read on the relative roles of abiotic and endogenous control. We hypothesised that the timing of environmentally cued phenophases carries a microsite imprint: because the abiotic cues that trigger phenophases are spatially structured, neighbouring conspecifics should be more similar in timing than distant ones, with the imprint set at initiation and progressively diluted as endogenous developmental pacing accumulates downstream. This hypothesis yields three predictions. (i) For each phenophase, conspecifics sharing a transect will show more similar timing anomalies than conspecifics on different transects, i.e., a positive within- versus between-transect gradient. (ii) This gradient will be strongest for cue-proximate leaf flush and weaker for the cue-distal reproductive phenophases; furthermore, if endogenous pacing overwrites the initiation cue the gradient should decay to zero by ripening, whereas if the imprint is carried through development, it should persist as a low, non-zero plateau. (iii) Because abiotic microsite cueing acts independently of how reproductive function is distributed among individuals, the leaf-flush gradient will be positive in hermaphroditic, polygamous and dioecious species alike; if, on the other hand, pollinator-mediated selection dominates, the reproductive gradients should differ among sexual systems.
Methods
Study site and phenological sampling
We studied phenology at La Flor de Catemaco (18°26′43″ N, 95°02′49″ W), a fragment of lowland evergreen rainforest in the Los Tuxtlas Biosphere Reserve, Veracruz, Mexico. The climate is tropical perhumid (mean annual rainfall ∼ 3,800 mm) with a mild dry season (February–May). We located 20 transects (50 × 2 m) across the fragment; the transects are the spatial sampling units and were not further grouped. Within each transect, we marked the four trees with diameter at breast height ≥ 10 cm nearest to each of six 10-m points, yielding 24 trees per transect and 480 trees in total, each georeferenced (UTM Zone 15N). All trees were scored weekly from January 2012 to December 2021 (491 sessions) for five phenophases on the Fournier (Reference Fournier1974) ordinal scale (0 = absent to 4 = 76–100% of crown). We restricted analyses to the 32 species with at least five individuals (377 trees), classified from published breeding-system accounts as hermaphroditic (HERM; 20 species, 232 trees), polygamous (POLY; 5 species, 54 trees) or dioecious (DIO; 7 species, 91 trees; Table S1) and analysed the four sequential phenophases: young leaves, flowers, unripe fruits and ripe fruits.
Data analysis
For each species and phenophase, we assembled a tree-by-week matrix of ordinal scores across all 491 weekly sessions. We removed the seasonal signal (the recurring within-year cycle shared by conspecifics) by subtracting, from each tree in each week, the mean score of all conspecifics that week (the species-by-week mean), yielding within-species weekly timing anomalies, the deviation of each tree from the typical conspecific value at that moment. This centring removes the variation shared among conspecifics, including the seasonal cycle and any year-to-year shifts common to the species and isolates each tree’s departure from its conspecifics. We standardised each tree’s anomaly series to unit variance over time so that high-amplitude trees did not dominate, excluded any tree with no temporal variation in a phenophase and computed the Pearson correlation of the standardised series for every conspecific pair. Because conspecific-mean centring imposes a sum-to-zero constraint across trees within each week, these correlations are negative on average; their absolute value is not interpretable, and only their change with inter-tree distance carries information about spatial structure.
We summarised the distance decay descriptively by binning conspecific pairs into three classes from their georeferenced positions: within transect (mean separation 22 m, all pairs ≤ 60 m), intermediate (centred near 200 m) and far (centred near 820 m; maximum ∼ 1,500 m). For inference, we used a single per-species statistic, the within- versus between-transect gradient: the difference in mean anomaly correlation between conspecifics sharing a transect and conspecifics on different transects. Trees on the same 50-m transect are the only pairs separated by distances at the scale of local microsite variation, so this contrast isolates fine-scale structure without assuming a functional form for the decay. Treating species as the unit of replication, we tested within each sexual system whether the gradient was positive (one-sided Wilcoxon signed-rank test) and reported the mean gradient, the number of species with a positive gradient and the P-value per phenophase and stratum. A within-species permutation of tree positions (999 permutations) confirmed the gradient is unbiased under the null (mean null gradient < 0.003); we avoided a permutation test on conspecific pairs pooled across species, whose null is negatively biased and over-powered by cross-species composition. To test formally whether the gradient varied with phenophase and sexual system (and to evaluate sexual system as a covariate, as opposed to comparing strata separately), we modelled the per-species gradient as a function of phenophase, sexual system and their interaction (ordinary least squares, with species-clustered robust standard errors; the species random-intercept variance was negligible), assessing terms by Type II analysis of variance and corroborating with nonparametric tests (Kruskal–Wallis across sexual systems within phenophases; Mann–Whitney for leaf flush versus the pooled reproductive phenophases). We did not fit parametric variograms, whose range parameter was not identifiable given the transect design. Analyses used R (R Core Team 2026).
Results
Conspecific anomaly correlation declined with inter-tree distance for every phenophase in every sexual system (Figure 1a), confirming short-range spatial autocorrelation of phenological timing. Elevated similarity was concentrated among trees sharing a transect and had relaxed to the long-distance level by the intermediate (∼200 m) class, staying flat to the maximum separation sampled (∼1.5 km; Figure 1a); the autocorrelation range is therefore short (of the order of tens of metres) but weakly identified given the transect design.
Spatial autocorrelation of phenological timing at La Flor de Catemaco, a neotropical perhumid forest (Los Tuxtlas, Mexico), 2012–2021, by sexual system (HERM, hermaphroditic; POLY, polygamous; DIO, dioecious). (a) Mean conspecific anomaly correlation in three inter-tree distance classes (within transect ∼ 25 m; ∼200 m; ∼820 m), species-weighted; a decline with distance indicates spatial autocorrelation. (b) Per-species within- versus between-transect gradient by phenophase; each point is a species, the bar is the stratum mean. Symbols above each group give the one-sided Wilcoxon signed-rank test of the gradient against zero (*** P < 0.001, ** P < 0.01, * P < 0.05; ns, not significant); with only four polygamous species, this test cannot fall below P = 0.06 even when all four are positive, so “ns” for polygamous young leaves (4/4 positive) reflects sample size, not absence of an effect. A model of the gradient (phenophase × sexual system) gave a significant phenophase effect (F3,104 = 4.47, P = 0.005) but no effect of sexual system (F2,104 = 1.06, P = 0.35) and no interaction (F6,104 = 0.16, P = 0.99).

Figure 1. Long description
Panel A: Three line graphs depict the mean conspecific anomaly correlation for three sexual systems (HERM, POLY, DIO) across three inter-tree distance classes (within transect ~25 m, ~200 m, ~820 m). The x-axis represents the distance classes, and the y-axis represents the mean conspecific anomaly correlation. Each line represents a different phenophase: young leaves, flowers, unripe fruits, and ripe fruits. The graphs show a decline in correlation with increasing distance, indicating spatial autocorrelation. Panel B: Three scatter plots with horizontal bars show the per-species within- versus between-transect gradient by phenophase for the same sexual systems. The x-axis represents different phenophases, and the y-axis represents the per-species gradient. Each point represents a species, and the horizontal bars represent the stratum mean. Symbols above each group indicate the significance of the Wilcoxon signed-rank test against zero. The graphs highlight the variation in gradients across different phenophases and sexual systems.
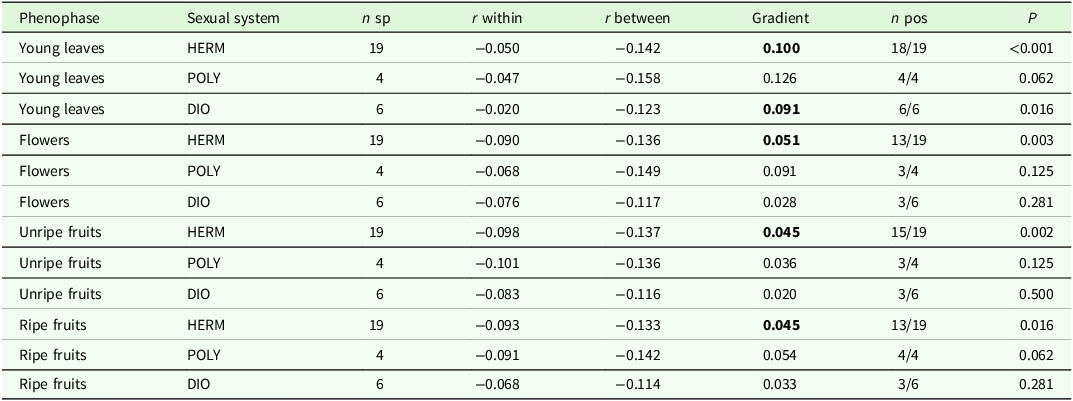
The strength of the autocorrelation was strongly graded along the sequence (Figure 1b; Table 1). Young-leaf flush carried the strongest imprint: the gradient was positive in 18 of 19 hermaphroditic species (mean 0.100, P < 0.001), all four polygamous (0.126, P = 0.06, the n = 4 test floor) and all six dioecious species (0.091, P = 0.016; Table 1). With 28 of 29 species positive, the leaf-flush imprint is robust across sexual systems. Across the reproductive sequence, the imprint was roughly half as strong and, critically, did not decline to zero toward ripening: in the well-replicated hermaphroditic stratum, the gradient remained significant for flowers (0.051, P = 0.003), unripe fruits (0.045, P = 0.002) and ripe fruits (0.045, P = 0.016), ripe fruit indistinguishable from flowers and unripe fruits (Table 1). The pattern was thus a single step down from leaf flush to a low but persistent reproductive plateau, not a graded fade to zero. Per-species gradients varied around these means (Figure 1b); even for leaf flush, the hermaphroditic values spanned roughly 0 to 0.22, so the signal is a consistent central tendency, not a uniform per-species effect.
Within- versus between-transect spatial structure of conspecific phenological timing anomalies at La Flor de Catemaco, a Neotropical perhumid forest (Los Tuxtlas, Mexico), by phenophase and sexual system. r values are mean conspecific anomaly correlations among trees sharing a transect (within) and on different transects (between), species-weighted; the gradient (within − between) is tested per stratum by a one-sided Wilcoxon signed-rank test with species as the unit of replication. n pos = species with a positive gradient. With four polygamous species, the Wilcoxon test cannot return P < 0.06 even when all species are positive

Table 1. Long description
A table with 12 rows and 7 columns comparing the spatial structure of conspecific phenological timing anomalies at La Flor de Catemaco. The columns are Phenophase, Sexual system, n sp, r within, r between, Gradient, n pos, and P. The table includes data for different phenophases (Young leaves, Flowers, Unripe fruits, Ripe fruits) and sexual systems (HERM, POLY, DIO). Each row provides specific values for the number of species (n sp), correlation within transects (r within), correlation between transects (r between), gradient (within - between), number of species with a positive gradient (n pos), and the P-value (P). Notable trends include positive gradients for young leaves across all sexual systems and significant gradients for flowers, unripe fruits, and ripe fruits in hermaphroditic species.
Bold gradients are significant at P < 0.05.
A model of the per-species gradient confirmed these patterns (Figure 1b): it differed among phenophases (F3,104 = 4.47, P = 0.005; every reproductive phenophase below leaf flush) but not among sexual systems (F2,104 = 1.06, P = 0.35), with a negligible interaction (F6,104 = 0.16, P = 0.99). Nonparametric tests agreed (leaf flush > pooled reproductive phenophases, Mann–Whitney P < 0.001; no difference among sexual systems within any phenophase, Kruskal–Wallis all P ≥ 0.37). Sexual system thus explained little variance in autocorrelation strength for reproductive phenophases as well as for leaf flush.
Discussion
Phenological timing in this perhumid forest is spatially autocorrelated at short range and the autocorrelation is graded along the developmental sequence. We interpret this as a microsite imprint on abiotically cued initiation: nearby conspecifics, sharing local conditions, flush leaves in closer synchrony than distant ones, consistent with the documented fine-scale heterogeneity of soil water and light in tropical forests (Borchert Reference Borchert1994; Clark et al. Reference Clark, Palmer and Clark1999) and with the microsite control of leaf phenology that water-relations studies infer at the individual level (Reich Reference Reich1995). That this structure appears at all is notable in a perhumid forest, where weak seasonality is expected to favour endogenous control (Reich Reference Reich1995; Wright and van Schaik Reference Wright and van Schaik1994); its presence implies that microsite-scale variation in the cueing environment imposes detectable spatial order even when the community-wide seasonal signal is muted. The phenomenon is the fine-scale, intra-annual analogue of the Moran effect that synchronises masting at landscape scale (Koenig and Knops Reference Koenig and Knops2013).
Three features refine this interpretation. First, the imprint attenuates but does not vanish: the ripe-fruit gradient remained significant and indistinguishable from that of flowering, implying that the microsite signal set at initiation is partly carried through months of development, plausibly because individuals that flush and flower early at favourable microsites also advance through fruiting, rather than being overwritten by endogenous pacing (cf. Borchert et al. Reference Borchert, Meyer, Felger and Porter-Bolland2004; Wright and Calderón Reference Wright and Calderón2006). Second, the most strongly structured phenophase is vegetative, not reproductive, unexpected against the tradition that treats flowering synchrony as the salient community signal (Augspurger Reference Augspurger1981, Reference Augspurger1983). Both vegetative and reproductive phenophases are under biotic selection, but of contrasting kinds. Young leaves suffer intense herbivory and synchronous leaf flush is itself a herbivore-satiation defence (Aide Reference Aide1993; Coley and Barone Reference Coley and Barone1996); because satiation favours flushing in synchrony with neighbours (which share both herbivores and microsite), this pressure reinforces rather than erodes a microsite-aligned signal. Reproductive timing, by contrast, is shaped by pollinators and seed predators (Augspurger Reference Augspurger1981, Reference Augspurger1983; Bawa Reference Bawa1990), selection acting at the scale of the pollinator’s foraging and mate-finding neighbourhood rather than the microsite, which can sharpen or disperse timing and so blur the microsite imprint in flowering and fruiting. We therefore do not claim that leaf flush is free of biotic selection; it is not, but that the biotic selection acting on it is compatible with, rather than opposed to, a microsite-aligned spatial signal. Third, neither the leaf-flush imprint nor the reproductive gradients differed among sexual systems. This is expected for a vegetative phenophase, but more notable for reproduction: dioecious species, being obligately outcrossing and more pollinator-dependent (Bawa Reference Bawa1990), might have been expected to show reproductive timing more strongly structured by the pollinator neighbourhood, yet we detected no such difference. Either pollinator-mediated selection does not translate into detectable spatial structure of reproductive timing at this scale, or, with only four polygamous and six dioecious species, our power to detect it is limited.
The pattern also has an ecological consequence invisible to community-mean analyses: because the imprint is positive at short range, neighbouring conspecifics flush young leaves, a key resource for tropical folivores (van Schaik et al. Reference van Schaik, Terborgh and Wright1993), in closer synchrony than distant ones, clustering this resource in space as well as time, albeit modestly against the dominant seasonal cycle.
Several limitations bound these inferences. Microsite is inferred from spatial pattern, not measured and disentangling abiotic cueing from the biotic pressures above would require data we lack; effect sizes are modest (gradients ∼ 0.05–0.13); and the reproductive plateau is established with confidence only for hermaphrodites, the other strata being under-replicated. Notwithstanding, the spatial autocorrelation of timing offers a complementary line of evidence to the usual temporal diagnostics of phenological control (Garwood et al. Reference Garwood, Metz, Queenborough, Persson, Wright, Burslem, Zambrano and Valencia2023; Mendoza et al. Reference Mendoza, Peres and Morellato2017) and indicates that abiotic cueing of initiation leaves a fine-scale spatial fingerprint that persists, faintly, to fruit ripening, regardless of sexual system. Testing this directly will require tree-scale soil, drainage and light data and larger dioecious and polygamous samples.
Supplementary material
The supplementary material for this article can be found at https://doi.org/10.1017/S0266467426100790.
Data availability statement
Data and code are available at https://figshare.com/s/5bc243fdd76823889f0c
Acknowledgements
We thank field assistants, students, and volunteers that were involved in data collection, as well as to the management of La Flor de Catemaco S.A. de C.V. for permission of access to the property. We thank D. Canales Espinosa for continued mentoring and support and to A. Molina for her vital administrative assistance, as well as to two anonymous reviewers that provided very useful feedback on a previous version of the study. We thank Mariana and Fernando for constant support and inspiration to study tropical ecology.
Author contributions
Pedro Américo Duarte A.D. Dias and Ariadna Rangel Negrín conceived the study, performed the analyses and wrote the manuscript.
Financial support
This work was supported by the Instituto de Neuro-etología and Posgrado en Neuroetología, Universidad Veracruzana; the Secretaría de Ciencia, Humanidades, Tecnología e Innovación (SECIHTI); the Leakey Foundation; the Consejo Veracruzano de Investigación Científica y Desarrollo Tecnológico; and Idea Wild.
Competing interests
The authors declare none.
Use of artificial intelligence (AI) tools
We used Paperpal to improve English grammar and clarity and checked results of this use for accuracy, biases and proper citation.