Clays are layered minerals also known as phyllosilicates, found as fine powders with particle sizes of <20 μm (Tan et al., Reference Tan, Liu, Hu, Reed, Furukawa and Zhang2017). Natural compounds such as kaolinite, smectite, sepiolite and palygorskite (Park et al., Reference Park, Choy, Oh, Kim, Hwang and Choy2008; Tateo et al., Reference Tateo, Summa, Giannossi and Ferraro2006) which are considered to be essentially non-toxic and non-irritant, are used extensively in natural health products (Lopez-Galindo & Viseras, Reference López-Galindo and Viseras2004; Lopez-Galindo et al., Reference López-Galindo, Viseras and Cerezo2007; Choy et al., Reference Choy, Choi, Oh and Park2007; Viseras et al., Reference Viseras, Aguzzi, Cerezo and Lopez–Galindo2007; Ferrell, Reference Ferrell2008; Williams et al., Reference Williams, Haydel, Giese and Eberl2008). The functions of clay minerals depend on their characteristics such as colour, particle size, charge density, specific surface area, cation exchange capacity, swelling capacity, rheological properties, structural plasticity, and chemical composition (Karakaya et al., Reference Karakaya, Karakaya, Sarioğlan and Koral2010; Silva et al., Reference Silva, Oliveira, Farias, Fávaro and Mazzilli2011; Silva-Valenzuela et al., Reference Silva-Valenzuela, Matos, Shah, Carvalho, Sayeg and Valenzuela-Diaz2013; Roselli et al., Reference Roselli, Desideri, Rongoni, Meli and Feduzi2015, Mattioli et al. Reference Mattioli, Giardini, Roselli and Desideri2016). The clay materials are used for external applications such as facial treatment (Ngomo et al., Reference Ngomo, Sieliechi, Tchatchueng, Kamga, Tabacaru, Dinica and Praisler2014), skin treatment (Pusch, Reference Pusch2014; Viseras et al., Reference Viseras, Carazo, Borrego-Sánchez, García-Villén, Sánchez-Espejo, Cerezo and Aguzzi2019), as active principals or excipients (Carretero & Pozo, Reference Carretero and Pozo2009, Reference Carretero and Pozo2010; Chen et al., Reference Chen, Zhou, Liu and Liang2010, Arab & Alshikh, Reference Arab and Alshikh2012), in biomedical applications (Kim et al., Reference Kim, Choi, Elzatahry, Vinu, Choy and Choy2016), and in pelotherapy (Quintela et al., Reference Quintela, Terroso, Da Silva and Rocha2012; Sánchez-Espejo et al., Reference Sánchez-Espejo, Aguzzi, Cerezo, Salcedo, López-Galindo and Viseras2014). Clay-based health products take the form of creams, powders, and emulsions conforming with major pharmacopeial requirements (Gamoudi & Srasra, Reference Gamoudi and Srasra2017, Reference Gamoudi and Srasra2018). The benefit of using clay minerals in health products can be improved by using natural compounds such as plants and flowers.
Flowers have been used by humans since ancient times, mainly as medicinal or functional products, with particular beneficial effects on human health, e.g. flowers of the genus Malva have been used widely in traditional and ethno-veterinary medicines. Leaves and fruits have potent anti-inflammatory, antioxidant, anti-ulcerogenic and anti-cancer properties, as well as being useful in terms of skin-tissue integrity, gastric treatments and therapeutic activities (Ballero et al., Reference Ballero, Poli, Sacchetti and Loi2001; Classen & Blaschek, Reference Classen and Blaschek2002; Cornara et al., Reference Cornara, Rocca, Marsili and Mariotti2009; Idolo et al., Reference Idolo, Motti and Mazzoleni2010; Samavati & Manoochehrizade, Reference Samavati and Manoochehrizade2013; Nasiri et al., Reference Nasiri, Hosseinimehr, Azadbakht, Akbari, Enayati-Fard and Azizi2015). Some of these flower properties are related to the bioactive compounds and derived mainly from the pigments, which are chemical compounds that absorb light in the wavelength range of the visible region. The pigments found in plants play important roles in plant metabolism and visual attraction in nature (Goodwin, Reference Goodwin1976, Reference Goodwin1988; Gross, Reference Gross1987, Reference Gross1991; Kost, Reference Kost1988). The main species of pigments responsible for plant colours are chlorophylls, carotenoids and flavonoids. Chlorophylls show various structures (chlorophyll a, b, c1, c2, d and f) and are responsible for the green colour; carotenoids (xanthophylls and carotenes) are the sources of the yellow, orange, and red colours, playing a pivotal role in photosynthesis (Bauernfeind, Reference Bauernfeind1981; Dailey, Reference Dailey1990; Young & Britton, Reference Young and Britton1993). Flavonoids include red or blue anthocyanins and white or pale-yellow compounds such as rutin, quercitin, and kaempferol (Mazza & Miniati, Reference Mazza and Miniati1993).
The purpose of this work was to evaluate Tunisian clay for use in cosmetic applications. Green synthesis of new, coloured hybrids using two natural compounds, purified clay and flower powders, was studied. The identification of floral pigments was performed by UV-vis and HPLC-DAD. The hybrids studied were obtained by solid–solid reaction without using toxic solvents or reagents. The samples were characterized using XRD and FTIR.
Methods and materials
Characterization of Tunisian flowers
Pre-treatment of the flowers studied
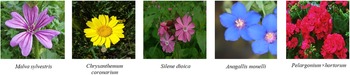
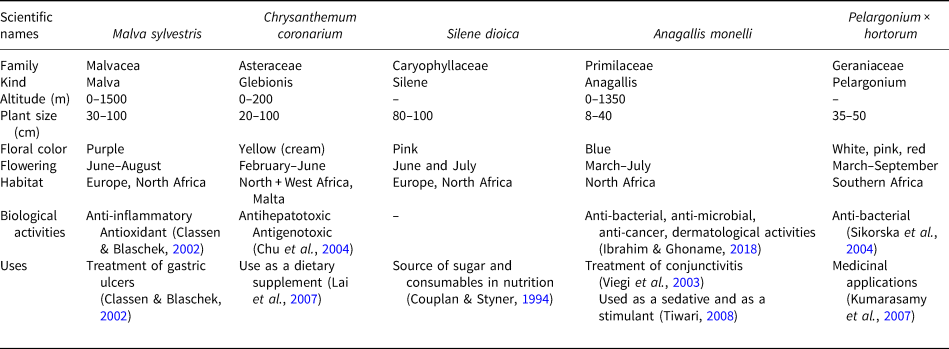
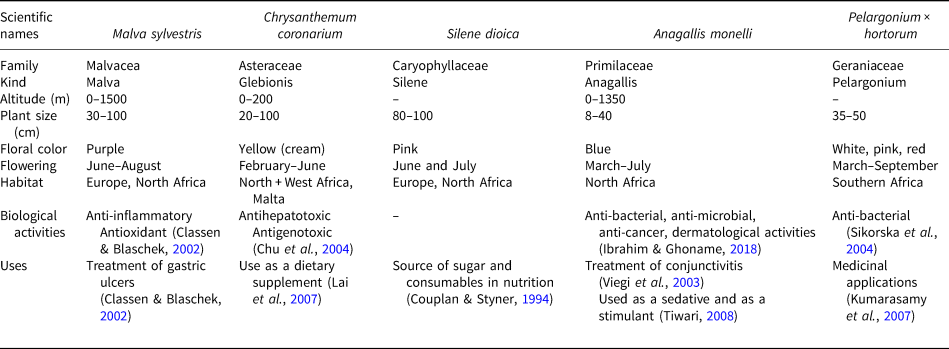
The flowers were harvested from Borj Cédria, a town southwest of Tunis. The five flowers selected were: Malva sylvestris (purple colour), Chrysanthemum coronarium (yellow), Silene dioica (pink), Anagallis monelli (blue) and Pelargonium × hortorum (red) (Fig. 1). The botanical descriptions of these flowers are presented in Table 1. These flowers were selected, mainly, for the following reasons: (1) they are natural and present a variety of colours; and (2) they exhibit different biological activities including use for anti-inflammatory purposes. Indeed, these flowers are used in pharmaceutical as well as cosmetic fields. These are in addition to their wide use in the field of nutrition (Table 1). The flowers were pretreated by rinsing with distilled water and then drying for 2 weeks in the shade. After drying, the studied samples were crushed using a mortar and sieved using a mesh with a diameter of 106 μm. The flower types were abbreviated as M (Malva sylvestris), C (Chrysanthemum coronarium), S (Silene dioica), A (Anagallis monelli) and P (Pelargonium × hortorum), respectively.
The flowers studied.

Botanical description, various biological activities and the uses of flowers.
Identification and determination of floral pigments
All spectrophotometric measurements were made using a UV-vis spectrophotometer (Evolution 300, Thermoscientific, UK).
The high-performance liquid chromatography (HPLC) instrument used is a 1200 Series instrument with diode array detector (DAD) (from Agilent Technologies, Waldbronn, Germany), scanning from 200 to 600 nm.
To determine chlorphylls a and b, a mixture of 1 g of each sample and 10 mL of acetone (90%) was crushed manually. The samples were then homogenized using an Ultra-turrax dispersing instrument (IKA®-Werke GmbH & Co. KG, Staufen, Germany) at 17 mV for 1 min and then shaken in a vortex. The mixture was left standing in the dark for 1 h and centrifuged for 5 min. The absorbance of supernatants was measured at 665, 645 and 630 nm. The calculation was done using Equations 1 & 2 to determine the concentrations of chlorophylls a and b (Lichtenthaler, Reference Lichtenthaler1987). The results are expressed as mg/g DW.


where: A665, A645 and A645 are absorbance values measured at 665 nm, 645 nm and 630 nm, respectively.
To determine carotenoids in the flowers, the method of Gonzalez-Barrio et al. (Reference González-Barrio, Periago, Luna-Recio, García-Alonso and Navarro-González2018), adapted from Böhm (Reference Böhm2001) was used. Briefly, 0.1 g of lyophilized flowers was homogenized with 5 mL of methanol/tetrahydrofuran (1/1, v/v) containing 0.1% butylated hydroxytoluene, using a tissue ruptor. The extraction was repeated twice, until the residual tissue became colourless, and the combined extracts were dried under vacuum at 310 K in a rotatory evaporator. The residue was resuspended in 2 mL of tert-butyl methyl ether and MeOH (50:50, v:v), centrifuged, filtered, and analyzed by HPLC-DAD.
To analyse for individual phenolic compounds, the methodology described by Navarro-González et al. (2015) was used. Dried flowers (0.1 g) were extracted separately in covered Erlenmeyer flasks with 10 mL of acidified ethanol (80% ethanol, 19% H2O, and 1% formic acid, v/v/v) overnight at room temperature, on an orbital shaker. The ethanolic flower extracts were concentrated under reduced pressure at 303 K. Then, the extracts were resuspended in 10 mL of water and passed through a C18-SPE column, previously activated with 10 mL of methanol followed by 10 mL of water. The cartridge was washed with 10 mL of water and compounds of interest were eluted with 2 mL of methanol, centrifuged at 20.82 g for 10 min at room temperature, filtered, and quantified on an HPLC-DAD.
Total flavonoid analysis was conducted following the colorimetric assay described by Dewanto et al. (Reference Dewanto, Wu, Adom and Liu2002). The extracts of flowers described above for phenolic compound analysis were used. The flavonoid contents were determined from the calibration curves. The solvent mixture contained 0.1 g of crushed flowers. A 0.2 mL volume of the extract was mixed with 1.25 mL of distilled water, and then 0.08 mL of 5% NaNO2 was added. After 6 min, 0.16 mL of solution AlCl3.6H2O was added and left for 5 min before adding 0.5 mL of NaOH (1 mol L-1). Finally, 2.5 mL of distilled water was added by stirring in a tube shaker until a homogeneous solution was obtained. The absorbance was measured in the spectrophotometer at 510 nm using (+)-catechin (Sigma-Aldrich, St Louis, MO, USA) as a standard. The total flavonoids content was expressed in mg equivalent of catechin (CE).
Antioxidant activity – the determination of the absorption capacity of oxygen radicals (ORAC) – was carried out as described by Navarro-Gonzalez et al. (Reference Navarro-Gonzalez, González-Barrio, García-Valverde, Bautista-Ortín and Periago2015) using the method of Huang et al. (Reference Huang, Ou, Hampsch-Woodill, Flanagan and Prior2002) with some modifications. The ORAC assay is a fluorescence method based on the inhibition of a peroxy-radical-induced oxidation initiated by the thermal-based decomposition of 2,2’-azobis (2-amidino-propane) dihydrochloride (AAPH), using fluorescein as a fluorescent probe and Trolox as a standard substrate. This assay was carried out in 96-well black microplates using a fluorescent microplate reader (Synergy 2 multi-mode microplate reader, Winooski, VT, USA). Fluorescence filters with an excitation wavelength of 485 nm and an emission wavelength of 520 nm were used. Five standards were prepared using a phosphoric buffer solution (0.08 mol⋅L-1, pH 7.0) and a Trolox calibration solution. The results are expressed as μmol of Trolox equivalent (TE)/g of dry weight (DW).
The antioxidant power to reduce ferric ion measures the iron-reducing capacity of the sample reacting with a ferric (Fe3+)-tripyridyltriazine complex (colourless) to produce the ferrous (Fe2+) form (blue coloured) (Benzie & Strain, Reference Benzie and Strain1996). The following protocol was detailed by Gonzalez-Barrio et al. (Reference González-Barrio, Periago, Luna-Recio, García-Alonso and Navarro-González2018). Initially, a FRAP reagent was prepared by mixing 25 mL of sodium acetate solution (0.3 mol⋅L-1, pH = 3.6), 2.5 mL of TPTZ solution (0.01 mol⋅L-1) and 2.5 mL of FeCl3.6H2O (0.02 mol⋅L-1). Then, 0.1 mL of the previously prepared and diluted extract was added to 1 mL of FRAP reagent. The absorbance of the mixture appeared at 593 nm. Trolox was used as standard and the results were expressed as μmol Trolox equivalent (TE)/g DW.
Characterization of purified clay
Mineralogy and chemical characterization
The clay used here was obtained from El Fahs (northeastern Tunisia). The sample was processed to a <2μm size fraction by sedimentation in deionized water and was purified using the classical method of Van Olphen (Reference Van Olphen1963). This purification greatly decreased the associated impurities. The purified clay obtained was labelled as EP-Na.
X-ray diffraction patterns of the sample were recorded between 5 and 15°2θ at a scanning speed of 2°/min, using a PANalytical X'Pert High Score Plus diffractometer with monochromated Cu-Kα1 radiation (30 mA and 40 kV).
The CEC was determined using a method involving a copper ethylendiamine (EDA)2CuCl2 complex (Bergaya & Vayer, Reference Bergaya and Vayer1997).
Nitrogen adsorption measurements were performed at 77 K using an Autosorb-1 unit (Quantachrome, USA) for the determination of sample textural properties using the multipoint Brunauer-Emmet-Teller (BET) method. The samples were outgassed at 393 K under a vacuum at 10–3 mm Hg for 3.5 h.
In order to determine the chemical composition, the sample was attacked using a mixture of three acids (HCl, H2SO4, and HNO3). All of the constituent elements passed into solution, except the silica (SiO2) which was determined by gravimetry. The other elements, such as Al, Fe, Mg, Ca, Na and K were analysed by atomic absorption spectrophotometry (AAS).
Pharmaceutical tests
The swelling capacity was measured in dispersions of 2 g of clay in 100 mL by quantities of sediment volumes after 2 h (Gamoudi & Srasra, Reference Gamoudi and Srasra2018).
The volume of sedimentation was measured according to the US Pharmacopoeia (2007). The dispersion of 6 g of each clay sample in 200 mL of water was prepared with a high-speed mixer operating at 104 rpm. 100 mL of the dispersion was placed in a graduated cylinder and left to stand for 24 h. The volume of sedimentation was then measured by quantifying the volume of clear supernatant water after 24 h.
In accordance with the US Pharmacopoeia (2007), the pH value of a water-clay dispersion (1 g/50 mL) was measured after 2 min of continuous agitation.
Microbiological tests
The antimicrobial activity of the sample was tested against various pathogenic bacteria: Salmonella and Escherichia coli for pharmaceutical use and Staphylococcus aureus and Pseudomonas aeruginosa for cosmetic use. All antimicrobial tests were carried out in accordance with the US Pharmacopoeia (2007).
Synthesis and characterization of coloured hybrids
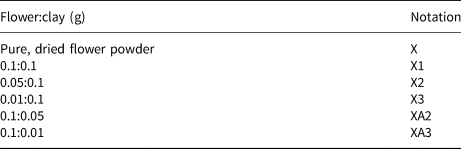
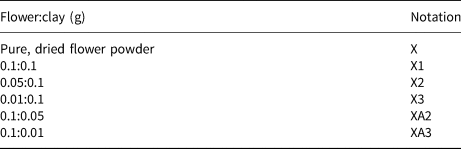
The preparation of coloured samples was carried out by solid–solid reaction. First, the leaves of flowers were washed with bi-distilled water and dried in a ventilated environment. The mixtures of clay EP-Na and dried flowers were ground manually with an agate pestle and mortar at room temperature for 10 min. The various mass ratios (clay: flower) are listed in Table 2. The reactivity of EP-Na on floral pigments was characterized by X-ray diffraction (XRD) and Fourier-transform infrared (FTIR) spectroscopy.
Mass ratios (flower:clay) for hybrids.
The spectrometer used in the present study was of a Perkin Elmer 180 type. The samples were prepared in the form of a pellet formed by a mass mixture composed of 99% KBr and 1% of the sample to be analyzed. It was noted that KBr does not present absorption bands in the range used (400 to 4000 cm–1) with a resolution of 2 cm–1 and a mirror velocity of 0.63 cm s−1.
Results and discussion
Determination of floral pigments
Determination of chlorophyll a and b
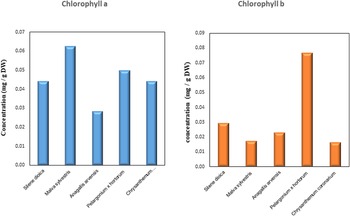
The quantities of chlorophylls recorded in each of the five flowers studied are shown in Fig. 2. Comparison of the results for chlorophyll a and chlorophyll b showed that there was more of the former present in all flowers except Pelargonium × hortorum. In addition, the amount of chlorophyll a was greatest in Malva (0.06 mg/g DW) and least in the Anagallis (0.03 mg/g DW). For chlorophyll b, it was greatest in the Pelargonium × hortorum (~0.08 mg/g DW) and very small in the Chrysanthemum coronarium (~0.02 mg/g DW).
Chlorophyll a and b contents in the five flowers studied.

Determination of carotenoid compositions
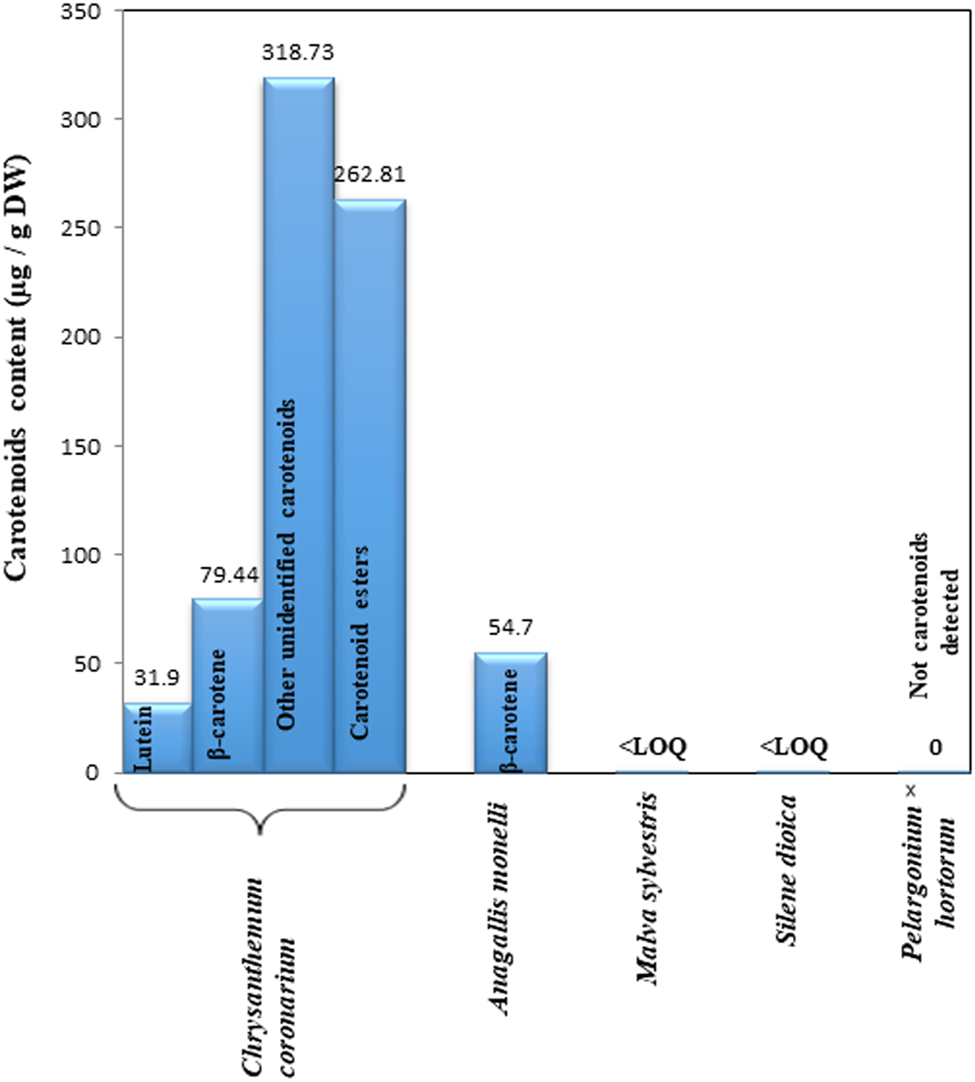
The carotenoid compositions of the five flowers studied are shown in Fig. 3. Elevated amounts were founded in Chrysanthemum coronarium (692.90 μg/g DW). This sample presented large values for various types of carotenoids, such as β-carotene, lutein, and carotenoids esters. These compounds were found only in Chrysanthemum coronarium; the yellow colour indicates the presence of the various carotenoids at significant levels. In Anagallis monellin, only β-carotene (54.70 μg/g DW) was detected. Silene dioica and Pelargonium × hortorum contain quantities of carotenoids which do not exceed the minimum LOQ (40 μg/g DW). An absence of carotenoids was noted for Malva.
Carotenoid compositions of the five flowers studied.

Determination of the total phenolic compounds
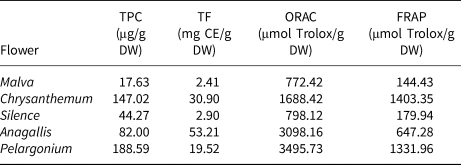
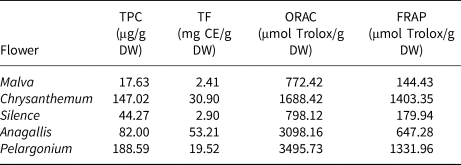
Metabolic products are found in plant foods, including polyphenols, which have important properties (biological and pharmacological) that protect against chronic diseases. In addition, the phenolic compounds neutralize the effects of reactive oxygen species and have greater antioxidant capacity than vitamin C (Shahidi & Wanasundara, Reference Shahidi and Wanasundara1992). The amounts of the total phenolic compound were determined by HPLC-DAD. For all of the samples studied, the results showed that Pelargonium × hortorum extract contains the most phenolic compounds (188.58 μg/g DW) whereas Malva flowers contained the least (17.63 μg/g DW) (Table 3).
TPC, TF, ORAC and FRAP values for the five flowers.
Determination of total flavonoids
The determination of total flavonoids contents in the flowers studied was carried out using a spectrophotometric method at 510 nm. The compounds are classified into several groups, the best-known being anthocyanins, flavonols, flavones and flavanones (Ross & Kasum, Reference Ross and Kasum2002). The results (Table 3) show that the levels of total flavonoids varied considerably between the different flower extracts. The greatest concentration of flavonoids was recorded in the metabolism of the blue flower (Anagallis) (53.22 mg CE/g DW); the lowest concentration was recorded in Malva (2.42 mg CE/g DW).
Determination of antioxidant activity
The evaluation of the antioxidant capacity was performed using two methods: ORAC and FRAP.
The oxygen-absorbing capacity (ORAC) was calculated for the five flower powders and the purified clay. The values obtained are presented in Table 3 and show results of between 772.43 and 3495.73 μmol/g. Pelargonium × hortorum has the greatest antioxidant capacity whereas Silene dioica and Malva have the lowest antioxidant capacity. The value of the capacity implied the sustainable colour of the powder over time and subsequently the variation in their chemical compositions. Therefore, a small absorption capacity for oxygenated radicals corresponded to a substance which was resistant in colour and in chemical composition. This analysis helped to choose the most suitable flower for synthesizing a coloured and sustainable hybrid in colour and chemical composition. The Malva flower was the correct choice here.
The antioxidant capacity showed that flower extracts contained phytochemicals with the potential to inhibit peroxyl free radicals. Usually, greater contents of phenolic compounds were related to greater antioxidant capacity in the sample. Other compounds such as carotenoids or vitamins may contribute to this bioactivity, however. Therefore, the variation in chemical compounds influenced antioxidant capacity.
For purified clay, the recorded value of ORAC was 6.02 μmol/g. This result explained the ability of the sample to retain its colour and chemical composition over time and implied the diversity of clay applications, in general. The EP-Na was used in the food industry, in the environmental field and in the health sector (internal and external use: pharmaceutical, therapeutic, cosmetic, etc.).
The antioxidant capacity of the extracts was also determined by the FRAP method. This universal method is reproducible and rapid and can be applied to aqueous and organic plant extracts (Li et al., Reference Li, Wong and Chen2008). In addition, the ferricyanide Fe3+ complex can be reduced to the ferric form in the presence of reducing agents in plant extracts (Amarowicz et al., Reference Amarowicz, Pegg, Moghaddam, Bral and Weil2004). The results obtained were recorded in Table 3. The analysis carried out on the flowers studied proved significant differences between samples; the maximum value was determined for Chrysanthemum coronarium (1403.35 μmol TE/g DW) and the minimum value was determined for Malva (144.43 μmol TE/g DW). This difference was explained by the variety of the chemical composition of flowers studied.
Characterization of purified clay
Mineralogy and chemical characterization
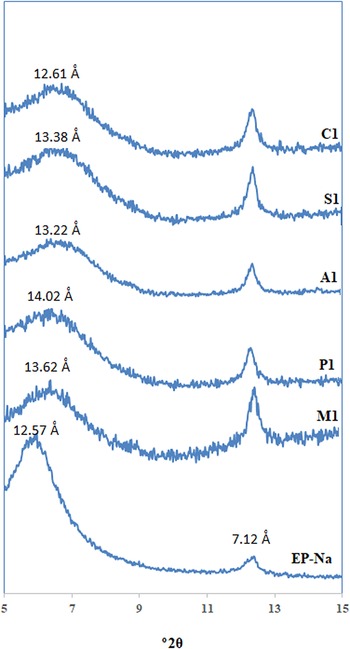
The Na+-exchanged clay (EP-Na) is an interstratified illite-smectite (I-S) with the smectitic fraction estimated (using the reflection migration approach of Reynolds & Hower (Reference Reynolds and Hower1970)) at 78%. The d 001 reflection appears at 12.57 Å indicating the presence of smectite (Fig. 4). A representative structural formula of the EP-Na, based on the chemical composition is (Si7.76Al0.24)(Al0.93Fe0.39Mg0.68)Na0.62K0.2O22. The CEC and BET surface area of the sample are 80.0 meq/gclay and 94.93 m2/gclay, respectively (Gammoudi et al., Reference Gammoudi, Frini-Srasra and Srasra2012).
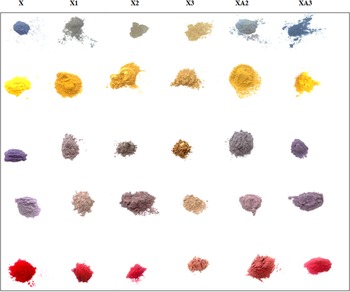
Synthesized hybrids with various flower:clay mass ratios.

Pharmaceutical tests
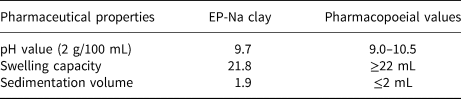
To verify the possibility of using EP-Na as a pharmaceutical and cosmetic ingredient, a set of pharmaceutical and cosmetic tests was carried out in accordance with the US Pharmacopoeia. The results thus obtained are presented in Table 4.
Results of pharmaceutical tests.
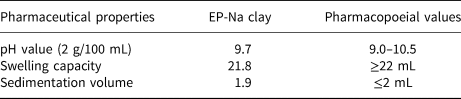
The pH measured for purified clay was 9.70. This pH value was suitable for the topical uses of the studied material (Abdel-Motelib et al., Reference Abdel-Motelib, Abdel Kader, Ragab and Mosalamy2011; Modabberi et al., Reference Modabberi, Namayandeh, López-Galindo, Viseras, Setti and Ranjbaran2015).
The sedimentation volume obtained was 1.90 mL (Table 4), corresponding to a significant value for pharmaceutical clay dispersions (US Pharmacopoeia 2007). In addition, no compact sediment formation was observed for the sample considered. This confirms the suitability of EP-Na for use in the formulation of pharmaceutical products (Shah et al., Reference Shah, Khattak, Valenzuela, Manan and Valenzuela Díaz2013; Modabberi et al., Reference Modabberi, Namayandeh, López-Galindo, Viseras, Setti and Ranjbaran2015).
The swelling capacity of the EP-Na clay is 21.80 mL. This is less than the minimum required by the US Pharmacopoeia of 22–24 mL. The value obtained was attributed to the fact that the sample requires a second purification (Abdel-Motelib et al., Reference Abdel-Motelib, Abdel Kader, Ragab and Mosalamy2011).
Microbiological tests
The species tested were Salmonella and Escherichia coli species for products intended for pharmaceutical use, and Staphylococcus aureus and Pseudomonas aeruginosa for products intended for cosmetic use. All tests were performed in accordance with the US Pharmacopoeia (2007). The results obtained by microbiological tests also revealed the suitability of the EP-Na clay for pharmaceutical and cosmetic uses. The absence of species of Salmonella, Escherichia coli, Staphylococcus aureus and Pseudomonas aeruginosa was verified.
Characterization of coloured hybrids
The mixtures of EP-Na and dried flowers prepared by solid–solid reaction are illustrated in the XRD traces shown in Fig. 5. The results indicate the modification of the colour of the clays, as the hybrid clay/flower powders obtained presented various colours: yellow, red, blue, pink, grey and purple. These samples can be used to prepare natural cosmetics.
XRD traces of the purified clay and coloured hybrids.

X-ray diffraction
The XRD traces in Fig. 4 show the purified clay and the hybrids synthesized at mass ratios of flower:clay = 1.0:1.0. All the traces show two peaks, the first, at 12–14 Å, indicating the presence of Na+-smectite and the second, at 7.12 Å, characteristic of kaolinite. The XRD results confirmed displacements of the first peak (basal spacing for d 001) characteristic of smectite (Brindley & Brown, Reference Brindley and Brown1980). For EP-Na clay, the d 001 appeared at 12.57 Å. For hybrids, the distances varied from 13.54 to 14.02 Å. However, the characteristic line of kaolinite remained unchanged. In the second, a remarkable decrease in the intensity of d 001 was observed in Fig. 4 by comparing the traces of samples M1, P1, A1, S1 and C1 and that of EP-Na. These results revealed that the changes that happened in the interlayer space of the smectite after the addition of flowers by solid–solid reaction were mainly due to the manual grinding used during the synthesis of the hybrids (Khaorapapong & Ogawa, Reference Khaorapapong and Ogawa2008). This allowed the particles of pigment to enter the structure of the smectite in the interlayer space. In the addition, the results also proved that the synthesis reaction took place between ≡S-OH, the surface groups of smectite and the functional groups of pigments.
FTIR spectroscopy
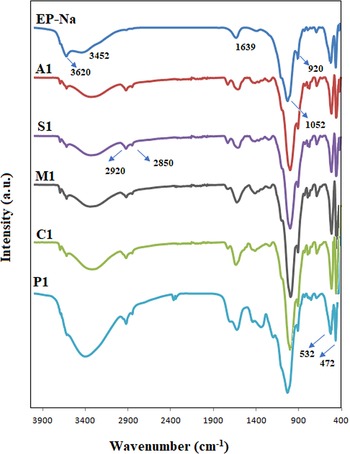
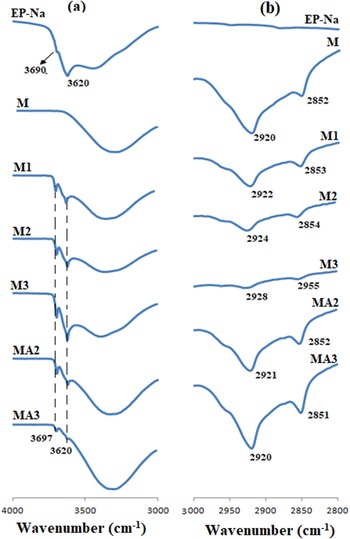
The purpose of the analyses carried out by FTIR spectroscopy was to determine the functional groupings of the various samples studied. The FTIR spectra of the EP-Na clay and of the five synthesized hybrids (A1, M1, S1, P1 and C1) are shown in Fig. 6. By comparing the spectra obtained from purified clay and from the complexes, common bands at 3620 and 920 cm–1 were found, corresponding to elongation of the Al–OH–Al bonds of the octahedral sheet of smectite (Madejová & Komadel, Reference Madejová and Komadel2001). A wide and intense band located at 3452 cm–1 was due to the symmetrical and asymmetrical elongations of the OH group of water (stretching). The bending band linked to the grouping of water was observable at 1639 cm–1. The bands due to the elongation of the Si-O groups were observable at 1052 cm–1. The two bands that appeared at 472 and 532 cm–1 were attributed to the Si-O-Si and Si-O-Al deformation vibrations, respectively (Gammoudi et al., Reference Gammoudi, Frini-Srasra and Srasra2012). The spectra of the hybrids were characteristic of purified clay and the vibration bands of important functional groups in the flowers. The band at 1423 cm-1 showed the presence of phenolic -OH and -C=O stretching of carboxylate. The bands at 1600–1630 cm−1 were characteristic of the C=O vibrations of ketones, aldehydes, lactones or carboxyl groups (Salahandish et al., Reference Salahandish, Ghaffarinejad and Norouzbeigi2016). These FTIR spectra also showed absorption bands at 2920 and 2850 cm−1 corresponding to symmetrical and asymmetrical vibrations of the -CH2 a group in an aromatic methoxyl group, in methyl and methylene groups (Tounsadi et al., Reference Tounsadi, Khalidi, Abdennouri and Barka2015) or the functional group -NH2 (Govindarajan et al., Reference Govindarajan, Hoti, Rajeswary and Benelli2016). A strong band present at 3200 cm−1 may be due to the stretching vibration of hydrogen of the hydroxyl group linked to cellulose, and lignins (Tounsadi et al., Reference Tounsadi, Khalidi, Abdennouri and Barka2015).
FTIR spectra of the purified clay and coloured hybrids.

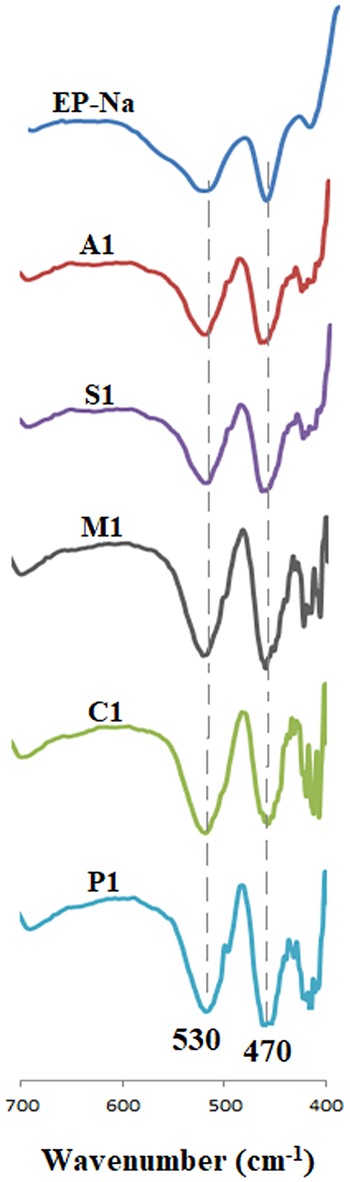
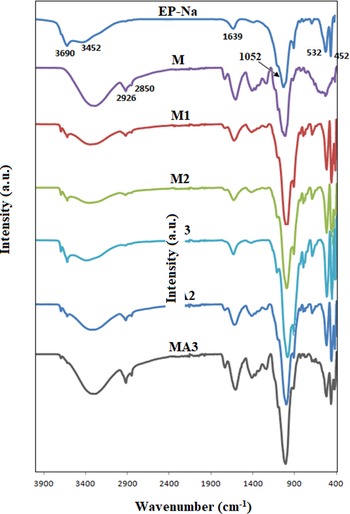
The spectra obtained also proved that the bands (Si-O-Si and Si-O-Al) retain their frequencies and their intensities (Fig. 7). These results clearly indicated that the structure of smectite is not destroyed after the green synthesis by mixing this sample with the dried flower petals. However, the intensity of the Al-OH-Al and –OH bands changed during synthesis confirming that the reaction sites on the surface of ≡SOH clay controlled the synthesis and the colour obtained from the hybrids. To better visualize these results, Fig. 8 shows the FTIR spectra of the hybrids synthesized using the Malva flower for all mass ratios and Fig. 9 shows the Al-OH-Al bands and symmetrical υs and asymmetrical υas vibration bands of the –CH group, as an example. The spectra for all of the other samples were the same as those for Malva.
Vibration bands of the Si–O–Si and Si–O–Al groups for the purified clay and coloured hybrids.

FTIR spectra of coloured hybrids synthesized using Malva sylvestris.

(a) Vibration bands of the Al–OH–Al groups; and (b) symmetrical vibration bands νs and asymmetrical νas of the -CH2 group.

Conclusions
This study has provided a successful green method of synthesizing new, naturally coloured materials using flower powders (Malva sylvestris, Chrysanthemum coronarium, Silene dioica, Anagallis monelli, Pelargonium × hortorum) and Tunisian clay by solid-state reaction. The determination of pigments contents indicated the chlorophyll, carotenoid and flavonoids contents in the flowers. In addition, the ORAC and FRAP values implied the sustainable colour of the flower powder. The mineralogical-chemical characterization, and pharmaceutical and microbiological results suggested that the clay employed here can be used to formulate cosmetic and pharmaceutical products. Indeed, the properties indicated significant values (CEC = 80.0 meq/gclay and S BET = 94.93 m2/gclay). The microbiological tests proved the absence of Salmonella species, Escherichia coli, Staphylococcus aureus and Pseudomonas aeruginosa. The mixture of floral powders and clay presented here allow the creation of safe cosmetics products without side effects for human health or the environment.