This paper considers the loss of rhoticity, changes in voice quality, and how two types of change may be linked in a theoretical and methodological sense. We focus on developments in Glasgow English at the beginning of the twentieth century, as reflected in older speakers recorded between the 1970s and the 2000s. Coda /r/ weakening in words such as better, car, card, in vernacular Glaswegian is a well-documented change by the end of the twentieth century (e.g., Lawson, Scobbie, & Stuart-Smith, Reference Lawson, Scobbie, Stuart-Smith and Lawson2014; Lawson, Stuart-Smith, & Scobbie, Reference Lawson, Stuart-Smith and Scobbie2018). Working-class Glaswegian is also known for its distinctive voice quality, most stereotypically observed in the harsh, whispery, and pharyngealized voice of male speakers, such as the comedian Billy Connolly (Macafee, Reference Macafee1983). Our results have important implications for the emergence of both patterns and also suggest potential links between the two.
The work reported here began as part of a broader investigation of liquids over time in Glaswegian (Stuart-Smith, Lennon, Macdonald, Robertson, Sóskuthy, José, & Evers, Reference Stuart-Smith, Lennon, Macdonald, Robertson, Sóskuthy, José and Evers2015). Our goal was to ascertain the acoustic evidence for the weakening of coda /r/ at the start of the twentieth century, using dynamic acoustic analysis of corpus data. An apparent anomaly in the acoustic results required us to stand back, fundamentally change our perspective, and view this segmental change in the wider context of changes to voice quality over the same period.
Specifically, our initial acoustic analysis showed evidence consistent with /r/-weakening, but a subsequent auditory analysis failed to find support for the same pattern. A large-scale analysis of the vowel productions of our speakers then provided new evidence for a real-time change in voice quality. When the voice quality change is accounted for in our acoustic analysis of /r/, the segmental change fades away: /r/-weakening becomes absent for males and fainter for female speakers.
Our paper makes three key empirical contributions. Two relate directly to theories of language variation and change by enriching their evidential basis and revealing less-known pathways of change, while the third one is mainly methodological.
First, we track the development of /r/ in Glasgow English in the early twentieth century as part of a broader research program aimed at understanding how partial nonrhoticity is emerging in this variety (Stuart-Smith, Reference Stuart-Smith, Corbett, McClure and Stuart-Smith2003; Stuart-Smith et al., Reference Stuart-Smith, Lawson, Scobbie James, Celata and Calamai2014). Our results reveal the expected range of variation and suggest a change already underway in female speakers. However, what we observe for these speakers appears to be merely the initial stage of /r/-loss, and our results contrast sharply with the picture from the end of the twentieth century, where auditory, acoustic, and articulatory studies all point to substantial /r/-weakening (derhoticization) in Glaswegian (Lawson et al., Reference Lawson, Scobbie, Stuart-Smith and Lawson2014, Reference Lawson, Stuart-Smith and Scobbie2018; Stuart-Smith, Reference Stuart-Smith, Corbett, McClure and Stuart-Smith2003).
Second, we evaluate acoustic and auditory evidence showing that voice quality in Glasgow English underwent a change in the early twentieth century. This is marked by a clear rise in F3 and a change in auditory quality, likely carried at least partly by tongue body height based on a Vocal Profile Analysis (VPA; Laver, Wirz, Mackenzie, & Hiller, Reference Laver, Wirz, Mackenzie and Hiller1981). This is an important finding: while there is agreement that varieties of English differ systematically in their “characteristic” voice qualities (Abercrombie, Reference Abercrombie1967; Laver, Reference Laver1994; Podesva & Callier, Reference Podesva and Callier2015; Wells, Reference Wells1982), studies of language change rarely look at this feature. Our study is one of the first to find robust evidence for the types of changes that eventually lead to the well-known and often stereotyped dialectal voice quality differences. It is also novel, because our findings compelled us to move beyond phonation to consider voice quality in the holistic sense of longer-term vocal tract configurations.
Our third main contribution is methodological. Studies of sound change typically focus on a small number of variables, often just a single sound category. Our work shows that ignoring the wider context can lead to misleading inferences about patterns of variation and change. Had we focused narrowly on the acoustics of /r/ without considering other segments or auditory evidence, we would have interpreted the acoustic findings (i.e., an increase in F3) as indicating substantial /r/-weakening in early twentieth century Glaswegian. In fact, exactly this happened to us in an earlier phase of this project. Therefore, this research project serves as a cautionary tale about the importance of looking at multiple sources of evidence even when the focus is on a single variable.
The paper is structured somewhat unusually to highlight this methodological point. Instead of presenting a single analysis of /r/, we analyze it twice: first without taking voice quality into account, and then again while also controlling for voice quality. These two analyses lead to radically different results. The voice quality analysis is sandwiched between the two sections on /r/. We believe this presentation of our results provides a clearer exposition of the potential risks of analyzing linguistic variables in a vacuum, by showing just how much the results can change when the broader context of a change is included in the analysis. This presentation also follows the sequential order of our fundamentally exploratory analysis. In keeping with the goals of reproducibility and transparency in empirical research, we decided it was more important to clearly delineate the path that we followed than to create a neatly packaged, but potentially misleading, summary of our headline results.
Our results allow us to draw new connections between /r/-weakening and voice quality. The phonetic theory of voice quality predicts links between voice qualities and segmental articulations, given that voice qualities are longer-term adjustments of the vocal organs, which are at the same time articulating speech sounds (Laver, Reference Laver1980, Reference Laver1991; Trudgill, Reference Trudgill1974). This suggests a new impetus in the development of /r/-weakening during the twentieth century. Phonotactically weak /r/ variants may have become associated with the ongoing change in voice quality; by the 1980s weak coda /r/ had gained social meaning and took off as a sound change (Stuart-Smith, Lawson, & Scobbie, Reference Stuart-Smith, Lawson, Scobbie James, Celata and Calamai2014). This study now presents the formal substantiation of the links between /r/-weakening and voice quality first noted by Johnston (in Macafee, Reference Macafee1983) and Stuart-Smith (Reference Stuart-Smith, Foulkes and Docherty1999).
BACKGROUND
Coda /r/ in Glasgow English
At the turn of the twenty-first century, there is robust auditory, acoustic, and articulatory evidence for substantial weakening, and even loss, of coda /r/ in Central Belt Scottish English. Edinburgh first provided auditory evidence for /r/ deletion from the sociolinguistic studies by Romaine (Reference Romaine and Trudgill1978), Speitel and Johnston (Reference Speitel and Johnston1983), and Johnston (Reference Johnston and Jones1997). Subsequent sociolinguistic surveys of Glasgow (Stuart-Smith, Reference Stuart-Smith, Corbett, McClure and Stuart-Smith2003; Stuart-Smith et al., Reference Stuart-Smith, Lawson, Scobbie James, Celata and Calamai2014) and comparative auditory/articulatory studies (Lawson et al., Reference Lawson, Scobbie, Stuart-Smith and Lawson2014) have revealed that derhoticization is more advanced in the west. /r/-weakening is found in working-class speakers, especially adolescents, without clear gender patterning, though in some studies girls are more advanced in showing full deletion (Stuart-Smith, Reference Stuart-Smith, Corbett, McClure and Stuart-Smith2003).
The articulatory mechanism appears to be delay of the tongue-tip gesture relative to the offset of voicing, leading to masking, and then erosion of the anterior gesture (Lawson, Stuart-Smith, & Scobbie, Reference Lawson, Stuart-Smith and Scobbie2008, Reference Lawson, Stuart-Smith and Scobbie2018). This is accompanied by an early tongue body retraction gesture (Sproat & Fujimura, Reference Sproat and Fujimura1993). The auditory percept is notoriously difficult to disambiguate: even Glaswegian listeners find it hard to distinguish lexical hut from derhoticised hurt (Lennon, Reference Lennon2017). More generally, there is a range of variants from those with articulated /r/, mainly apical or weak taps, to segments which are hard to classify: either weak velar/uvular/pharyngeal approximants (depending on the location of the remaining tongue dorsum gesture), or vowels with strong secondary velarization/uvularization/pharyngealization (Macafee, Reference Macafee1983; Stuart-Smith, Reference Stuart-Smith, Corbett, McClure and Stuart-Smith2003). We would expect uvular approximants to show high/raised F3 (Ladefoged & Maddieson, Reference Ladefoged and Maddieson1996). Stuart-Smith (Reference Stuart-Smith2007) found raised F3 for auditorily derhoticizing /r/ in younger working-class male Glaswegian speakers. The articulatory-auditory-acoustic link between delayed anterior tongue gesture, weak /r/, and raised F3 has now been established by an experimental study of a socially stratified sample of Glaswegian adolescents (Lawson et al., Reference Lawson, Stuart-Smith and Scobbie2018). Working-class speakers are at one end of this continuum, middle-class speakers at the other, with an early gesture, auditorily strong /r/, and the familiar lowering of F3.
Stuart-Smith and Lawson (Reference Stuart-Smith, Lawson and Hickey2017) found evidence for early coda /r/ weakening in their study of six west-coast Scottish soldiers, including two from Glasgow, recorded during the First World War. These speakers used on average 35% weak or absent /r/. Weak /r/ in these early recordings is also phonologically conditioned: weakening is most likely in word-final, unstressed syllables (e.g., better). The soldiers’ productions pattern with those of middle-aged speakers born in the 1940s and 1950s, while adolescents born in the 1980s and 1990s show substantial weakening, with over 65% of coda /r/ heard as weak or absent.
Reconstructing the sound change over the twentieth century, it looks as if /r/-weakening had begun as a segmental change by the turn of the century but only gained the social associations to help it take off in the 1970s and 1980s. By then, it had indexical meanings of ‘street smarts’ (Speitel & Johnston, Reference Speitel and Johnston1983), and is found later as part of a stylistic cluster used by working-class adolescents to separate themselves from their posh middle-class counterparts (Stuart-Smith, Timmins, & Tweedie, Reference Stuart-Smith, Timmins and Tweedie2007). We initiated this study to investigate the extent to which there might be traces of acoustic /r/-weakening in speakers born in the early twentieth century. Our starting point was the assumption that we would be tracking segmental change; our results suggest an alternative interpretation, involving a change in voice quality.
Voice quality and segmental variation and change
What is voice quality?
Voice quality is the auditory impression of “those characteristics which are present more or less all the time that a person is talking: it is a quasi-permanent quality running through all the sound that issues from [a speaker's] mouth” (Abercrombie, Reference Abercrombie1967:91). Differences in speaker voice quality arise from physiological speaker characteristics and, to a large extent, habitual learned combinations of articulatory settings (cf., Honikman, Reference Honikman, Abercrombie, Fry, MacCarthy, Scott and Trim1964) acquired as integral to a speaker's dialect. Laver's work (Laver, Reference Laver1980, Reference Laver1991, Reference Laver1994) is significant for translating impressionistic descriptions into a phonetic theory of voice quality (see also Nolan, Reference Nolan1983; Pittam, Reference Pittam1987). Holistic speaker voice quality is described in terms of the co-ordination of phonetic settings relating to every aspect of speech production: phonation, articulation, overall muscular tension and prosodic activities (Laver, Reference Laver1994:396). Just as vowel description breaks down the auditory vowel space into quasi-articulatory parameters of frontness, height, and rounding, so Laver's theory proposes the componential analysis of voice quality in terms of defined articulatory settings.
Laver's theory is implemented in the Vocal Profile Analysis (VPA) scheme (Laver et al., Reference Laver, Wirz, Mackenzie and Hiller1981). The VPA is a detailed protocol for the auditory analysis of a speaker's voice quality in terms of their use of different vocal tract settings, judged against neutral reference settings. It is used in clinical and forensic work (San Segundo & Mompean, Reference San Segundo and Mompean2017), as well as for dialect study (Beck & Schaeffler, Reference Beck and Schaeffler2015; Stuart-Smith, Reference Stuart-Smith, Foulkes and Docherty1999). Acoustic analysis of voice quality tends to focus on phonation, with ‘voice quality’ referring to laryngeal settings in much phonetic research (e.g., Garellek, Samlan, Garratt, & Kreiman, Reference Garellek, Samlan, Gerratt and Kreiman2016).
Voice quality and indexicality
Abercrombie (Reference Abercrombie1967:90) was the first to formally outline how voice quality combines with segmental variation and voice dynamics to “carry indexical signs of social affiliations,” from social and regional groups to individual characteristics and those relating to more transitory emotional and physical state. Podesva and Callier (Reference Podesva and Callier2015) summarized research that shows how voice quality, usually phonation, indexes social identities, ranging from community-level norms to those which are more locally salient, and/or to transient shifts indicating interactional stance.
English dialectology has long recognized the connection between regional dialects and particular voice qualities (Abercrombie, Reference Abercrombie1967; Wells, Reference Wells1982). Recent sociophonetic work confirms phonatory differences between and within dialects, in interaction with gender and social class (Gittelson, Li, & Leeman, Reference Gittelson, Li and Leeman2018; Szakay, Reference Szakay2012; Szakay & Torgersen, Reference Szakay and Torgersen2015; cf., Coadou & Rougab, Reference Coadou and Rougab2007). Laver's phonetically specified grounding of voice quality inspired contemporary sociolinguists to look beyond segmental variation, leading to detailed accounts of voice quality for Norwich (Trudgill, Reference Trudgill1974), Edinburgh (Esling, Reference Esling1978), and Liverpool (Knowles, Reference Knowles and Trudgill1978). Voice quality variation in Scottish English dialects has gained more attention than in most English dialect regions. Beck and Schaeffler (Reference Beck and Schaeffler2015) considered 76 adolescents from cities outside the Central Belt and found dialectal and gender differences, with polarization between fronter tongue body for girls and retracted tongue body for boys. Esling's (Reference Esling1978) analysis of male speakers from Edinburgh revealed clear differences in social class: working-class speakers used tongue blade articulation, protruded jaw, pharyngealization, and raised larynx, with predominantly whispery and harsh voice. More than 20 years later, Stuart-Smith's (Reference Stuart-Smith, Foulkes and Docherty1999) study of Glaswegian found some similarities with Edinburgh working-class voice quality, in the use of more whispery voice and some protruded jaw and pharyngealization. But her analysis found little evidence for the stereotypical harsh “Glasgow voice.” All speakers showed tongue-body raising, with the main difference between middle-class and working-class speech in front/backness, that is, between palatalization (tongue body raised and fronted) and velarization (tongue body raised and backed), respectively. She suggested that the audible pharyngealization in working-class speakers “most clearly noticeable during liquids and semi-vowels” could be due to retracted tongue root.
Voice quality and segmental variation
Laver (Reference Laver1994:402) argued that “key segments” are the effective carriers of voice quality settings, given that settings and segments rely on the same muscle systems and, therefore, share the same physiological basis. For example, key segments for tongue body and root settings are vowels, but also /l/ and /r/, given that liquid production is usually assumed to involve at least two tongue gestures (Lawson, Stuart-Smith, Scobbie, Yaeger-Dror, & Maclagan, Reference Lawson, Stuart-Smith, Scobbie, Yaeger-Dror, Maclagan, De Paolo and Yaeger-Dror2010; Sproat & Fujimura, Reference Sproat and Fujimura1993). The close relationship between voice quality and segmental variation has only occasionally been discussed in sociolinguistic studies. Labov (Reference Labov1972:40) took the common features across the realization of up-islanders’ variables on Martha's Vineyard as a “close-mouthed articulatory style” linked with social evaluation. Trudgill (Reference Trudgill1974:190–1), too, recognized voice quality as “perhaps the single socially most significant feature of linguistic differentiation in Norwich,” a point that “did not emerge at all from our atomistic analysis of the linguistic and sociological phenomena.” Trudgill (Reference Trudgill1974:189) further wondered whether interconnected sound changes that occur “ostensibly as a result of pressures in phonetic space may in fact be due to changes in setting.” More recently, Podesva, Calier, Voigt, and Jurafsky (Reference Podesva, Callier, Voigt and Jurafsky2015) found significant correlations between smiling, self-reported comfort, and higher values of F2, consistent with GOAT-fronting in Californian speakers, while Levon and Holmes-Elliott (Reference Levon and Holmes-Elliott2017) suggested that backing of London front vowels may result from a more open jaw setting.
Earlier descriptions of /r/-weakening in Glasgow also linked segments and voice quality to account for synchronic variation. For instance, Stuart-Smith (Reference Stuart-Smith, Foulkes and Docherty1999:201) observed for /l/ and /r/ “a clear link between the speakers (especially [working class] children) showing strongly retracted tongue body setting, and darker segmental secondary articulation,” and went on to draw attention to “the grey area between “long-term” and “short-term” settings (traditionally secondary segmental articulation).” The chain of studies we present here reveal the theoretical and methodological importance of this relationship for the diachronic development of Glaswegian /r/.
MATERIALS AND GENERAL METHODS
Speaker sample
We selected the oldest speakers from the Sounds of the City real- and apparent-time spontaneous speech corpus of working-class Glasgow English (Stuart-Smith, Brian, Rathcke, Macdonald, & Lawson, Reference Stuart-Smith, José, Rathcke, Macdonald, Lawson, Montgomery and Moore2017). The recordings analyzed here are mainly oral history interviews, but also some sociolinguistic interviews. We analyze data from 24 speakers altogether: three older female and three older male speakers (aged between 67 and 90 years old) from each decade of recording represented in the corpus, so from the 1970s, 1980s, 1990s, and 2000s. Following the apparent-time construct (Labov, Reference Labov1994; Sankoff & Blondeau, Reference Sankoff and Blondeau2007), we assume that examination of phonological variation in these speakers gives us an effective window on speech patterns when these speakers acquired their vernacular, from the 1890s to the 1920s. We infer change with reference to speakers’ decade of recording, which is more or less interchangeable with decade of birth, and which increases in lock-step with speakers’ decade of birth.
Data
Our results are based on three different datasets extracted from the recordings described above. The first contains tokens of /r/, which we analyze using acoustic and auditory methods. The second consists of vowel formant measurements representing seven different vowel phonemes, used for tracking changes in voice quality. The third contains speech extracts subjected to auditory VPA analysis.
Tokens of /r/
The first 35 usable tokens of word-final singleton /r/ (e.g., dear, father) were identified for each speaker (tokens followed by /r, l/ were excluded, e.g., never liked). We adopted a parametric analysis after Plug and Ogden (Reference Plug and Ogden2003), which involved extracting formant tracks for the V+/r/ sequence (e.g., dear, father), giving us a dynamic acoustic perspective for the rhotic, insofar as it was articulated. Segmentation was carried out using waveforms and spectrograms in Praat (Boersma & Weenink, Reference Boersma and Weenink2013). The beginning of the V+/r/ sequence was determined as the onset of periodicity, while the end was determined as the disappearance of visible formant structure, even if this was weak and/or accompanied by some friction (Stuart-Smith, Reference Stuart-Smith2007).
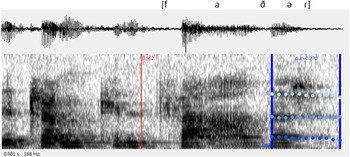
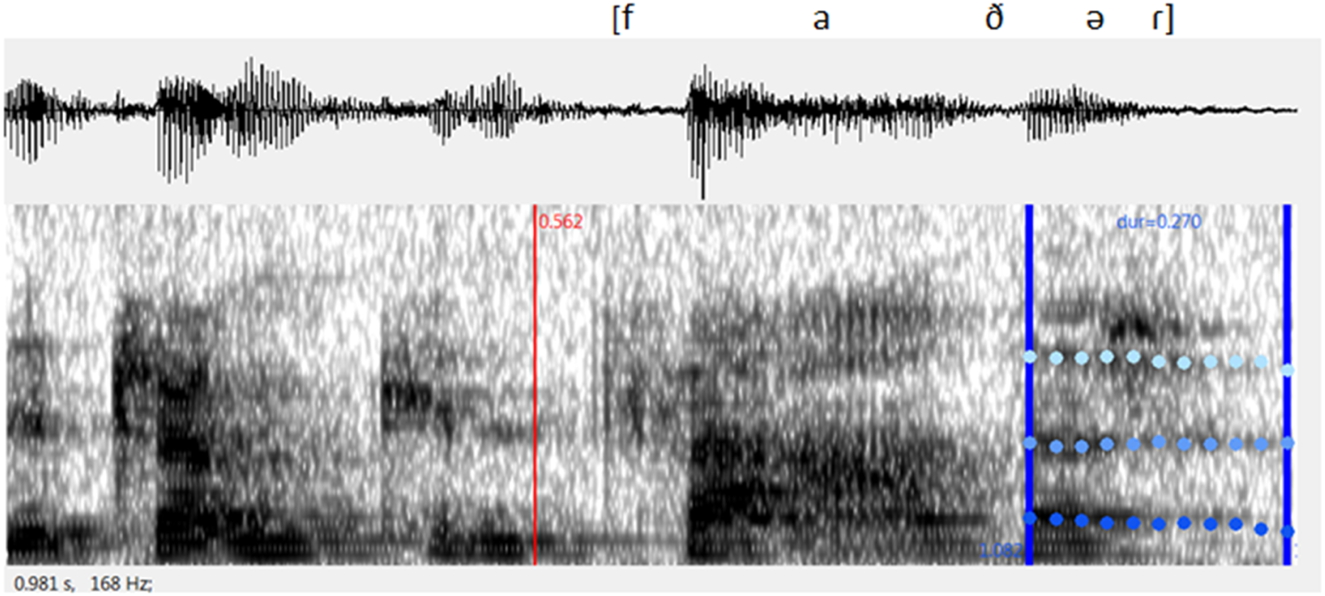
We used Formant Editor (Sóskuthy, Reference Sóskuthy2014) and Praat to take a sequence of 11 evenly spaced formant measurements across each V+/r/ sequence, yielding time-normalized formant tracks. Using Formant Editor, we hand-corrected F1-F3 tracks for every token; see Figure 1. The analysis was carried out in two phases. Eight male speakers were segmented and corrected by several annotators, and a preliminary analysis was reported in Stuart-Smith et al. (Reference Stuart-Smith, Lennon, Macdonald, Robertson, Sóskuthy, José and Evers2015). The remaining 16 speakers were segmented and corrected by three annotators. Then every token for all 24 speakers was hand-checked by the second author, with cross-checking by the first author.
Spectrogram and waveform of “the drunken father” spoken by a woman recorded in the 1970s. Labeling shows ‘father,’ segmentation of the V+/r/ sequence, and corrected formant tracks.
After an exploration of the data, and from our expectations from previous work on /r/ (e.g., Stuart-Smith & Lawson, Reference Stuart-Smith, Lawson and Hickey2017), we identified the following four phonetic factors as potentially relevant to the realization of coda /r/: the frontness of the preceding vowel, whether the syllable in which /r/ occurred was stressed, the following context, and the duration of the V+/r/ sequence. The frontness of the preceding vowel was coded as a numeric variable with values between 0 and 2 (based on F2; /ɔ, aʊ/ = 0; /a, ʌ, ɜ, ɛ, o, aɪ/ = 1; /e, ɪ, i/ = 2). Stress was coded as a categorical variable with two values: “unstressed” and “full” (/ər/ = “unstressed,” while all other V+/r/ sequences are “full”). The following context was coded as categorical with the values “labial,” “coronal,” “palatal,” “velar,” “glottal,” “rounded vowel,” “unrounded vowel,” “zero.” Duration was coded in seconds as a continuous variable.
The choice and coding of these control variables was guided by (i) preliminary visual exploration of our data, and (ii) limits on the size of our dataset. Previous work (e.g., Blaxter, Beeching, Coates, Murphy, & Robinson, Reference Blaxter, Beeching, Coates, James and Robinson2019; Nagy & Irwin, Reference Nagy and Irwin2010) has identified other variables, such as morphological position and lexical frequency that also influence the realization of /r/, and has also demonstrated effects of the preceding vowel context that go beyond what can be captured by our preceding vowel frontness and stress variables. Such effects are important both from a descriptive and theoretical point of view, but they are typically relatively small and also orthogonal to the main research questions in this paper. Since it is highly unlikely that they are confounded with our key predictor variable (decade of recording), our models do not control for these variables.
The same tokens were also subjected to auditory analysis. Following the coding protocol in Lawson et al. (Reference Lawson, Stuart-Smith and Scobbie2018), the second author provided narrow transcriptions for each token using auditory criteria only (without consulting spectrograms). The coding reflects a continuum of auditory strength using articulatory labels appropriate for this dialect (which, therefore, exclude rhotacized vowels or bunched/retroflex approximants): “trill” (rare but attested); “full tap”; “weak tap” (with delayed tongue tip gesture, devoicing or slacker articulation); “intermediate” (vowels with a strong dorsal gesture or ambiguous tokens where the presence of a dorsal gesture was unclear); “approximant” (postalveolar approximant); “zero” (no audible trace of /r/). These auditory codes showed a strong and significant correlation with F3 (see below in the section on auditory results for /r/), which provides external confirmation of their reliability.
Vowel tokens
Using LaBB-CAT (Fromont & Hay, Reference Fromont and Jennifer2012), we measured F1, F2, and F3 automatically at the temporal midpoint of all stressed tokens of the monophthongs boot, cat, cot, face, fleece, goat, and strut. Tokens before /r/ and /l/ were excluded, as some of the same tokens were included in the analysis of /r/. We also excluded tokens in function words to avoid reduced vowels. This yielded 10,160 vowel tokens. To remove implausible automated measurements, we excluded vowels with F1/F2/F3 values that fell outside the first and ninety-ninth percentiles of all hand-corrected formant measurements from speakers of the same gender in Hillenbrand, Getty, Clark, and Wheeler's (Reference Hillenbrand, Getty, Clark and Wheeler1995) formant data set. We also excluded vowels with F1/F2/F3 values more than 1.5 IQR away from the lower or upper quartiles for a given vowel within a given speaker. Our final total is 7,556 vowels. The F3 analysis reported here yields the same (significant) results even without these exclusions.
Voice Profile Analysis
The second author, who has been trained in the VPA scheme, carried out an auditory VPA analysis of voice quality (Laver et al., Reference Laver, Wirz, Mackenzie and Hiller1981). For each speaker, a 100 second chunk of speech was extracted 200 seconds into the recording. This location was chosen so that it did not overlap with any of the analyzed tokens of /r/. The extracts were then randomized, and a componential VPA analysis was carried out. This was a “blind” analysis, with no possible visual cues from the waveform or the spectrogram. The decade of recording (our main variable of interest) was also hidden from the analyst to avoid potential biases. A simplified VPA protocol was used, focusing on cross-sectional (lingual), velopharyngeal, and phonatory settings. Repeated sequential listening was used to observe and record the scalar degree for each setting in succession (Laver et al., Reference Laver, Wirz, Mackenzie and Hiller1981; San Segundo & Mompean, Reference San Segundo and Mompean2017). We report the results for the three tongue body settings: tongue tip, tongue body front/backness, and tongue body height. For all settings, 0 indicates a neutral position. Positive values indicate advanced tongue tip, tongue body fronting, and tongue body raising. Negative values indicate retracted tongue tip, tongue body backing, and tongue body lowering. The scales range from –3 to + 3.
Statistical analyses
We use a combination of different mixed effects models: generalized additive mixed models (GAMMs) to analyze the acoustic measurements for /r/ (Sóskuthy, Reference Sóskuthy2017; Wieling, Reference Wieling2018; Wood, Reference Wood2017); mixed effects logistic regression to analyze the categorical auditory codes for /r/; and linear mixed effects models to analyze the vowel formant data. The details of each model are reported along with the findings.
Two notes should be made about our general modeling strategy. First, our analyses are exploratory as opposed to confirmatory (see, e.g., Baayen, Vasishth, Bates, & Kliegl, [Reference Baayen, Vasishth, Bates and Kliegl2017]). We had prior expectations about the data, but we did not start with a set of clear hypotheses, and we explored a range of different modeling techniques and model structures. This exploration is reflected in the structure of our paper. However, we acknowledge that p-values and confidence intervals are not well calibrated in such modeling settings. Therefore, they are best seen as ‘indicators of surprise and should not be taken at face value as exact probabilities’ (Baayen et al., Reference Baayen, Vasishth, Bates and Kliegl2017:277). To mitigate these issues, we present different complementary analyses (e.g., acoustic and auditory). The main effects reported as significant in the paper are of substantial magnitude and remain significant under different modeling approaches.
Second, many of our models (especially our GAMMs) contain fairly complex interactions. Working with interactions is difficult for a number of reasons. First, depending partly on how predictors are coded, the interpretation of lower-level effects (or main effects) becomes nontrivial in the presence of higher-level interactions. Second, interactions create multiple opportunities for significance testing, and, in many cases, all possible outcomes may be theoretically interesting, which increases the rate of false positives. Therefore, we take a conservative approach to evaluating predictors that are involved in interactions (see Sóskuthy, Foulkes, Hughes, & Haddican [Reference Sóskuthy, Foulkes, Hughes and Haddican2018] for a similar approach). Instead of relying on model summaries, we employ model comparisons based on log-likelihood tests: we first fit a nested model that excludes all terms that involve the relevant predictor and then compare this nested model to the full model. We call this an overall comparison. For instance, for testing predictor A in a model that contains A, B, and their interaction, the nested model would contain only B. If the overall comparison is found to be significant, we interpret it as an indication that A affects the outcome variable in some significant way and then investigate its precise effects by using further model comparisons (e.g., is the interaction itself significant?). If the overall comparison is not significant, we do not investigate terms containing A any further. In discussing interactions, we rely heavily on visual model summaries.
Online supplement
All data and analyses are available online through the following OSF repository: https://osf.io/df74r/. The master analysis file contains all the details of our statistical models, including model formulae and conventional model summaries. In order to make this file easier to browse, it uses the same section titles as the paper itself. In addition, the repository includes a page (linked to from the project description page) that provides the full details of our models including full descriptions of the variables and an outline of their structure.
CHANGES TO CODA /R/: TAKE 1
Acoustic results
Since GAMMs may be unfamiliar to some readers, we outline the method here. GAMMs are a type of mixed effects regression model, which extend linear mixed effects models by allowing the inclusion of so-called smooth terms alongside conventional parametric terms. Similar to polynomial regression or restricted cubic splines, smooth terms can capture nonlinear relationships between predictor variables and an outcome variable. However, unlike other techniques, smooth terms do not require prespecification of the degree of nonlinearity (e.g., by fixing the degree of the polynomial), but estimate the wiggliness of the curve directly from the data. GAMMs can also include random smooths, which extend the same principle to random effects, and are essentially nonlinear random slopes. Our GAMMs also include autoregressive error models (AR1 models), which account for dependencies between neighboring data points within the same formant trajectories. All GAMMs in this paper are fitted using the mgcv package (Wood, Reference Wood2011) in R (R Core Team, 2013) and analyzed using the itsadug package (van Rij, Wieling, Baayen, & van Rijn, Reference van Rij, Wieling, Baayen and van Rijn2017).
The outcome variable for our models is F3. In order to keep the models tractable, and in the absence of normalization, females and males are analyzed separately. Since we model formant trajectories, smooths are fitted over the predictor variable measurement number, a number between 0 and 10 that corresponds to when the measurement is made within the V+/r/ sequence. The main predictor of interest is decade of recording. Our models include terms that allow us to capture nonlinear effects of decade of recording on average trajectory height (a smooth over decade of recording) as well as nonlinear interactions between trajectory shape and decade of recording (a tensor product smooth over decade of recording and measurement number). They also include control terms that capture (i) potentially nonlinear effects of the duration of V+/r/; (ii) potentially nonlinear effects of the frontness of the vowel in V+/r/; and (iii) differences in formant trajectory height, shape, and the unfolding of diachronic changes as a function of stress. The models also contain random smooths over measurement number by (i) following context, (ii) speaker, and (iii) word. (For further details, see the online supplement.)
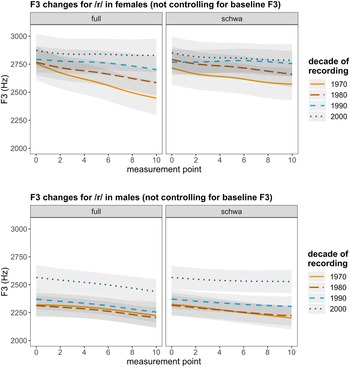
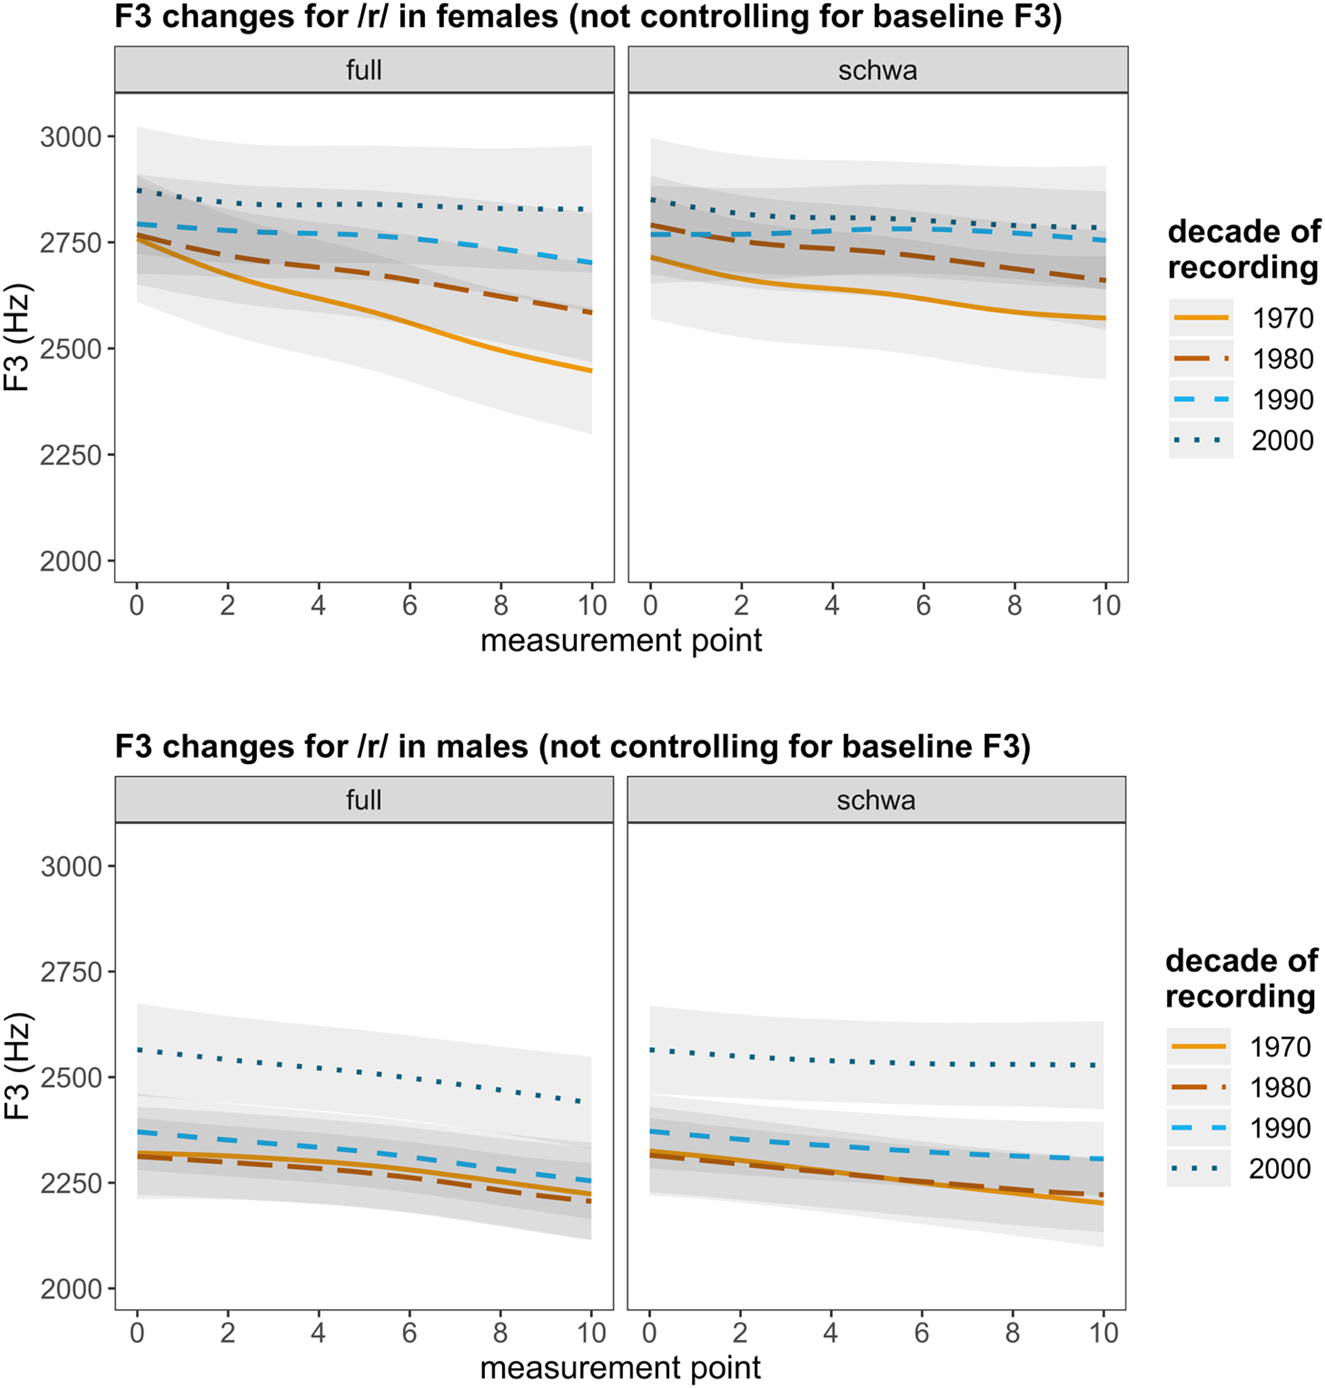
The models are summarized in Figure 2. Overall model comparisons show that decade of recording has a significant effect for both females (χ2(10) = 12.62, p = 0.005) and males (χ2(10) = 9.51, p = 0.04), though we note that the p-value for males is rather close to the 0.05 cut-off. Figure 2 shows different patterns of change for females versus males, and slightly different patterns in full versus unstressed syllables for females. Females show a marked rise in F3 as a function of decade of recording near the end of the trajectory (corresponding to the /r/) in syllables with stressed vowels, and a relatively modest degree of rise in F3 throughout the rest of the trajectory and in unstressed syllables. This is confirmed by further model comparisons, which reveal a significant overall effect of stress (χ2(8) = 9.2, p = 0.018) and a significant effect of decade of recording on trajectory shape (χ2(6) = 8.21, p = 0.012). The males show a rise in F3 throughout the entire V+/r/ sequence with a marked increase between 1990 and 2000, but with no significant overall effects of stress (χ2(8) = 6.39, p = 0.12) or trajectory shape effects of decade of recording (χ2(6) = 3.13, p = 0.395).
Model predictions from GAMMs with 95% confidence intervals showing changes in F3 trajectories corresponding to the V+/r/ sequences over four decades. Top panel shows predictions for females, bottom panel shows predictions for males. Left panels show predictions for syllables with full vowels, while right panels show predictions for unstressed syllables. Neither model controls for baseline F3 (i.e., per-speaker average F3 in nonrhotic vocalic contexts); the implications of this fact will be made clearer in later sections.
Auditory results
To confirm the validity of our auditory codes, we first fitted a GAMM to the acoustic dataset above with F3 as the outcome variable and /r/ realization as the main predictor. Trills were excluded due to their unique temporal characteristics: the acoustics of trill cycles are not well captured by GAMMs or indeed by F3 alone. This model is of the same structure as the ones above, with the same control variables and random effects but does not include decade of recording.
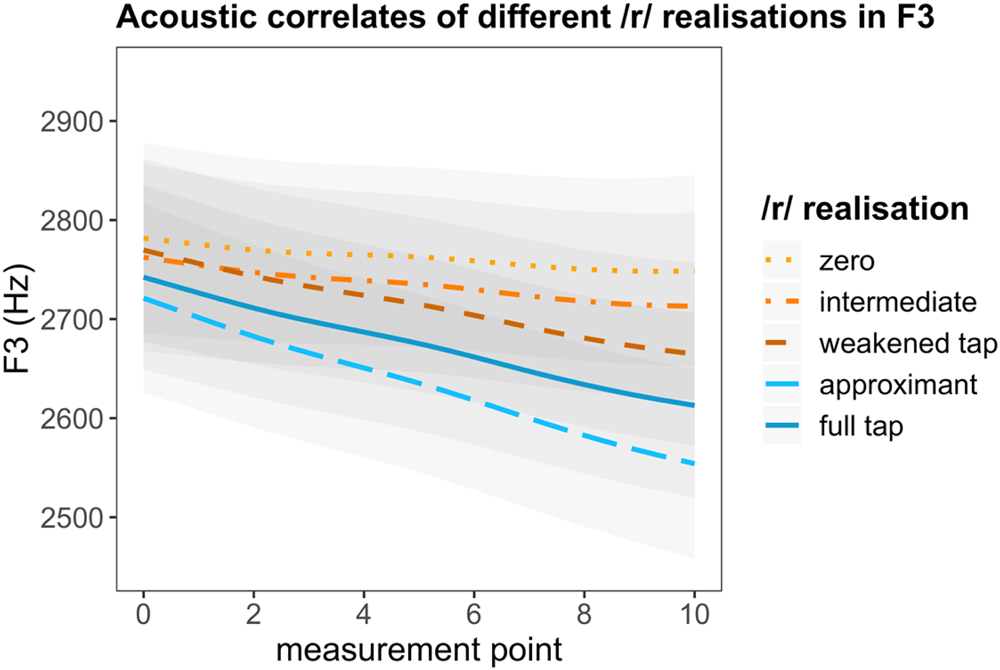
Figure 3 shows the predictions from this model. The predictor /r/ realization is significant according to an overall model comparison (χ2(15) = 115.57, p < 0.0001). The model predictions are in line with what one might expect from the auditory codes: “zero” shows an essentially flat trajectory; “intermediate” realizations show some F3 lowering as we move into the /r/ portion of the V+/r/ sequence; “weakened taps” show more F3 lowering but less than “full taps”; and “approximants” and “full taps” both show substantial lowering of F3 near the end of the trajectory. This patterning echoes the findings of Lawson et al.'s (Reference Lawson, Stuart-Smith and Scobbie2018) auditory-acoustic-articulatory study of postvocalic /r/, which shows significant correlations between early tongue tip gestures with lowered F3 and auditorily “stronger” (often approximant) /r/, on the one hand, and delayed tongue-tip gestures with raised F3 and auditorily weak or absent /r/, on the other. In sum, acoustic analysis provides strong support for the validity of our auditory labels.
GAMM model predictions for F3 trajectories corresponding to different auditory /r/ realizations.
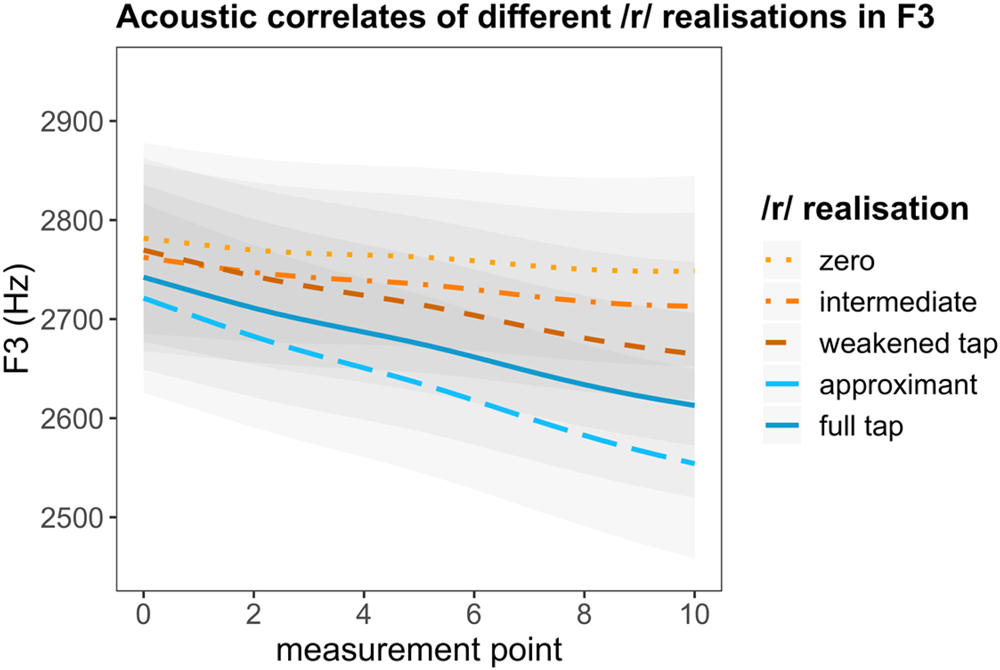
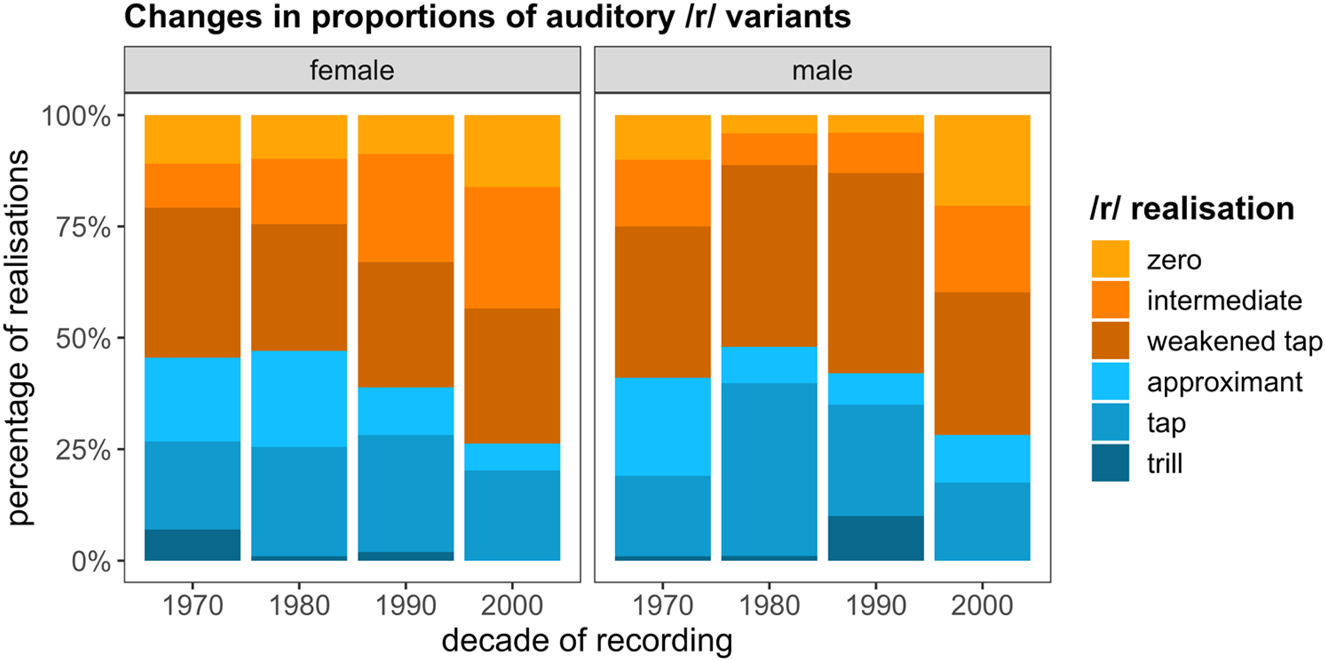
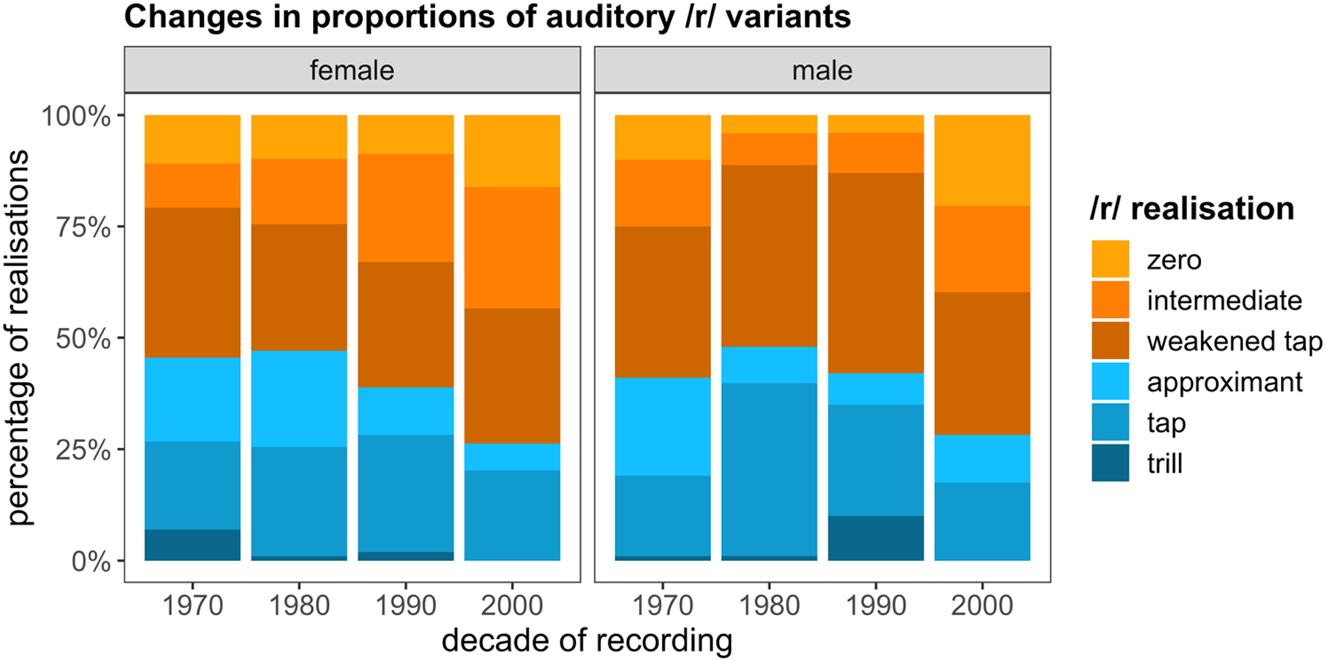
Figure 4 shows how the proportions of different /r/ realizations vary as a function of decade of recording. We fitted two separate mixed effects logistic regression models to the auditory data: one with an outcome variable that distinguishes between strong /r/ (“trill,” “tap,” “approximant”) and weak /r/ (“weak tap,” “intermediate,” “zero”); and another one that distinguishes between full /r/ (“trill,” “tap,” “approximant,” “weak tap”) and ambiguous or deleted /r/ (“intermediate,” “zero”). Due to convergence errors, these models only contained random intercepts (by speaker and word) but no random slopes, which makes them anticonservative, and, therefore, more likely to produce a significant result even if there is no underlying effect (Barr, Levy, Scheepers, & Tilly, Reference Barr, Levy, Scheepers and Tily Harry2013). Neither model found a significant effect of decade of recording (overall comparison for the strong/weak model: χ2(2) = 2.87, p = 0.238; overall comparison for the full/deleted model: χ2(2) = 3.47, p = 0.177), not even in interaction with gender. Given that these models are already anticonservative, we conclude that the statistical analysis provides no support for changes in auditory /r/ realizations. This is in line with the raw proportions in Figure 4, which only show weak trends: a gradual increase in the proportion of intermediate variants in females and a general prevalence of weak /r/ in speakers recorded in the 2000s versus other decades.
Changes in the proportions of different /r/ realizations by decade of recording. Warm colors indicate weak variants; cool colors indicate strong variants. Darker colors within these bands correspond to higher degrees of constriction/auditory strength.
Changes to coda /r/: Interim summary
Our acoustic and auditory analyses provide conflicting results: we find a robust rise in F3 that manifests slightly differently in males and females, but only weak trends in the auditory data that are not confirmed by the statistical analysis. One further odd aspect of the acoustic analysis is that F3 rises throughout the entire V+/r/ sequence, not only where the /r/ is located. This could simply be because /r/ is typically associated with acoustic cues whose range extends beyond its segmental boundaries. However, our earlier acoustic analysis of the eight male speakers from the same speaker pool in Stuart-Smith et al. (Reference Stuart-Smith, Lennon, Macdonald, Robertson, Sóskuthy, José and Evers2015) revealed a similar pattern for /l/, which, like /r/, showed raising of F3 throughout the entire trajectory. The shared pattern over both segments made us question whether this parallel rise in F3 might, in fact, reflect a broader change in long-term articulatory settings, cued by a rise in F3 across the board.
CHANGES IN VOICE QUALITY
Acoustic results for voice quality
We fitted three different linear mixed effects models to the vowel data (boot, cat, cot, face, fleece, goat, strut) with F1, F2, and F3 as their outcome variables, and decade of recording as the key predictor. To account for potentially nonlinear changes, decade of recording was coded as a categorical predictor with four levels. The models also included gender, interactions between gender and decade of recording, and vowel duration as a control variable. We also included random intercepts by vowel, word, and speaker for all three models. The F3 model also contained a random slope over decade of recording by vowel, to ensure that any observed significant changes generalize across all vowels. For F1 and F2, it was not possible to include this random slope due to convergence issues (making these models anticonservative).
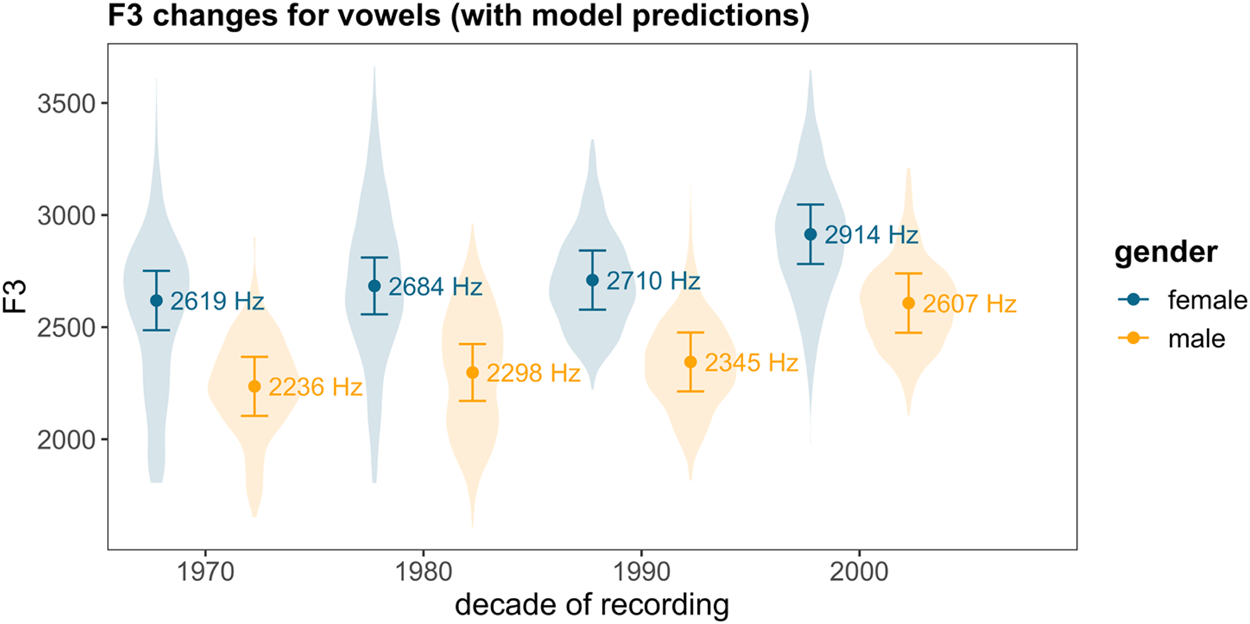
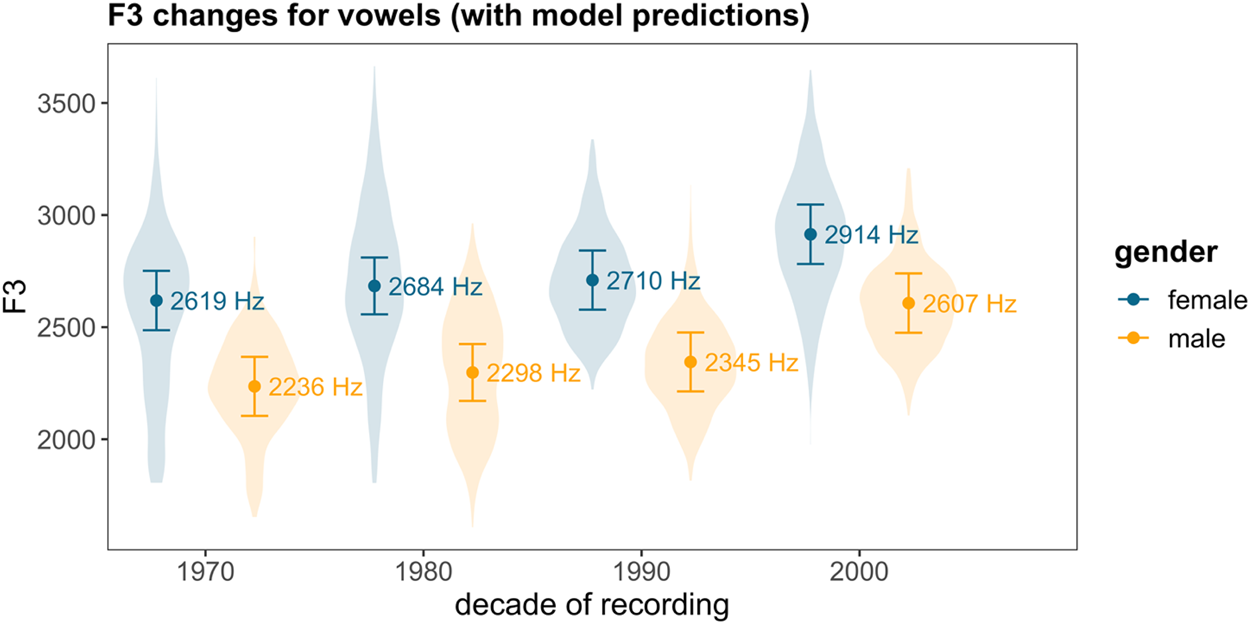
Here we only report the results for F3. Significant results were not found by decade of recording for the other two formants. Figure 5 shows the raw data alongside model predictions with 95% confidence intervals. An overall model comparison shows that decade of recording has a significant effect on F3 (χ2(6) = 22.17, p = 0.001). Based on Figure 5, this effect manifests mainly as a rise in F3, which progresses in relatively small increments between 1970 and 1990 (with an increase of about 100 Hz over two decades for both males and females), followed by a sizable jump between 1990 and 2000. The overall increase is close to 300 Hz for females and more than 350 Hz for males. These are phonetically meaningful, substantial effects. While the raw data show great variability, the increase in F3 is clearly apparent there as well.
F3 as a function of decade of recording for males (orange/light grey) and females (blue/dark grey). The violins show the full distribution of F3 measurements for each combination of decade of recording and gender. The dots and whiskers show model predictions and 95% confidence intervals from a linear mixed effects regression model.
Auditory results for voice quality
The second author carried out a partial Vocal Profile Analysis for all 24 speakers focusing on three lingual components: tongue tip/blade, tongue body height, and tongue body front/backness. Each speaker is represented by a single observation in the dataset, with impressionistic judgments for each of the three components (see the description of the Vocal Profile Analysis in the methods section for more detail). We also included a variable representing each speaker's average F3 based on the vowel dataset above.
We first fitted a linear regression model to per-speaker average F3 values with tongue tip/blade, tongue body height, tongue body front/backness, and gender as predictors. According to this model, only tongue body height is significantly correlated with F3 (β = 66.50, t = 2.472, p = 0.024).
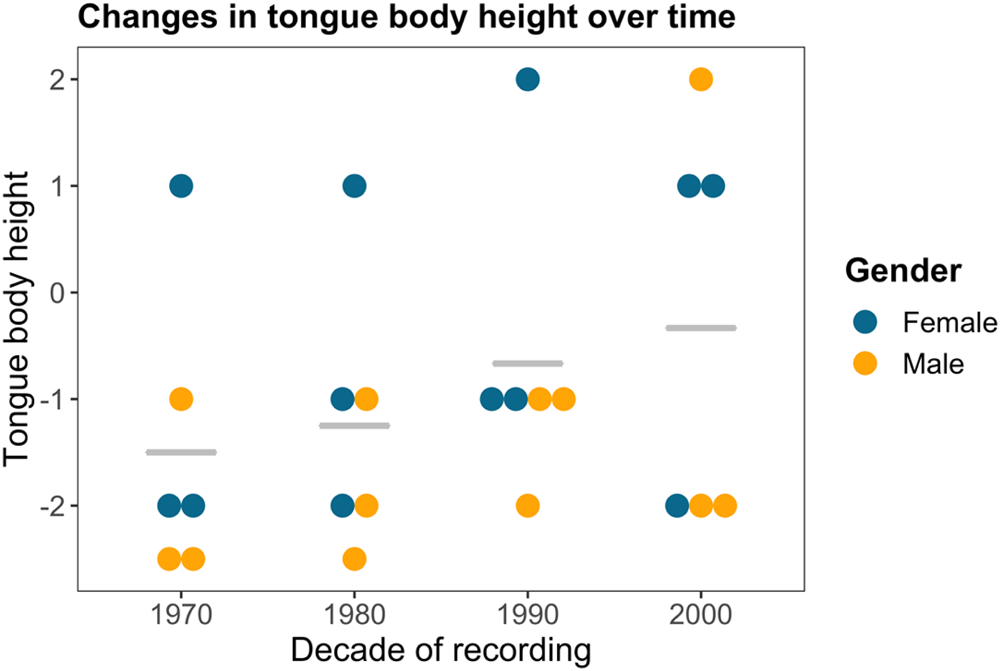
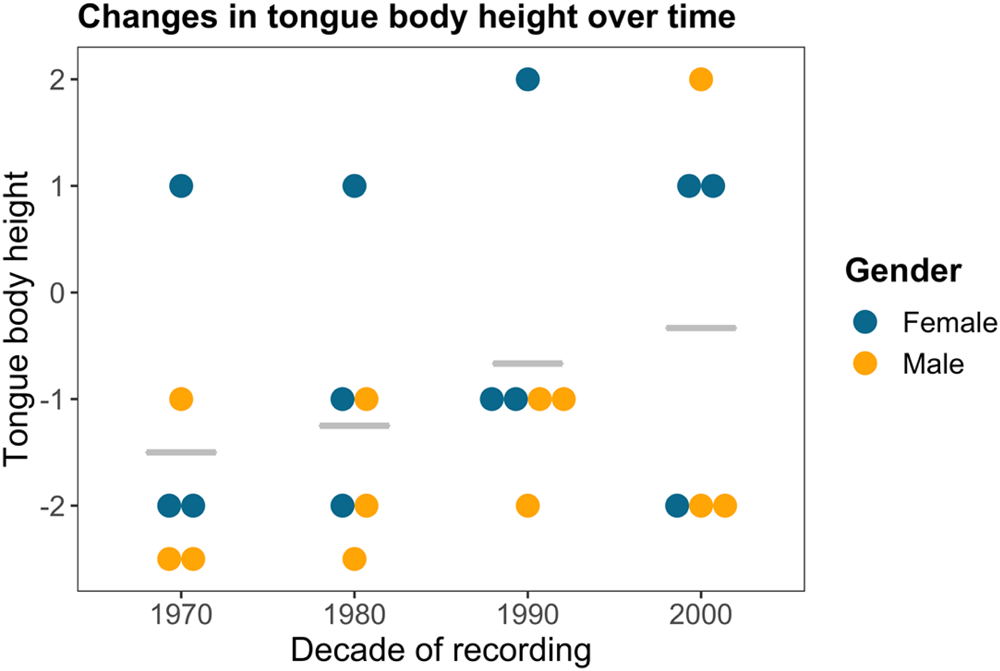
We then fitted separate linear regression models with tongue tip, tongue body height, tongue body front/backness as the outcome variables, and decade of recording and gender as predictors. Decade of recording was centered, and gender was sum coded, meaning that the intercepts of these models represent the grand means for the three lingual components. The intercepts were significant in each of the three models: our speakers show advancement of the tongue tip/blade (mean = 1.59, t = 12.78, p < 0.0001), tongue body lowering (mean = –0.94, t = –3.45, p = 0.002), and tongue body retraction (mean = –1.69, t = –11.22, p < 0.0001). We did not find significant effects of decade of recording or gender for any component. We note, however, that tongue body height exhibits a continuous increasing trend over time (β = 0.41 per decade, t = 1.682, p = 0.107), as shown in Figure 6.
Tongue body height by decade of recording, shaded by gender (females indicated by blue/darker grey). Each speaker is shown by a separate circle. The number 0 indicates neutral, positive values indicate higher, negative values indicate lower, tongue body position. Gray bars show the average tongue body height for each decade.
Voice quality: summary
The acoustic analysis shows that F3 is rising over the decades across all vowels but without other discernible changes to F1 and F2. Auditorily, all speakers have retracted tongue body and show tongue body lowering as well as advanced tongue tip/blade. There is a nonsignificant trend toward tongue body raising over the decades. We also found a significant positive relationship between tongue body height and F3.
CHANGES TO CODA /R/: TAKE 2
Having observed an overall increase in F3 in Glasgow English, we return to coda /r/. Are the acoustic changes observed for /r/ unique to this segment, or do they follow from the broader changes in voice quality? To answer this question, we added a new parametric predictor variable to the GAMMs from our first acoustic analysis of coda /r/: baseline F3, the average F3 values for each speaker from the vowel analysis in the previous section. Baseline F3 allows us to control for changes in F3 that are manifested across the board, and to isolate the unique contribution of /r/.
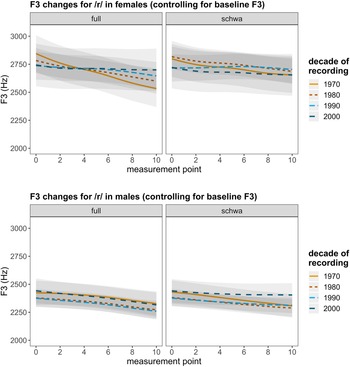
Figure 7 shows model predictions after controlling for baseline F3. Overall model comparisons suggest that decade of recording retains its significance for female speakers even after including baseline F3 (χ2(10) = 10.876, p = 0.016); however, decade of recording is no longer significant for male speakers (χ2(10) = 4.919, p = 0.455). This is consistent with Figure 7. In V+/r/ sequences with full vowels, the females show a gradual flattening of the formant trajectory, which is realized mainly by a rise in F3 near its end. This change is small compared to the large shift that was observed before controlling for baseline F3 (Fig. 2), but it does suggest that female Glaswegian speakers born near the beginning of the twentieth century show decreasing rhoticity in some contexts. On the other hand, no systematic changes are observed in unstressed V+/r/ sequences for female speakers, or in any context for male speakers.
Model predictions from GAMMs with 95% confidence intervals showing changes in F3 trajectories corresponding to V+/r/ sequences. These models include baseline F3 as a control variable. Top: females; bottom: males. Left: syllables with full vowels; right: unstressed syllables.
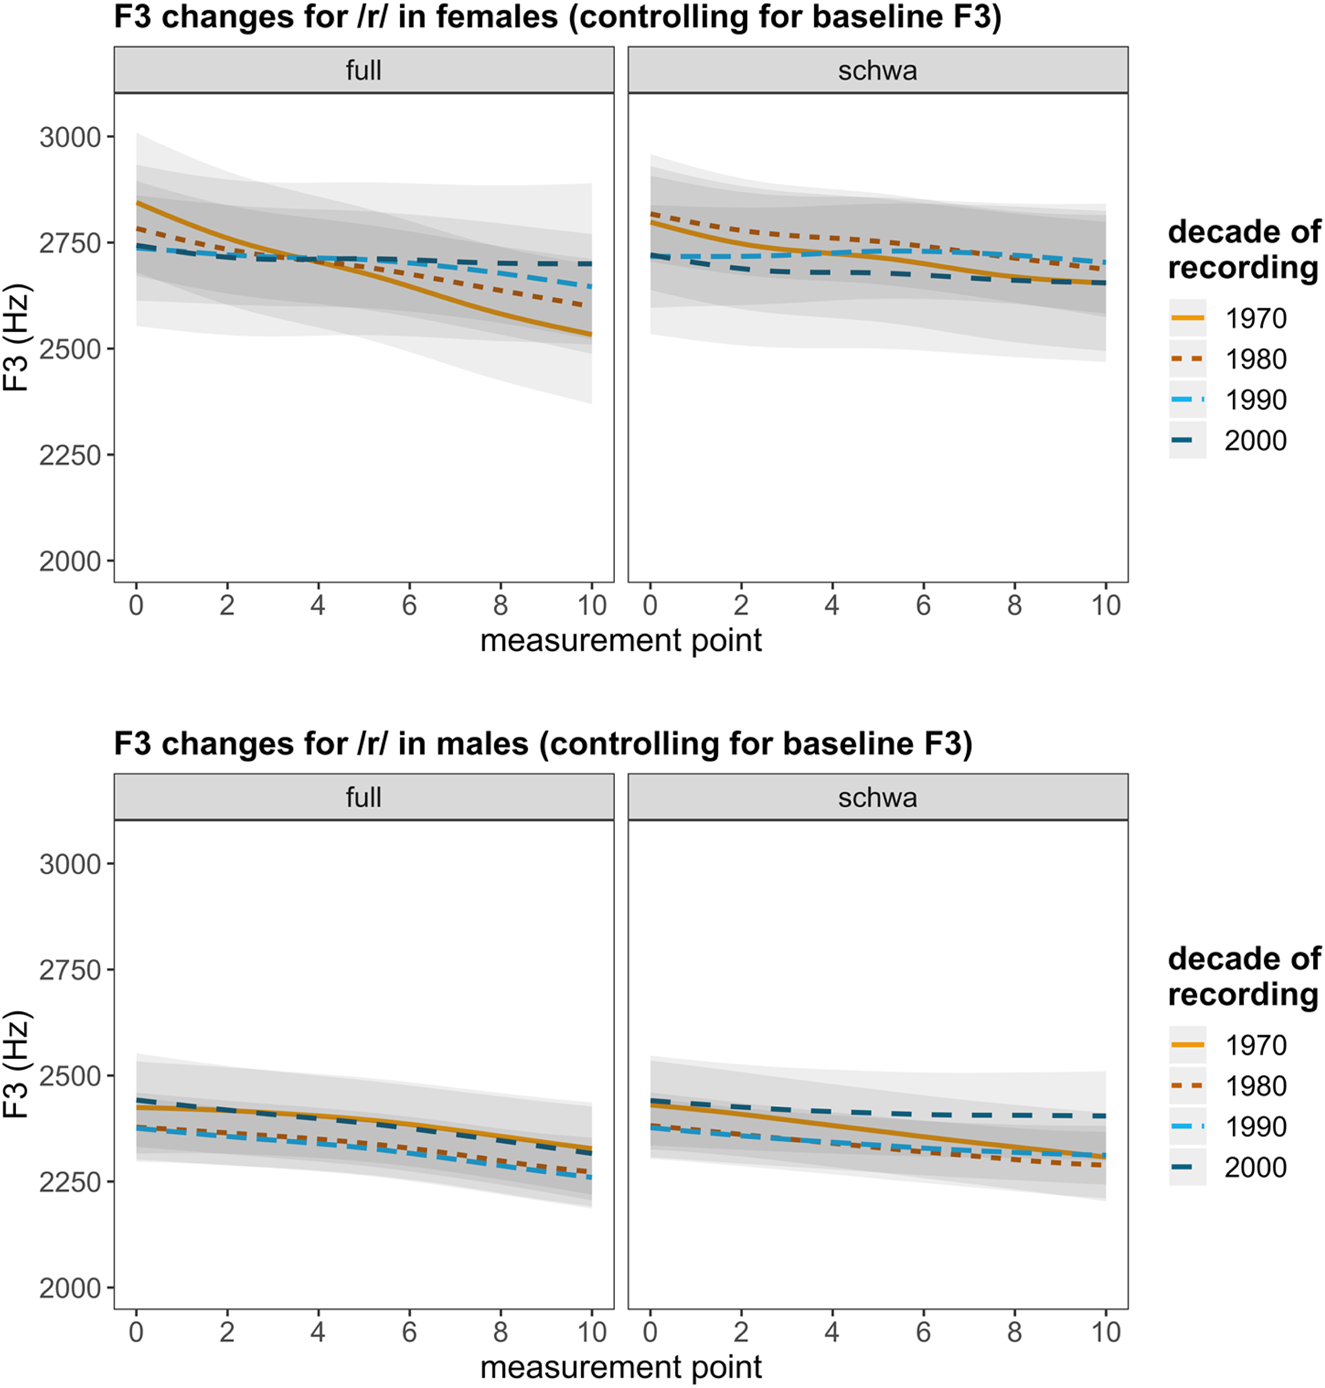
The flattening F3 trajectories in the females and lack of a steep downward slope in F3 in the males could be interpreted as a sign that rhoticity has largely been lost by the end of the period under investigation. This interpretation seems unlikely for two reasons. First, a comparison of Figures 5 and 7 shows that F3 is generally lower near the end of V+/r/ sequences (especially for speakers recorded more recently) than in vowels in nonrhotic contexts. Second, our auditory analysis of coda /r/ identified only a small number of tokens with complete loss of rhoticity and a substantial number of tokens retaining a rhotic segment. We therefore interpret the modest acoustic changes observed in the females as the initial stages of a large-scale shift toward /r/-weakening that continued to unfold over the rest of the twentieth century.
DISCUSSION: WHEN SOUND CHANGE IS MORE THAN SEGMENTAL CHANGE
Let us briefly summarize our main findings. While auditory analyses of /r/ did not reveal consistent patterns of change in coda /r/, our final acoustic analysis suggests that /r/-loss may already have been underway in female Glasgow English speakers at the beginning of the twentieth century. The observed changes are small, especially when compared to the voice quality shifts, and not present in unstressed vowels or for male speakers. Our acoustic analysis of F3 in vowels revealed a robust increase in F3 over three decades. This change is observed for all speakers and is consistent with the changes in /r/ and /l/ reported in Stuart-Smith et al. (Reference Stuart-Smith, Lennon, Macdonald, Robertson, Sóskuthy, José and Evers2015). The fact that the rise in F3 is observed in both the vowel and the liquid data is significant, because they were collected using different methodologies: the vowel formant measurements were extracted automatically, while the liquid formant trajectories were all hand-corrected. The presence of the same pattern in both types of data is an important confirmation of the validity of our methods. Finally, our auditory analysis of voice quality identified a significant correlation between tongue body height and F3, and a suggestive but nonsignificant link between decade of recording and tongue body height. Our interpretation of these auditory results is that there was an increase in velarization in our speakers.
Coda /r/ in the early twentieth century
We first discuss how our findings about coda /r/ in speakers born between 1890 and 1920 fit into a broader view of /r/-loss in Glasgow, based on other sources of evidence, and bring these separate strands of evidence together into a single narrative. We then suggest a possible link between voice quality changes and the loss of /r/.
The earliest evidence relating to coda /r/ in Glasgow English comes from a study of WW1 soldiers (Stuart-Smith & Lawson, Reference Stuart-Smith, Lawson and Hickey2017). These speakers show phonotactically induced derhoticization by 1916/17, especially in unstressed prepausal syllables (e.g., Scots faither, “father”). This is consistent with the observation that certain phonological contexts are more likely to incur gestural delay and so audibly absent/weak /r/. The contemporary articulatory data analyzed in Lawson et al. (Reference Lawson, Stuart-Smith and Scobbie2008) show not only gestural delay but also early tongue root retraction. Tokens of weak /r/ in these phonotactic environments have a weakened anterior gesture and audible secondary articulation on the preceding vowel from the early dorsal gesture. Therefore, it appears that /r/-loss in Glaswegian began through phonologically conditioned variation arising from gestural timing. But even the WW1 soldiers show some instances of weak/absent /r/ in more unusual phonotactic contexts, pointing to the beginnings of a more general segmental change.
Our next piece of evidence comes from the present analysis, which considers data from speakers who represent the period during and immediately after the WW1 soldiers. We find limited evidence for changes in /r/: the acoustic data for the females shows small, phonotactically conditioned changes, but no changes are seen elsewhere. Thus, patterns of variation in coda /r/ seemed to remain relatively stable in this period, with some incipient changes in females.
Stuart-Smith and Lawson (Reference Stuart-Smith, Lawson and Hickey2017) analyzed weak /r/ in middle-aged speakers from the Glasgow Sounds of the City corpus, born in the 1940s and 1950s. These speakers show a similar degree of weak/absent /r/ to that of the WW1 speakers, suggesting that for several decades Glaswegian vernacular experienced a gradual shift in phonotactically induced /r/-weakening, with perhaps more segmental weakening for some speakers than others.
Derhoticization then took off as a segmental change in the 1980s, as one of a group of nonstandard, socially salient, consonantal features allowing their speakers to distance themselves from “posh,” respectable, middle-class Glaswegians, especially when given the stylistic opportunities to do so (e.g., reading a wordlist to a researcher; passing posh people on the street, and so on; Stuart-Smith et al. [Reference Stuart-Smith, Timmins and Tweedie2007]), and accelerated also by media influence (Stuart-Smith et al., Reference Stuart-Smith, Lawson, Scobbie James, Celata and Calamai2014).
Our findings about voice quality add a tantalizing new dimension to this narrative. Specifically, what we have always considered to be a segmental change may have actually begun as a change in voice quality. A steady shift in voice quality, evidenced through rising F3, and possibly a shift in tongue body height, was in progress by the 1890s. The acoustic and auditory similarity between this newly emerging voice quality setting and weak /r/ may have led to the long-term voice quality setting being misparsed as a segmental property of coda /r/. The misattribution of long domain acoustic cues to specific segments is a widely accepted explanation for sound changes, such as dissimilation and metathesis, and has also been extended to account for other types of change (e.g., Blevins, Reference Blevins2004; Ohala, Reference Ohala, Masek, Hendrik and Miller1981). This type of misattribution would have been even more likely here because weakened and inaudible /r/ variants already existed in certain phonotactic positions. We therefore suggest that the generalization of /r/-weakening across phonological contexts was at least partly triggered by changes in voice quality.
Real-time change in voice quality
Our findings about voice quality are consistent with Stuart-Smith (Reference Stuart-Smith, Foulkes and Docherty1999), who reported velarized voice for speakers born during the 1940s and after the urban regeneration in the 1980s. For the oldest speakers analyzed in the current paper—born at the beginning of the twentieth century—we did not hear fully velarized voice qualities (note that velarization was not directly coded as part of the VPA analysis). Impressionistically, full velarization starts to appear among the speakers recorded in the 1990s and 2000s, which is also captured by the second author's impression that some of the women born around 1920 sound “modern.” These changes are linked to the robust increase in F3 in the acoustic data and possibly to the subtle (nonsignificant) trend of tongue body raising identified by the VPA analysis.
We argue that a real-time rise in F3 without changes to F1 and F2 is consistent with an increase in auditory velarization. We can infer the possible acoustic signatures of lingual settings from three kinds of evidence: segmental acoustics, short-term secondary articulations, and longer-term voice quality (Laver, Reference Laver1980:55). There is little relevant evidence for voice quality, though indications are given in Laver's own investigation carried out with Francis Nolan and summarized and illustrated in his Table 1 and spectrogram in Laver (Reference Laver1980:17f.). The hallmarks of pharyngeals, and pharyngealization as a secondary articulation, are F1 raising, F2 lowering, and lowering of F3 (Fant, Reference Fant1975; Ladefoged & Maddieson, Reference Ladefoged and Maddieson1996; Laver, Reference Laver1980). “Dark” laterals have a secondary articulation that phonetically can be velarized, uvularized, or pharyngealized; the result is F2 lowering and sometimes F1 raising (Carter & Local, Reference Carter and Local2007); F3 is typically high for laterals.
First, our findings are not consistent with the assumption of increased pharyngealization over time. Although Glaswegian, and Edinburgh English (Esling, Reference Esling1978), are known for their stereotypically pharyngealized voice quality, pharyngealization depresses F3, which is the opposite of our findings.
Second, the lack of changes in F1 and F2 over time suggests that the tongue body is not becoming any more retracted. Laver (Reference Laver1980:46) stated that “tongue-retracted voice” (by which he meant velarization, uvularization, or pharyngealization) will show relatively higher F1 and lower F2, which is not something that we observe. Moreover, while almost all of our speakers were heard with retracted tongue body, the auditory analysis did not provide evidence for further retraction.
Third, according to Fant (Reference Fant1975:13), F3 raising in back vowels reflects “a contraction in the uvular region”; we would therefore expect uvularization (tongue body retracted and raised) also to show raising of F3. More recently, Lawson et al.'s (Reference Lawson, Stuart-Smith and Scobbie2018) auditory-acoustic-articulatory study of Glaswegian coda /r/ confirmed that auditorily weak (and absent) /r/ is strongly correlated with raised F3 (but not with shifts in F1/F2) and is produced through the sequence of an early tongue dorsum gesture and a late tongue-tip gesture after voicing has ceased, effectively masking the segment. The resulting secondary articulation sounds variably uvularized or velarized, presumably depending on the degree and location of the dorsal constriction. Both velarized and uvularized voice quality in Laver's Table 1 (Reference Laver1980:17) show raised F3, which may mean that the articulation underlying velarization is actually uvular, since a narrower stricture in the velar region should provoke F3 lowering.
We conclude that the F3 raising observed here likely reflects an increasing uvularized or velarized voice quality. The later observation that velarization is now the key dimension of voice quality separating working-class from middle-class speakers (Stuart-Smith, Reference Stuart-Smith, Foulkes and Docherty1999) suggests that we are observing the early emergence of velarized voice quality for Glaswegian. This interpretation does not exclude accompanying pharyngealization, since pharyngealization can be achieved not only by tongue body retraction but also by tongue root retraction (Laver, Reference Laver1980:46). Hence Glasgow voice quality is typically now velarized with some pharyngealization, as identified by Stuart-Smith (Reference Stuart-Smith, Foulkes and Docherty1999).
Our interpretation is consistent with the observed increase in tongue body height, though we treat this result with caution given its lack of significance. Due to the small sample size and the inherent noisiness of the VPA, it is difficult to draw conclusions from this null result. The estimated change in tongue body height is about 4–5 times greater than the corresponding changes in tongue body front/backness and tongue tip. Thus, while the results for the latter two parameters do not suggest change, the same cannot be said of tongue body height. In sum, the acoustic and auditory facts point toward uvularization and velarization, which is based on (i) our auditory impressions of velarization (not only tongue body height), (ii) the exclusion of other possible candidates, and (iii) extrapolation from speakers born later.
Sound change in a vacuum
One of our key findings is that an apparent change in rhoticity is largely an artifact of a broader shift in voice quality. Moreover, we argue that the voice quality change may have been instrumental in provoking the weakening of rhoticity that appears incipient in our speakers and has since become an important feature of this variety. This suggests a view of sound change where segmental changes are considered not in a vacuum, but in the context of broader changes in a sound system (Sóskuthy, Reference Sóskuthy2015).
The methodological importance of viewing sound changes in their broader context is illustrated by how our research unfolded over time. Our original goal was to find out whether changes in /r/ (and /l/; Stuart-Smith et al. [Reference Stuart-Smith, Lennon, Macdonald, Robertson, Sóskuthy, José and Evers2015]) were already underway in Glaswegian around the beginning of the twentieth century, and, therefore, our focus was on liquids. Our initial acoustic analyses suggested that coda /r/ was changing substantially in all speakers in all phonological contexts. This is typically the point where most investigations of sound change are wrapped up and the results submitted for publication. In our case, this would have meant publishing misleading results, as neither the auditory analysis, nor the baseline-controlled acoustic reanalysis, confirmed the robust segmental changes that we had found originally. It was only because of the anomalous rise in F3 for /l/ that we decided to look at F3 in vowels, which led to the realization that the shifts in /r/ are largely (though not entirely) due to voice quality. Had we focused even more narrowly on /r/, we probably would not have discovered the overall shift in F3 that prompted our re-evaluation.
Our key point is that looking at sound changes in a vacuum can produce misleading results. It seems unlikely that there are numerous reported sound changes that simply reflect broader changes in vocal setting; however, our results, together with Trudgill's (Reference Trudgill1974) observations, suggest that it is equally unlikely that there are none. Caution should therefore be taken when evaluating individual segmental changes. We are not suggesting that every investigation should consider entire sound systems, but that results about isolated changes should be evaluated critically before being advertised to the broader research community. Such critical evaluation may involve searching the literature for information about other changes in the same variety, auditory analysis of the speech materials, considering formant dynamics instead of single-point measurements (which, in our case, strongly suggest a broader change in voice quality given that the shifts in F3 appear throughout the entire V+/r/ sequence), and using multiple methodologies for data analysis.
This last point is important: the discrepancy between the auditory and acoustic analyses of /r/ was a clue that the overall picture is more complicated than a straightforward segmental change. Relying on multiple methodological tools can help weed out spurious results, strengthen analyses, and make the interpretation of the data more straightforward.
Engaging with the broader system—and, more specifically, voice quality—can also be theoretically important. Segments and vocal settings are realized by the same vocal apparatus and are not independent. The fact that /r/-weakening and a change in vocal setting occurred at the same time raises the possibility that these changes are causally linked. Ohala's (Reference Ohala, Masek, Hendrik and Miller1981) and Blevins's (Reference Blevins2004) theories of the role of misperception and misparsing in sound change provide a plausible causal mechanism for such a link. This fits neatly into the view of vocal settings as the potential origins of some sound changes put forward by Trudgill (Reference Trudgill1974) and adds to the emerging body of evidence for links between changes to settings and segments (Levon & Holmes-Elliott, Reference Levon and Holmes-Elliott2017; Podesva et al., Reference Podesva, Callier, Voigt and Jurafsky2015; Stuart-Smith, Reference Stuart-Smith, Foulkes and Docherty1999; Trudgill, Reference Trudgill1974).