Introduction
Social protection in Latin America has been transformed significantly during the last two decades. By the end of twentieth century, the ‘truncated’ development of most Latin American welfare regimes had produced social insurance systems of limited coverage, protecting, primarily, formal sector urban workers and their families (Barrientos, Reference Barrientos2009; Filgueira and Filgueira, Reference Filgueira, Filgueira and Huber2002; Franco, Reference Franco, Franco and Lanzaro2006). However, during the present century, the majority of governments in the region have began to transform their welfare regimes by extending social protection to previously excluded families and social groups. Conditional cash transfer programmes (CCTs) have been, and continue to be, at the centre of this transformation.
CCTs are effectively social assistance programmes that deliver means-tested conditional cash benefits to poor families. Payment of benefits is dependent on the participating family meeting certain conditions such as participating in a number of health-related activities or ensuring children's school attendance. The theoretical and normative principles that influenced the design of CCTs are to be found in the social investment (SI) perspective. SI is an emerging approach to social policy design that seeks to ‘adapt’ social protection to contemporary economic and social conditions, by prioritising policies that invest in human capital (Jenson, Reference Jenson2010; Morel et al., Reference Morel, Palier, Palme, Morel, Palier and Palme2012). In fact, CCTs represent a paradigmatic case of applying the SI perspective to social programme design.
CCTs were originally introduced in Brazil and Mexico in the second half of the 1990s but were adopted rapidly throughout the region and beyond. By 2015, every country in Latin America had a CCT programme and nowadays variants of CCTs can be found in almost every continent (Barrientos, Reference Barrientos, Farnsworth and Irving2011; Fizsbein and Schady, Reference Fizsbein and Schady2009). Following up after two decades since their initial implementation, our article seeks to provide an overview of the current state of CCTs in Latin America, to present key arguments made in recent academic literature in favour and against them and to evaluate their achievements and shortcomings in terms of their potential to address the region's social protection challenges, many of which are shared not only with semi-peripheral and peripheral regions but also with countries in the capitalist core in what has been termed as economic ‘North’.
The article is organised as follows. The next section reviews the SI perspective and its adoption for the design of social policy in Latin America. The third section outlines the principal characteristics of CCTs. The fourth section offers an overview of the expansion process of CCTs throughout the region during the last two decades. The next section discusses the achievements and shortcomings of CCTs in terms of their potential to reduce poverty levels. Finally, some concluding remarks are offered.
The social investment perspective in Latin America
Since the first decades of the twentieth century, social protection in Latin America has been based on Bismarckian social insurance systems that, unlike their counterparts in Europe, not only did not achieve universal coverage, but in many countries did not even reach half of the population (Filgueira and Filgueira, Reference Filgueira, Filgueira and Huber2002; Mesa-Lago, Reference Mesa-Lago2000). However, during the 1990s, coinciding with processes of political and economic liberalisation, a process of major transformation of social protection began. The principles that have guided the expansion of social protection include: the recognition of markets as the medium to break with poverty; the co-responsibility of individuals for their own welfare; delivering cash transfers to subsidise the purchase of services instead of focusing on the provision of services; decentralisation of services; an emphasis on the neediest groups and on precise targeting of potential beneficiaries; and the importance of the impact of programmes measured in comparison with their initial objectives (Franco, Reference Franco, Franco and Lanzaro2006). Principles like these ones have been conceptualised from the SI perspective and materialised in the form of CCTs (Jenson, Reference Jenson2010; Franco, Reference Franco, Franco and Lanzaro2006).
The SI perspective represents an emerging social policy paradigm, different from traditional Keynesianism and neoliberalism, that emphasises the investment in human capital and views social policy as a productive factor for economic development and employment growth, in order to address contemporary economic and social conditions such as the flexibility of labour markets and the changes in family structures (Morel et al., Reference Morel, Palier, Palme, Morel, Palier and Palme2012; Jenson, Reference Jenson2010). From this perspective, social policy should be about investing in human capital to provide the necessary resources for people to face economic risks, promoting co-responsibility, not only rights, guaranteeing equality of opportunities and prioritising active policies rather than passive forms of social protection (Morel et al., Reference Morel, Palier, Palme, Morel, Palier and Palme2012; Giddens, Reference Giddens1998). It is a child-centred perspective, since investment in this group is considered necessary to provide future adults with the capabilities to face risks, assume responsibility for their own welfare and promote equality of opportunities in society. The perspective has been officially adopted by the European Union, international organisations and governments in the Americas for the design of social policies (Jenson, Reference Jenson2010; Cantillon, Reference Cantillon2011).
Some authors have traced the origins of the SI perspective back to Sweden in the 1930s, where concerns about low fertility rates during an economic crisis resulted in the promotion of social policies that aimed to invest in human capital and support economic growth and productivity (Deeming and Smyth, Reference Deeming and Smyth2015; Morel et al., Reference Morel, Palier, Palme, Morel, Palier and Palme2012). Nonetheless, it was not until after the failure of neoliberalism in the 1990s to address poverty and other social problems that the perspective spread (Jenson, Reference Jenson2010), recognising a role for state intervention, albeit adapting it to contemporary economic and social conditions, and prioritising investment in policies that aim to minimise the intergenerational transmission of poverty and to promote equality of opportunity in the present to improve future living standards (Morel et al., Reference Morel, Palier, Palme, Morel, Palier and Palme2012). SI is meant to adapt social policy to the so-called ‘knowledge-based economy’, which should rest on a skilled and flexible labour force that can adapt to the constantly changing needs of the economy and be a motor of those same changes due to their potential for innovation.
Lavinas (Reference Lavinas2013), however, has placed the origins of concerns with human capital formation in the works of economists of the University of Chicago, who applied it to explain differences in levels of development across countries. According to this account, these economists disputed dependency theory, then popular throughout the global south, by arguing that the key to understanding why some countries were underdeveloped lay in their failure to promote human capital, diverting the attention from structural factors. This view was adopted by the United States’ development agency (USAID) and has been promoted throughout Latin America since the 1970s. According to this author, that perspective would have been epitomised a few decades later in the form of CCTs.
Characteristics of CCTs
CCTs offer targeted cash transfers to poor families with school and health conditionalities. Their main aim is to break with the intergenerational transmission of poverty by investing in the formation of human capital. There are differences in the objectives that some programmes claim to pursue,Footnote 1 but in practice all of them focus on the formation of human capital of poor families, and they share several basic characteristics that represent innovations in the anti-poverty policy of the region. First, they target families in extreme poverty. Targeting in many cases is perceived as the best way to make spending of scarce resources more efficient. The most used tools for targeting are proxy-means tests, which estimate income of potential beneficiary households with data from national surveys.
Secondly, CCTs provide benefits in the form of cash transfers, unlike previous anti-poverty initiatives that mostly delivered benefits in-kind, such as food subsidies. Some of the arguments made in favour of cash transfers have been that their administration is more straightforward and less intrusive to the functioning of local markets than distributing benefits, considering that cash liquidity allows families to obtain better prices and that families would value more the autonomy that cash transfers grant them (Levy and Rodriguez, Reference Levy and Rodriguez2005). Other arguments have been that spending on infrastructure can be regressive, availability of cash may allow families to embark on productive projects and protect them from risks and that ultimately they act as incentives for families to invest in human capital (Fizsbein and Schady, Reference Fizsbein and Schady2009). Benefits are paid to women, usually the mother, because as they are considered to be better administrators and more concerned with equal distribution of scarce resources within households (Lavinas, Reference Lavinas2013; Levy, Reference Levy2006). In most cases, amounts vary with the age, gender or school level of family members, but there are some programmes that pay flat rate benefits.
Thirdly, CCTs prioritise families with children. There are some programmes that also pay benefits to families with no children or to the elderly or disabled; however, the main focus is always placed on families and children, since investment in children is seen as the way in which the intergenerational transmission of poverty will be broken and future adults will have the necessary human capital to escape poverty. That prioritisation represents the core element of the SI logic; by investing in human capital now, CCTs seek to reduce poverty levels in the future.
Fourthly, all programmes set certain conditionalities that families must meet to preserve the right to receive benefits. Conditionalities have the objective to modify the behavioural patterns of beneficiaries. Behavioural conditionalities were already being used in social programmes in other regions, but the CCTs of Latin American design could perhaps represent the most popular example of their recent application to social policy (Standing, Reference Standing2011). They mostly include school attendance by children, and compliance with health appointments and health activities by all household members. Conditionalities impose a cost on recipients that is seen as beneficial to them in promoting the building of their human capital (Lavinas, Reference Lavinas2013).
Lastly, CCTs have been extensively evaluated. Mexican designers made the decision to incorporate impact evaluations in the original design of Progresa, because they were concerned about the programme's continuity, given the opposition from within the government, and they wanted to demonstrate that their plans could generate positive outcomes. Evaluations were outsourced to national and international research institutions to guarantee their reliability (Levy and Rodriguez, Reference Levy and Rodriguez2005). Early Brazilian initiatives were also seen to produce positive outcomes by international organisations (Borges Sugiyama, Reference Borges Sugiyama2011; Sanchez-Ancochea and Mattei, Reference Sanchez-Ancochea and Mattei2011). Since then, impact evaluations of CCTs in Latin America have become common. Randomised control trials and related approaches have been widely used, but other qualitative techniques have also been applied. Positive results from impact evaluations are one of the main factors that explain the diffusion of CCTs throughout Latin America and beyond.
The expansion of CCTs in Latin America
The first country that experimented with conditional cash transfers was Chile, with the Unified Family Subsidy introduced in 1981 (Lavinas, Reference Lavinas2013), but the first large-scale CCTs emerged almost simultaneously in Brazil and Mexico during the second half of the 1990s, although under different contexts. In Brazil, the programmes originated at the sub-national level in the cities of Campinas and the capital Brasilia in 1995, where left-leaning politicians took advantage of the fiscal and administrative decentralisation established by the Federal Constitution of 1988 – a landmark of the democratic transition from military rule – to introduce anti-poverty programmes that aimed in the first place to guarantee a basic income to poor families (Sanchez-Ancochea and Mattei, Reference Sanchez-Ancochea and Mattei2011; Borges Sugiyama, Reference Borges Sugiyama2011; Lavinas, Reference Lavinas2013). They quickly spread to other cities; two years later eighty-eight cities had introduced their own CCT. In 2001, they were scaled up to the national level, when the federal government introduced four cash transfers programmes; the main programme granted transfers for children in school and was called Bolsa Escola, like the original programme from Brasilia. Later, in 2003, the four types of transfers were fused into one single programme called Bolsa Família (Sanchez-Ancochea and Mattei, Reference Sanchez-Ancochea and Mattei2011; Borges Sugiyama, Reference Borges Sugiyama2008).
In Mexico, however, the introduction of conditional cash transfers followed a top-down route. The first programme was called Programme for Education, Health and Nutrition (Progresa). It was designed by federal public officials from the Secretariat of Finance concerned with the ineffectiveness of previous anti-poverty initiatives and the rise in poverty levels caused by the economic crisis of 1995, which led to the collapse the Mexican economy (Borges Sugiyama, Reference Borges Sugiyama2011; Levy, Reference Levy2006; Levy and Rodriguez, Reference Levy and Rodriguez2005). Officials began piloting schemes in the last quarter of 1995; the proposal was then sent to Congress in September of 1996, and in August of 1997 Progresa was implemented at the national level, although only in rural areas (Levy and Rodriguez, Reference Levy and Rodriguez2005). The programme was renamed Oportunidades in 2002 and expanded to urban areas and new types of transfers were added during the following years. In 2014, more transfers were added and the name was changed to its current one Prospera (SEDESOL, 2014).
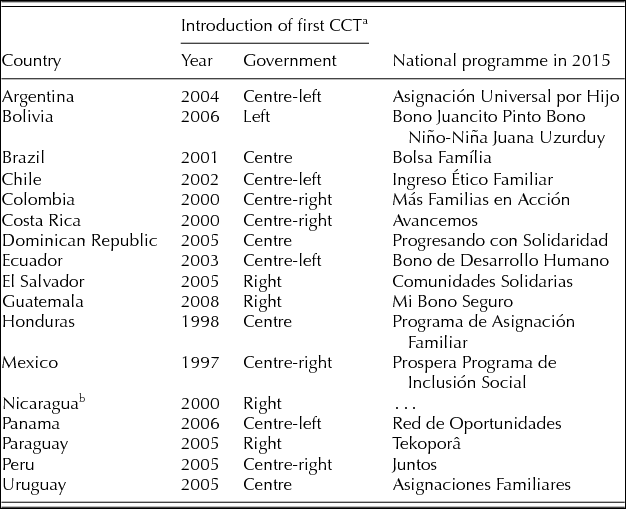
From Brazil and Mexico, CCTs rapidly spread to the rest of the region. By the mid-2000s, virtually every country had introduced a programme at the national level. Table 1 shows the year of introduction of the first national programme, the political orientation of the government that introduced it and the name of the programme in 2015. Currently, sixteen out of nineteen countries in the region have a CCT in operation. The only countries without a programme are Cuba and Venezuela,Footnote 2 which had never adopted one, and Nicaragua, which had introduced one in 2000 but cancelled it in 2006 (CEPAL, 2014; Fizsbein and Schady, Reference Fizsbein and Schady2009).
Introduction of CCTs in Latin American countries

Notes:
a Year of introduction of first national programme.
b Nicaragua's programme was cancelled in 2006.
Sources: Borges Sugiyama (Reference Borges Sugiyama2011) and CEPAL (2015).
CCTs cannot be associated with a particular political orientation since governments of all political spectrums have adopted them. Favourable economic conditions generated by a commodity boom might have enabled the expansion of CCTs, although not all countries registered high Gross Domestic Product (GDP) growth rates, and, in fact, in countries such as Mexico, rates have been quite meagre over the last twenty years (World Bank, 2016). Strong institutional structures are certainly one factor that must be considered when explaining social policy expansion in Latin America, especially when compared to expansion attempts in other so-called ‘developing’ regions (Barrientos, Reference Barrientos, Farnsworth and Irving2011). Yet, probably the most salient factor that can explain social policy expansion in Latin American countries is the democratic context (Kaufman and Nelson, Reference Kaufman and Nelson2004; Dion, Reference Dion2010; Huber and Stephens, Reference Huber and Stephens2012) under which CCTs were introduced.
By the late 1990s, practically all countries had consolidated pluralist democratic regimes. Electoral competition has been suggested as the main reason for the adoption of CCTs across the region (Borges Sugiyama, Reference Borges Sugiyama2011; Hall, Reference Hall2012; Feitosa de Britto, Reference Feitosa de Britto, Barrientos and Hulme2008). This may not apply to all programmes; in the case of the first Mexican programme, for example, the implementation of Progresa was actually delayed until after the mid-term elections of 1997 to avoid possible political effects (Levy and Rodriguez, Reference Levy and Rodriguez2005). Nonetheless, democracy may have impacted policy in a different way, for example, by opening up the political environment and incorporating new actors into political and policy-making processes. In Brazil, leftist politicians who introduced the first CCTs would have never been in positions of power under a non-democratic regime.
Moreover, CCTs and the SI perspectives have been identified as the governments’ responses to increases in poverty and inequality generated by neoliberalism (Jenson, Reference Jenson2010). In non-democratic contexts, governments may not have felt pressured to respond to such increases, or, in the best of cases, they might have chosen the traditional path of clientelistic policies for social control.
There is still the question of why governments chose the particular design of CCTs to respond to rises in levels of poverty and inequality. Here, the results of impact evaluations were crucial to gain the endorsement of international organisations such as the World Bank and the Inter-American Development Bank (IADB). It has been argued that international organisations endorsed CCTs because they did not interfere with their market-centred ideology (Lavinas, Reference Lavinas2013; Damian, Reference Damian and Calva2007). The promotion of the CCT model was supported by the evidence generated from short-term impact evaluations. However, after almost two decades of their implementation in some countries, the time might have come to reassess the poverty reduction potential of CCTs – and more broadly of policies that prioritise human capital formation – in order to identify the gaps that may exist in anti-poverty strategies. This themed section aims to provide a modest contribution to that reassessment.
CCTs and social outcomes in Latin America: achievements and limitations
The positive impact of CCTs has been extensively discussed in the literature on Latin American social policy (Levy, Reference Levy2006; Fizsbein and Schady, Reference Fizsbein and Schady2009; Barrientos, Reference Barrientos, Farnsworth and Irving2011). Since Mexican reformers took the decision to incorporate impact evaluations into the original design of Progresa, CCTs may well have become the most evaluated programmes in history, in many cases using randomised control trials and similar techniques, following the original design of evaluations of the Mexican programme, although other approaches have also been applied.
Evaluations have provided ample evidence that CCTs increase consumption levels of beneficiary families, raise nutrition levels of children and in general of all family members, increase school attendance and reduce dropout rates and do not generate the withdrawal of beneficiaries from labour market participation, among several other positive results.
Given the available evidence, the achievements of CCTs seem to be unquestionable. There are, however, several problems that have been identified like inclusion and exclusion errors of targeting mechanisms, lack of education and health infrastructure, negative effects on community relations and ethical issues regarding randomised control trials, among others. These have also been extensively discussed elsewhere (Damian, Reference Damian and Calva2007; Fizsbein and Schady, Reference Fizsbein and Schady2009). Apart from these problems, there are questions that remain concerning several aspects of CCTs’ design and implementation that may limit their potential to combat poverty, some of which the articles in this themed section intend to address.
Nagels (this issue) provides further evidence on the gendered effects of CCTs from the Bolivian and Peruvian programmes; Ramírez (this issue) analyses the implementation of the Mexican programme and points out the importance of beneficiary–officer relationships for programme outcomes; and Medrano (this issue) focuses on an area still very much understudied: the design of CCTs at the subnational level in Mexico, and identifies the principles followed in their design that may limit their impact. Jones (this issue) points to the need to improve the quality of schooling and access to labour markets in order to increase the potential of CCTs to combat poverty, providing evidence from Brazil. Her insights, as well as the article by Barrientos and Villa (this issue), highlight the importance of assessing the long-term effects of CCTs in terms of poverty reduction, and of establishing if they hold the capacity of breaking the intergenerational transmission of poverty. Arguably, after several years, CCTs would be expected to have had an impact on poverty rates, which in the end should be the main objective of any country's anti-poverty policy. In most Latin American countries, the programmes have been in operation for more than one decade, and in the case of the first programmes, such as the Mexican one, for almost two.
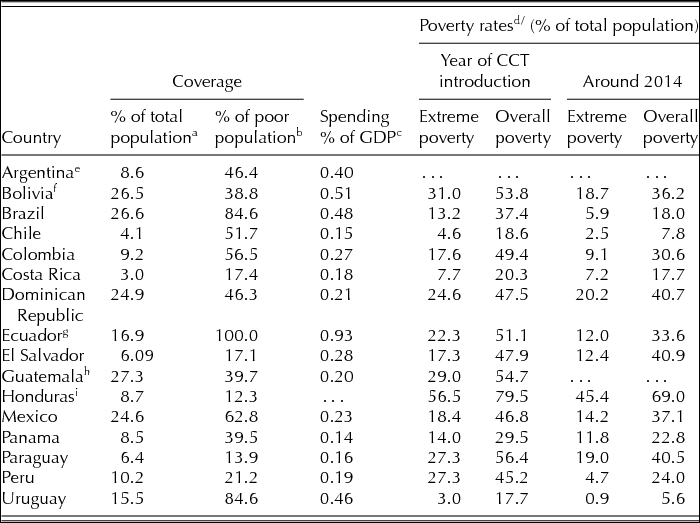
The expansion of CCTs has coincided with important reductions in poverty not observed for several decades in the region; but not at the same rate in every country. Table 2 presents, for each country with a CCT in 2015, coverage percentages of total and poor population, spending on CCTs as percentages of GDP, and extreme and overall poverty rates for the beginning and the end of the periods when CCTs have been in operation. All data were taken from reports and website statistics published by the Economic Commission for Latin America and the Caribbean (ECLAC).
Characteristics of CCTs and variations of poverty rates
Notes: aCoverage percentages of total population for the years 2013–15, depending on the latest available for each country in the Base de datos de programas de protección social no contributiva en América Latina y el Caribe CEPAL (2015), except Honduras which corresponds to 2009 taken from ECLAC (2014).
b Coverage percentages of poor population including extreme and overall poverty for the years 2008–09, taken from (ECLAC, 2014).
c Spending percentages for the years 2012–14, except for Chile and Panama (2011), Bolivia (2010) and El Salvador (2007), latest available in CEPAL (2015).
d Poverty rates estimated by ECLAC in absolute terms. Extreme poverty, also called indigence, is measured in terms of the minimum income necessary to purchase a basic food basket to cover a person's nutrition needs. Overall poverty, referred simply as poverty by ECLAC, adds to the poverty line additional goods and services required to meet basic non-nutritional needs (ECLAC, 2015). The rates presented in the table correspond to the closest year available to the year of introduction of the first CCT and the last year available in ECLAC's database.
e ECLAC does not report poverty rates for Argentina.
f Coverage corresponds to the two programmes Bono Juancito Pinto and Bono Niño-Niña Juana Uzurduy, spending only to the former because no data are reported for the latter.
g The percentages of 100 per cent of total population covered with 16.9 per cent of total population can be explained because the former corresponds to 2009 and the latter to 2015.
h No data on poverty around 2014 for Guatemala because the latest year available by ECLAC is 2006.
i ECLAC does not report data spending for Honduras.
There are significant differences in coverage and spending levels and in variations in poverty rates across countries. The country with the highest coverage percentage of the total population in recent years is Guatemala – more than 25 per cent of the total population – with Brazil and Mexico – where CCTs where pioneered – occupying the second and fourth places. At the other end of the scale, the Chilean and Costa Rican programmes only deliver benefits to 4.1 and 3 per cent of the population, respectively.
Regarding spending on CCTs, the countries with the largest budgets are Brazil and Mexico (ECLAC, 2014), but when measured as a percentage of GDP, by the second decade of the twenty-first century the country devoting the most resources to its CCT was Ecuador with almost 1 per cent, whilst Chile was the lowest spender, with only 0.14 per cent, and the regional mean was 0.32 per cent.
The country that has been most successful at reducing extreme poverty after adopting a CCT was Peru, where the rate fell 83 per cent, followed by Uruguay with a reduction of 70 per cent and Brazil of 55 per cent. The less successful countries were Panama and Costa Rica, where the rate dropped by only 16 per cent and 6 per cent, respectively.
Figure 1 shows the correlation of average spending on CCTs as a percentage of GDP for the periods when CCTs have been in operation in each country, and the proportional variations in extreme poverty rates for similar periods. The figure presents the z-scores of both indicators, with the x-axis representing changes in poverty rates and the y-axis spending. Therefore, countries on the positive side of the x-axis register poverty reductions higher than the mean and countries on the negative side lower than the mean; countries on the positive side of the y-axis spend more than the mean and on the negative side lower than the mean.
Notes:
Correlation coefficient 0.18.
x-axis: proportional variations of national absolute extreme poverty rates for approximate periods when CCTs have been in operation in each country.
y-axis: average annual spending on CCTs as a percentage of GDP until the latest year available in ECLAC's database.
The following countries were not included:
Argentina because ECLAC does not report poverty rates for that country.
Honduras because ECLAC does not report spending percentages of GDP and Guatemala because only ne year of spending is reported.
To complement series on spending, budget as a percentage of GDP instead of spending was used if available in ECLAC's database, in the cases of the following countries and years:
Bolivia 2009, 2011 and 2012, only for the programme Bono Juancito Pinto, since no data is reported for the Bono Niño-Niña Juana Uzurduy except for 2009 budget (0.04% of GDP), which was added to
the calculations.
Chile 2012 and 2013.
El Salvador 2008–2012.
Mexico 2014.
Sources: Own elaboration with data from ECLAC (2015) and CEPAL (2015).
There is not a strong correlation between spending on CCTs and reductions in extreme poverty. Ecuador, Uruguay, Brazil and Bolivia are countries with spending levels above the region's average, and they have achieved reductions in poverty rates above the average. However, the Dominican Republic, El Salvador and Mexico are high spenders, also above or very close to the average, but register mediocre results in terms of poverty reduction. The case of Mexico stands out because it is the country with the oldest programme, yet poverty rates have remained at practically the same level throughout the last two decades (CONEVAL, 2014).
There are countries that spend less on CCTs than the region's average, but have a better records at reducing extreme poverty, examples are the cases of Peru, Colombia and Chile. Peru stands out because it is one of the countries that spends less but has the best record at reducing extreme poverty. The dispersion of cases suggests that spending on CCTs may not be necessarily associated with poverty reductions. It could be argued that SI programmes, that promote human capital, do not seek to have an immediate impact on poverty. Nonetheless, almost twenty years of CCTs in Mexico should be sufficient to reduce poverty, at least to the same, if not to a higher degree, than counties that spend less and/or that have had a CCT for a shorter period of time, but this has not happened. On the contrary, several countries in the region devote less resource to CCTs yet perform better in terms of poverty reduction.
Barrientos and Villa (this issue) point out that success in the combat against poverty will ultimately depend on the creation of favourable labour market conditions. Sánchez-Ancochea and Martínez Franzoni (Reference Martínez Franzoni and Sánchez-Ancochea2014) argue that effective reductions in inequality depend on processes of market incorporation, that include strong industrial policies, growth in minimum wages and promotion of labour rights and collective bargaining, and social incorporation that includes expansion of social protection through universal and targeted programmes. Elsewhere, Barrientos (Reference Barrientos, Farnsworth and Irving2011) and authors such as Lavinas (Reference Lavinas2013) and Lustig et al. (Reference Lustig and Lopez Calva2011) have also highlighted the central importance of labour earnings for poverty reduction. To illustrate these arguments, Figure 2 presents the correlation between poverty reduction and variations in the average earnings of the employed as a proportion of the poverty lines during the periods that CCTs have been implemented in each country. The latter is an indicator used by the ECLAC to compare average labour earnings in the region; for example, in Brazil between 2001, when CCTs were adopted on a national scale, and 2013, the latest year available, average earnings passed from representing 4.4 times the poverty line to 5.9 times. However, in Mexico the indicator actually fell and average earnings dropped from 3.3 times the poverty line in 1996 to 2.9 in 2012. As for Figure 1, this figure also graphs the z-scores; the x-axis represents variations in poverty rates and the y-axis the average earnings indicator.
Notes:
Correlation coefficient 0.68.
x-axis: proportional variations of national extreme poverty rates for approximate periods when CCTs have been in operation in each country.
y-axis: variations of the indicator average wages in times the national poverty lines for periods when CCTs have been in operation in each country.
Sources: Own elaboration with data from ECLAC (2015).
As can be observed, all countries that have achieved above-average improvements in extreme poverty rates also register increases in average earnings above the mean, namely the countries in the top-right quadrant, such as Peru, Uruguay and Brazil. Countries in the bottom-left quadrant are poor performers in both poverty reduction and earnings levels, such as Mexico and Costa Rica. No single country falls in the bottom-right quadrant, which means that there is not a country that is a good a performer in terms of poverty reduction but a poor performer in terms of labour earnings.
The case of Mexico stands out again. This is the country where labour earnings have fallen the most for the period CCTs have been in operation (ECLAC, 2015). At the same time, poverty rates have remained at practically the same levels, so spending on CCTs may only be avoiding further drops in poverty rates. In other words, the expansion of social policy is merely subsidising the fall in labour earnings. The question that remains then is how have some countries in the region managed to achieve improvements in labour earnings while others have not.
One factor to consider is increases to the minimum wage. As has been noted by several authors, the minimum wage in Latin America performs a fundamental welfare function. Many countries introduced minimum wage legislation during the first decades of the twentieth century, since then variations in minimum wages have been used as benchmarks to set wage increases in both the formal and informal sectors of the economy and to calculate amounts of social policy benefits and contributions (Barrientos, Reference Barrientos, Farnsworth and Irving2011; Lavinas, Reference Lavinas2013; Lavinas and Simoes, Reference Lavinas, Simoes, Fritz and Lavinas2015).
Figure 3 shows the proportional increases to the real minimum wage between 2000 and 2013, considering inflation rates. There are some caveats that should be considered here; for example, in some cases minimum wages could have been set at extremely low amounts at the beginning of the period and there may be problems with compliance rates across the economy. However, percentage increases do suggest that in countries where the minimum wage has increased more, average earnings have also increased.
Note: Bolivia (Bol), Brazil (Bra), Chile (Chi), Colombia (Col), Costa Rica (CR), Dominican Republic (DR), Ecuador (Ecu), El Salvador (ES), Guatemala (Gua), Mexico (Mex), Panama (Pan), Paraguay (Par), Peru (Per), Uruguay (Uru).
Source: Own elaboration with data from ILO (2014).
On the one hand, Uruguay, Brazil and Ecuador are the countries where average earnings have increased the most and are also the countries with the highest increases to real minimum wages – in the first case of 156 per cent, in the second 103 per cent and in the third 53 per cent, at the same level as Bolivia. On the other hand, poor performers in terms of labour earnings register meagre real increases to the minimum wage, for example Mexico and the Dominican Republic. Increases in minimum wages then show a strong explanatory potential of differences in poverty reduction across Latin American countries.
Conclusions
The expansion of social protection in Latin America has been mainly driven by the SI perspective through CCTs. The positive effects of that expansion are evident. The fact is that today millions of Latin American families, who in previous decades would have been neglected by the state, today receive significant benefits that help them improve their nutritional, educational and health status. Nonetheless, the question is whether CCTs designed under the influence of the SI approach can generate long-term substantial improvements in social outcomes.
The analysis presented in this article suggests that CCTs are not enough. If CCTs’ ultimate aim is to reduce poverty then they seem to work better when they are accompanied by – or form part of – a wider package of measures that enhance social and employment rights, integrating workers into the formal economy under better conditions. As Martínez Franzoni and Sánchez-Ancochea (Reference Martínez Franzoni and Sánchez-Ancochea2014) point out, substantial long-lasting improvements in inequality and poverty will depend on the successful adoption of processes of market and social integration. Such changes imply addressing the structural factors contributing to the persistence of poverty in the political economy of welfare in most Latin American countries.
It has been argued that concerns with human capital formation for the design of social policies were adopted to divert attention from addressing structural issues in Latin American countries (Lavinas, Reference Lavinas2013). Further research on the causes of poverty and inequality in the region, and the best ways to overcome them, would benefit from investigating the economic and political internal and external factors that can result in solid long-term improvements in living standards for the majority of the population. Our evidence suggests that unless the structural deficiencies of the political economies sustaining most Latin American welfare regimes are addressed, the potential of social investment policies to combat poverty in the region will remain limited.