


The analysis of time series data is often motivated by the desire to test for, and estimate, long run relationships (LRRs) between some scalar process,
 $y_{t}$
, and a set of weakly exogenous regressors,
 $\boldsymbol{x}_{t}$
. A recent exchange in Political Analysis highlighted some of the challenges analysts face in pursuit of this goal. Chief among these is that popular approaches assume analysts know the univariate properties of their data. Yet, if the analyst is uncertain whether their data should be classified as stationary, unit root, or fractionally integrated, the appropriate models, tests, and critical values are unclear. While this problem was raised in the exchange, the authors did not offer clear prescriptions for analysts. Our aim is to provide a means of testing for LRRs given uncertainty about univariate dynamics.
Time series modeling emphasizes the importance of pretesting. This is because the appropriate hypothesis tests and critical values depend on whether the data are
 $I(0)$
stationary processes or
 $I(1)$
unit root processes. In the case where the time series are all
 $I(1)$
, the analyst proceeds to test for a long run cointegrating relationship between
 $y_{t}$
and
 $\boldsymbol{x}_{t}$
. The Engle–Granger two-step methodology (Engle and Granger Reference Engle and Granger1987) and the single equation error correction model (ECM) (Banerjee, Dolado, and Mestre Reference Banerjee, Dolado and Mestre1998; Ericsson and MacKinnon Reference Ericsson and MacKinnon2002) are the most common approaches. If there is evidence of cointegration, the LRR can be estimated in a levels regression and the short run dynamics, including the rate of return to equilibrium, from an ECM (Pesaran and Shin Reference Pesaran and Shin1998). Absent evidence of cointegration, the analyst concludes no LRR exists between
 $y_{t}$
and
 $\boldsymbol{x}_{t}$
, and inference on short run dynamics proceeds from a regression in first differences.
In the case where the time series are all
 $I(0)$
, inferences about, and estimation of, the LRRs proceed in the standard linear regression framework. The analyst may choose to estimate an autoregressive distributed lag model, a generalized ECM, or restricted versions of either (Hendry Reference Hendry1995).
Generally, however, there is uncertainty in the pretesting process. Weak tests, short time series, and ambiguous theory mean diagnosing the unseen data generating process (DGP) with certainty is often impossible and fraught with opportunities for human error. Unit root tests are notorious for having low power, particularly with samples common in applied political science (Evans and Savin Reference Evans and Savin1981, Reference Evans and Savin1984; Campbell and Perron Reference Campbell and Perron1991; Stock Reference Stock1991; DeJong et al. Reference Dejong, Nankervis, Savin and Whiteman1992; Banerjee et al. Reference Banerjee, Dolado, Galbraith and Hendry1993; Elliott, Rothenberg, and Stock Reference Elliott, Rothenberg and Stock1996; Perron and Ng Reference Perron and Ng1996; Juhl and Xiao Reference Juhl and Xiao2003; Box-Steffensmeier et al. Reference Box-Steffensmeier, Freeman, Hitt and Pevehouse2014; Choi Reference Choi2015; Lebo and Kraft Reference Lebo and Kraft2017). The choices analysts make about serial correlation, the presence of deterministic components in test regressions, and appropriate levels of significance influence the results of these tests. Time series with upper and lower limits (Cavaliere and Xu Reference Cavaliere and Xu2014), fractional integration (Box-Steffensmeier and Smith Reference Box-Steffensmeier and Smith1996; Lebo, Walker, and Clarke Reference Lebo, Walker and Clarke2000), and near-integration (De Boef and Granato Reference De Boef and Granato1997) further complicate pretesting. Finally, the arsenal of pretests often provides inconsistent evidence for and against unit roots. Even when all pretesting indicates the data are unit root processes, misclassification is a significant risk (Perron and Ng Reference Perron and Ng1996).
The way forward is less clear in these cases. Some uncertainty can be accommodated by existing methods. If one is certain that
 $y_{t}$
is a unit root but unsure about
 $\boldsymbol{x}_{t}$
, Pesaran, Shin, and Smith (Reference Pesaran, Shin and Smith2001) (PSS) offer a framework for testing hypotheses about the existence of a long run cointegrating relationship between
 $y_{t}$
and
 $\boldsymbol{x}_{t}$
. Thus, the model allows for uncertainty about the dynamic properties of the regressors:
 $\boldsymbol{x}_{t}$
may be stationary, unit roots, or mutually cointegrated (see also Pesaran and Shin Reference Pesaran and Shin1998; Pesaran and Smith Reference Pesaran and Smith1998).Footnote
1
The authors derived the limiting distributions for the ECM
 $t$
- and Wald (
 $F$
-) statistics used to test the significance of lagged levels in an ECM for the two polar cases in which (a) all regressors are stationary and (b) all regressors are unit roots. The results are presented as critical value bounds for the null hypothesis of no long run cointegrating relationship. If the computed test statistic lies above or below the bounds, inference on the null is conclusive, regardless of the underlying dynamics, but if it lies between the bounds, the test is inconclusive because reliable inference depends on knowing the true dynamics of
 $\boldsymbol{x}_{t}$
.
Grant and Lebo (Reference Grant and Lebo2016) and Philips (Reference Philips2018) advocate for the PSS approach and the approach has been used by political scientists (Dickinson and Lebo Reference Dickinson and Lebo2007; Enns and Wlezien Reference Enns and Wlezien2017). Yet, the approach’s reliance on the assumption that the dependent variable is a unit root makes it inflexible. Indeed, Philips (Reference Philips2018) provides a flowchart for analysts (p. 233) where the first question is: “Is the dependent variable stationary?” and the two branches “yes” and “no” lead researchers toward solutions. But the third branch, “I am not sure”, does not exist in Philip’s diagram or in the time series analyst’s toolkit.
As we show below, uncertainty about the univariate dynamics of
 $y_{t}$
renders cointegration tests based either on the significance of lagged
 $y_{t}$
or the joint significance of lagged
 $y_{t}$
and lagged
 $\boldsymbol{x}_{t}$
uninformative. As PSS note, the alternative hypothesis for both tests is consistent with multiple types of long run behavior, including degenerate equilibria in which
 $y_{t}$
is stationary and independent of
 $\boldsymbol{x}_{t}$
. The problem occurs because the coefficient on lagged
 $y_{t}$
diverges from zero as
 $y_{t}$
departs from a unit root such that the null of no cointegration will be rejected with increasing frequency, even if
 $y_{t}$
is unrelated to
 $\boldsymbol{x}_{t}$
in the long run.
What, then, should analysts do when they are uncertain about the univariate properties of all of their data? We propose conducting inference based on the significance of the long run multiplier (LRM) relating each element of
 $\boldsymbol{x}_{t}$
to
 $y_{t}$
by applying a bounds hypothesis-testing framework to assess the existence of a LRR between
 $y_{t}$
and
 $\boldsymbol{x}_{t}$
. The use of critical bounds applied to the LRM
 $t$
-test allows a more flexible testing framework that accommodates analysts’ uncertainty in the pretesting phase and, as such, applies whether
 $y_{t}$
is
 $I(0)$
,
 $I(1)$
, or
 $I(d)$
and whether the elements of
 $\boldsymbol{x}_{t}$
are individually
 $I(0)$
,
 $I(1)$
,
 $I(d)$
, or cointegrated.
We begin by identifying the model and assumptions underlying our analysis. Next, we describe the null and alternative hypotheses and test statistics underlying the PSS analysis and explicate their limitations. We show that neither the
 $t$
-test nor the Wald test presented by PSS discriminate among a number of alternative long run behaviors.Footnote
2
We then propose an alternative approach that uses the LRM
 $t$
-test. We generate critical value bounds for the test under uncertainty about univariate dynamics. Finally, we demonstrate the utility of this approach as a test for LRRs in models of public policy mood and presidential success.
1 The Model and Assumptions
The data generating process and assumptions underlying our analysis are the same used by PSS. Briefly, we begin with a vector autoregression (VAR) in which each variable in the system
 $\boldsymbol{z}_{t}$
is a function of its own lag(s), current and lagged values of all other variables in the system, a constant, and a trend. We assume the highest order of integration of any of the component variables is one and that the error in the model is well behaved. We then express the VAR as a vector error correction model (VECM), which isolates the LRR of interest. We assume a set of variables,
 $\boldsymbol{x}_{t}$
, are weakly exogenous for the parameters in a conditional model of
 $y_{t}$
—the variable of interest—but these variables may be
 $I(0)$
,
 $I(1)$
, or cointegrated. This permits hypothesis testing based on estimation of the conditional ECM. In the next section we describe the hypothesis tests recommended by PSS and show these tests fail when one is uncertain whether
 $y_{t}$
is a unit root or stationary process.
Our DGP is a VAR of order
 $p$
(VAR(
 $p$
)) for
 $\{\boldsymbol{z}_{t}\}_{t=1}^{\infty }$
, a
 $(k+1)$
-vector process. Adopting the notation in PSS, we write the model using lag operator notation as follows:
 $$\begin{eqnarray}\unicode[STIX]{x1D731}(L)(\boldsymbol{z}_{t}-\unicode[STIX]{x1D741}-\unicode[STIX]{x1D738}t)=\unicode[STIX]{x1D750}_{t},\end{eqnarray}$$
where
 $\unicode[STIX]{x1D741}$
and
 $\unicode[STIX]{x1D738}$
are unknown
 $(k+1)$
-vectors of intercept and trend coefficients and
 $\unicode[STIX]{x1D731}(L)$
is a
 $(k+1,k+1)$
matrix lag polynomial equal to
 $\boldsymbol{I}_{k+1}-\sum _{i=1}^{p}\unicode[STIX]{x1D731}_{i}L^{i}$
with
 $\{\unicode[STIX]{x1D6F7}_{i}\}_{i=1}^{p}$
(
 $k+1,k+1$
) matrices of unknown coefficients. All variables are at most
 $I(1)$
(PSS Assumption 1)Footnote
3
and the vector error process
 $\{\unicode[STIX]{x1D750}_{t}\}_{t=1}^{\infty }$
is
 $N(\mathbf{0},\unicode[STIX]{x1D734})$
, with
 $\unicode[STIX]{x1D734}$
positive definite, allowing for contemporaneous correlations in
 $\boldsymbol{z}_{t}$
(PSS Assumption 2).
We reparameterize the VAR as a VECM to isolate the long run levels relationships of interest among the variables. Setting
 $\unicode[STIX]{x1D731}(L)\equiv -\unicode[STIX]{x1D72B}L+\unicode[STIX]{x1D71E}(L)(1-L)$
, we can express the VAR as an equivalent VECM given by
 $$\begin{eqnarray}\unicode[STIX]{x1D6E5}\boldsymbol{z}_{t}=\boldsymbol{a}_{0}+\boldsymbol{a}_{\mathbf{1}}t+\unicode[STIX]{x1D72B}\boldsymbol{z}_{\boldsymbol{t}-\mathbf{1}}+\unicode[STIX]{x1D6F4}_{i=1}^{p-1}\unicode[STIX]{x1D71E}_{\!i}\unicode[STIX]{x1D6E5}\boldsymbol{z}_{t-i}+\unicode[STIX]{x1D750}_{t},\end{eqnarray}$$
where
 $\unicode[STIX]{x1D6E5}\equiv 1-L$
is the difference operator and the matrix of LRMs is given by
 $\unicode[STIX]{x1D72B}\equiv -(\boldsymbol{I}_{k+1}-\unicode[STIX]{x1D6F4}_{i=1}^{p}\unicode[STIX]{x1D731}_{i})$
.Footnote
4
 $^{,}$
Footnote
5
Equations (1) and (2) specify a system of equations such that each variable responds to all others. Often analysts are only interested in the long run behavior of a single variable,
 $y_{t}$
, in response to a set of exogenous regressors,
 $\boldsymbol{x}_{t}$
, which themselves may or may not be endogenously related. In order to estimate a single equation for
 $y_{t}$
, we assume the elements of
 $\boldsymbol{x}_{t}$
are weakly exogenous for the parameters of a conditional model for
 $y_{t}$
that also accounts for any contemporaneous correlations among
 $y_{t}$
and
 $\boldsymbol{x}_{t}$
. We partition
 $\boldsymbol{z}_{t}=(y_{t},\boldsymbol{x}_{\boldsymbol{t}}^{\prime })^{\prime }$
, the error, deterministic components, and coefficient matrices conformably and restrict the
 $k$
-vector of coefficients on lagged levels of
 $y_{t}$
in the equations for each
 $\boldsymbol{x}_{t}$
to be 0,
 $\unicode[STIX]{x1D745}_{xy}=0$
(PSS Assumption 3). This eliminates the possibility of feedback from
 $y_{t}$
to
 $\boldsymbol{x}_{t}$
and guarantees that any long run equilibrium involving
 $y_{t}$
is unique. The marginal model for
 $\boldsymbol{x}_{t}$
is thus given by
 $$\begin{eqnarray}\unicode[STIX]{x1D6E5}\boldsymbol{x}_{t}=\boldsymbol{a}_{x0}+\boldsymbol{a}_{x1}t+\unicode[STIX]{x1D72B}_{xx}\boldsymbol{x}_{t-1}+\unicode[STIX]{x1D6F4}_{i=1}^{p-1}\unicode[STIX]{x1D71E}_{xi}\unicode[STIX]{x1D6E5}\boldsymbol{z}_{t-i}+\unicode[STIX]{x1D750}_{xt}.\end{eqnarray}$$
After conditioning on any contemporaneous correlations in the errors of
 $y_{t}$
and
 $\boldsymbol{x}_{t}$
, we can specify—and test hypotheses using—an ECM for
 $y_{t}$
conditional on the
 $\boldsymbol{x}_{t}$
.Footnote
6
 $$\begin{eqnarray}\unicode[STIX]{x1D6E5}y_{t}=c_{0}+c_{1}t+\unicode[STIX]{x1D70B}_{yy}y_{t-1}+\unicode[STIX]{x1D745}_{yx.x}\boldsymbol{x}_{t-1}+\unicode[STIX]{x1D6F4}_{i=1}^{p-1}\unicode[STIX]{x1D74D}_{i}^{\prime }\unicode[STIX]{x1D6E5}\boldsymbol{z}_{t-i}+\unicode[STIX]{x1D74E}^{\prime }\unicode[STIX]{x1D6E5}\boldsymbol{x}_{t}+u_{t},\end{eqnarray}$$
where
 $\unicode[STIX]{x1D70B}_{yy}$
is the familiar error correction rate and
 $\unicode[STIX]{x1D745}_{yx.x}$
is the vector of coefficients that describe the net effect of
 $\boldsymbol{x}_{t}$
on
 $y_{t}$
after controlling for any LRR among
 $\boldsymbol{x}_{t}$
and any contemporaneous correlations in the errors.Footnote
7
More specifically,
 $\unicode[STIX]{x1D745}_{yx.x}\equiv \unicode[STIX]{x1D745}_{yx}-\unicode[STIX]{x1D74E}^{\prime }\unicode[STIX]{x1D72B}_{xx}$
where
 $\unicode[STIX]{x1D745}_{yx}$
is a vector that describes the direct effect of
 $\boldsymbol{x}_{t-1}$
on
 $y_{t}$
and
 $\unicode[STIX]{x1D74E}$
describes the contemporaneous correlations among the variables in the system:
 $\unicode[STIX]{x1D74E}=\text{cov}(e_{yt},e_{xt})/\text{var}(e_{xt})$
. If the errors are uncorrelated,
 $\unicode[STIX]{x1D74E}=0$
and
 $\unicode[STIX]{x1D745}_{yx.x}=\unicode[STIX]{x1D745}_{yx}$
.
 $\unicode[STIX]{x1D72B}_{xx}$
specifies the LRRs among the
 $\boldsymbol{x}_{t}$
.
Consistent with our uncertainty over the dynamics in
 $\boldsymbol{x}_{t}$
, we wish to allow the
 $\boldsymbol{x}_{t}$
to be
 $I(0)$
,
 $I(1)$
and not cointegrated, or
 $I(1)$
and cointegrated.
 $\unicode[STIX]{x1D72B}_{xx}$
, the long run coefficient matrix for
 $\boldsymbol{x}_{t}$
, may thus have rank
 $0\leqslant r_{x}\leqslant k$
(PSS Assumption 4). If
 $r_{x}=0$
, there are no cointegrating relationships and the
 $\boldsymbol{x}_{t}$
are purely
 $I(1)$
such that
 $\unicode[STIX]{x1D72B}_{xx}=0$
and
 $\unicode[STIX]{x1D745}_{yx.x}=\unicode[STIX]{x1D745}_{yx}$
. If
 $r_{x}=k$
(the number of independent variables in the system), the
 $\boldsymbol{x}_{t}$
are all
 $I(0)$
. If
 $0<r_{x}<k$
, then there are
 $r_{x}$
cointegrating relationships in
 $\boldsymbol{x}_{t}$
.
Given our assumptions, if there is a LRR between
 $y_{t}$
and
 $\boldsymbol{x}_{t}$
it is given by:
 $$\begin{eqnarray}\displaystyle LRR & = & \displaystyle \unicode[STIX]{x1D70B}_{yy}y_{t-1}+\unicode[STIX]{x1D745}_{yx.x}\boldsymbol{x}_{t-1}\end{eqnarray}$$
 $$\begin{eqnarray}\displaystyle & = & \displaystyle \unicode[STIX]{x1D70B}_{yy}y_{t-1}+(\unicode[STIX]{x1D745}_{yx}-\unicode[STIX]{x1D74E}^{\prime }\unicode[STIX]{x1D72B}_{xx})\boldsymbol{x}_{t-1}.\end{eqnarray}$$
Conversely, there is no LRR between
 $y_{t}$
and
 $\boldsymbol{x}_{t}$
only if both
 $\unicode[STIX]{x1D70B}_{yy}=0$
and
 $\unicode[STIX]{x1D745}_{yx.x}=\unicode[STIX]{x1D745}_{yx}-\unicode[STIX]{x1D753}^{\prime }\unicode[STIX]{x1D72B}_{xx}=\mathbf{0}^{\prime }$
for some
 $k$
-vector
 $\unicode[STIX]{x1D753}$
, in which case the ECM reduces to a model in first differences.Footnote
8
2 PSS Hypothesis Tests and their Limits
PSS proposed analysts test the null hypothesis of no (cointegrating) LRR between
 $y_{t}$
and
 $\boldsymbol{x}_{t}$
assuming
 $y_{t}$
is a unit root using a Wald (
 $F$
-) test, where
 $H_{0F}:\unicode[STIX]{x1D70B}_{yy}=\unicode[STIX]{x1D745}_{yx.x}=0$
. The alternative hypothesis is that either or both are nonzero:
 $H_{AF}:\unicode[STIX]{x1D70B}_{yy}\neq 0$
or
 $\unicode[STIX]{x1D745}_{yx.x}\neq 0$
or both. Critical values for the test are unavailable for an arbitrary mix of
 $I(0)$
and
 $I(1)$
regressors. However, two polar cases establish bounds for the
 $F$
-test. The lower bound is associated with
 $r_{x}=k$
, in which case the elements of
 $\boldsymbol{x}_{t}$
are
 $I(0)$
. The upper bound is associated with
 $r_{x}=0$
, in which case they are
 $I(1)$
and not cointegrated. Of course, the truth may lie between, in which case there is at least one cointegrating relationship among the elements of
 $\boldsymbol{x}_{t}$
.
To test for a long run cointegrating relationship, the analyst estimates the conditional ECM, computes the
 $F$
-statistic for the lagged level variables, and compares the result to the bounds.Footnote
9
If
 $F$
is below the lower bound, we cannot reject the null regardless of whether
 $\boldsymbol{x}_{t}\sim I(0)$
,
 $I(1)$
, or is cointegrated. If
 $F$
is greater than the upper bound, we can infer the existence of a LRR regardless of the dynamic properties of
 $\boldsymbol{x}_{t}$
. If
 $F$
is between the bounds, without knowing the dynamic properties of
 $\boldsymbol{x}_{t}$
, we cannot determine whether to reject or fail to reject. If we knew the elements of
 $\boldsymbol{x}_{t}$
were
 $I(0)$
, then we would reject the null. If we knew the elements of
 $\boldsymbol{x}_{t}$
to be
 $I(1)$
, we would fail to reject the null.
Rejection of the null hypothesis does not, however, guarantee a valid long run equilibrium.Footnote
10
The alternative hypothesis is consistent with four types of LRR. PSS describe two of these as degenerate: the LRR is either nonsensical or of a simpler class in which
 $y_{t}$
is independent of
 $\boldsymbol{x}_{t}$
. Degenerate equilibria occur when we reject the null hypothesis because either
 $\unicode[STIX]{x1D70B}_{yy}\neq 0$
or
 $\unicode[STIX]{x1D745}_{yx.x}\neq 0$
but not both; a nondegenerate relationship requires both
 $\unicode[STIX]{x1D70B}_{yy}\neq 0$
and
 $\unicode[STIX]{x1D745}_{yx.x}\neq 0$
. We describe each type of LRR permitted under the alternative hypothesis and present the possible relationships between
 $y_{t}$
and
 $\boldsymbol{x}_{t}$
in Table 1.


Alternatives
 $A_{1}$
and
 $A_{2}$
describe degenerate LRRs. Under
 $A_{1}$
,
 $\unicode[STIX]{x1D70B}_{yy}=0$
and
 $\unicode[STIX]{x1D745}_{yx.x}\neq 0$
and the LRR given in equation (6) reduces to
 $(\unicode[STIX]{x1D745}_{yx}-\unicode[STIX]{x1D74E}^{\prime }\unicode[STIX]{x1D72B}_{xx})\boldsymbol{x}_{t-1}$
. In this case,
 $y_{t}$
is a unit root process but not cointegrated with
 $\boldsymbol{x}_{t}$
. The
 $\boldsymbol{x}_{t}$
are either jointly cointegrated or all individually stationary and influence
 $\unicode[STIX]{x1D6E5}y_{t}$
only in the short run.Footnote
11
If
 $A_{2}$
holds,
 $\unicode[STIX]{x1D70B}_{yy}\neq 0$
and
 $\unicode[STIX]{x1D745}_{yx.x}=0$
and the LRR reduces to
 $\unicode[STIX]{x1D70B}_{yy}y_{t-1}$
. In this case,
 $y_{t}$
is stationary and independent of
 $\boldsymbol{x}_{t}$
in the long run, regardless of the dynamic properties of
 $\boldsymbol{x}_{t}$
. Changes in
 $\boldsymbol{x}_{t}$
may affect changes in
 $y_{t}$
in the short run but
 $y_{t}$
returns to its unconditional mean in the long run.
The remaining specifications characterize nondegenerate long run equilibria between
 $y_{t}$
and
 $\boldsymbol{x}_{t}$
that typically motivate our hypothesis tests. Both
 $\unicode[STIX]{x1D70B}_{yy}\neq 0$
and
 $\unicode[STIX]{x1D745}_{yx.x}\neq 0$
and the LRR is given by equation (6). Under alternative
 $A_{3a}$
,
 $y_{t}$
is a unit root process and cointegrated with
 $\boldsymbol{x}_{t}$
. Under alternative
 $A_{3b}$
, a second type of nondegenerate equilibrium holds in which
 $y_{t}$
is stationary and dependent on
 $\boldsymbol{x}_{t}$
. The
 $\boldsymbol{x}_{t}$
may be stationary or cointegrated but in either case their influence on
 $y_{t}$
is via a linear combination of the
 $\boldsymbol{x}_{t}$
that is stationary.Footnote
12
PSS propose using the familiar ECM test for cointegration,
 $H_{0t}:\unicode[STIX]{x1D70B}_{yy}=0$
, to arbitrate among a subset of the alternatives.Footnote
13
Like the
 $F$
-test, critical values for this
 $t$
-test depend on the nature of
 $\boldsymbol{x}_{t}$
and PSS derive bounds for this test as well. If we fail to reject the null, rejection of the
 $F$
-test implies
 $H_{A_{1},F}$
holds and the long run equilibrium is undefined. If we reject both null hypotheses, either
 $H_{A_{2},F}$
,
 $H_{A_{3a},F}$
or
 $H_{A_{3b},F}$
holds. We can only rule out
 $A_{2}$
and
 $A_{3b}$
when we are certain
 $y_{t}$
is
 $I(1)$
(as PSS assume). This presents a dilemma for the analyst who is uncertain of the dynamics of
 $y_{t}$
.
Researchers frequently use the ECM to test for the existence of LRRs, primarily relying on the test of the null
 $H_{0}:\unicode[STIX]{x1D70B}_{yy}=0$
and using either MacKinnon critical values (Banerjee et al.
Reference Banerjee, Dolado, Galbraith and Hendry1993; Ericsson and MacKinnon Reference Ericsson and MacKinnon2002; Lebo and Grant Reference Lebo and Grant2016) or the PSS critical values for inference (Dickinson and Lebo Reference Dickinson and Lebo2007; Philips Reference Philips2018). However, a researcher may make an incorrect judgment and
 $y_{t}$
may be truly stationary. If so, this presents problems for valid inference and one must appreciate the different types of long run behavior that may lead to rejection of the null. The above discussion makes clear that if both theory and univariate tests are inconclusive as to whether
 $y_{t}$
is
 $I(0)$
or
 $I(1)$
, it is a dangerous strategy to conclude a LRR exists between
 $y_{t}$
and
 $\boldsymbol{x}_{t}$
based on either the ECM test or the
 $F$
-test proposed by PSS.
3 The LRM Test
What should analysts do if they are uncertain whether
 $y_{t}$
is a stationary or unit root process and wish to draw inference about the existence of a valid LRR? We propose a test for the existence of a valid LRR between
 $y_{t}$
and
 $\boldsymbol{x}_{t}$
based on the LRM. To understand the appeal of the LRM, it is helpful to express the conditional ECM in equation (5) to isolate the LRR:
 $$\begin{eqnarray}\unicode[STIX]{x1D6E5}y_{t}=c_{0}+c_{1}t+\unicode[STIX]{x1D70B}_{yy}\left(y_{t-1}+\frac{\unicode[STIX]{x1D745}_{yx.x}}{\unicode[STIX]{x1D70B}_{yy}}\boldsymbol{x}_{t-1}\right)+\unicode[STIX]{x1D6F4}_{i=1}^{p-1}\unicode[STIX]{x1D74D}_{i}^{\prime }\unicode[STIX]{x1D6E5}\boldsymbol{z}_{t-i}+\unicode[STIX]{x1D74E}^{\prime }\unicode[STIX]{x1D6E5}\boldsymbol{x}_{t}+\unicode[STIX]{x1D707}_{t},\end{eqnarray}$$
where
 $(y_{t-1}+(\unicode[STIX]{x1D745}_{yx.x}/\unicode[STIX]{x1D70B}_{yy})\boldsymbol{x}_{t-1})$
gives the long run, and possibly cointegrating, relationship,
 $\unicode[STIX]{x1D70B}_{yy}$
gives the rate of return to equilibrium, and
 $\unicode[STIX]{x1D745}_{yx.x}/\unicode[STIX]{x1D70B}_{yy}$
is the LRM.
As we discussed above, a valid LRR requires both
 $\unicode[STIX]{x1D70B}_{yy}\neq$
and
 $\unicode[STIX]{x1D745}_{yx.x}\neq 0$
. This implies
 $\unicode[STIX]{x1D745}_{yx.x}/\unicode[STIX]{x1D70B}_{yy}$
must also be nonzero. In this case
 $\unicode[STIX]{x1D745}_{yx.x}/\unicode[STIX]{x1D70B}_{yy}$
describes the links between
 $\boldsymbol{x}_{t}$
and
 $y_{t}$
and
 $\unicode[STIX]{x1D70B}_{yy}$
tells us how this linkage drives change in
 $y_{t}$
. In contrast, if
 $\unicode[STIX]{x1D70B}_{yy}=0$
the equilibrium term drops out of the equation and
 $\unicode[STIX]{x1D745}_{yx.x}/\unicode[STIX]{x1D70B}_{yy}$
is undefined. If
 $\unicode[STIX]{x1D745}_{yx.x}=0$
, the LRMs are zero and
 $y_{t}$
is not a function of
 $\boldsymbol{x}_{t}$
. Thus, a nondegenerate, or valid, equilibrium relationship between
 $y_{t}$
and
 $\boldsymbol{x}_{t}$
requires the LRM to be nonzero. It follows immediately that inference on the existence of a valid LRR between
 $y_{t}$
and
 $\boldsymbol{x}_{t}$
can be made based on the hypothesis test
 $H_{0,LRM}:\unicode[STIX]{x1D745}_{yx.x}/\unicode[STIX]{x1D70B}_{yy}=0$
.Footnote
14
This is true whether
 $y_{t}$
is
 $I(0)$
or
 $I(1)$
. If
 $y_{t}$
is a unit root process, the only way
 $\unicode[STIX]{x1D70B}_{yy}$
can be nonzero is if
 $y_{t}$
is linked to
 $\boldsymbol{x}_{t}$
in the long run. In other words, it must be the case that
 $\unicode[STIX]{x1D745}_{yx.x}\neq 0$
and
 $\unicode[STIX]{x1D745}_{yx.x}/\unicode[STIX]{x1D70B}_{yy}\neq 0$
such that
 $y_{t}$
has a long run, cointegrating relationship with
 $\boldsymbol{x}_{t}$
. This is the logic underlying the ECM test for cointegration (Banerjee et al.
Reference Banerjee, Dolado, Galbraith and Hendry1993; Banerjee, Dolado, and Mestre Reference Banerjee, Dolado and Mestre1998; Ericsson and MacKinnon Reference Ericsson and MacKinnon2002). In the stationary case,
 $\unicode[STIX]{x1D70B}_{yy}$
is, by definition, nonzero:
 $y_{t}$
will always return to its mean in the long run, whether that mean is conditional on
 $\boldsymbol{x}_{t}$
or not. Only if
 $\unicode[STIX]{x1D745}_{yx.x}$
, and thus
 $\unicode[STIX]{x1D745}_{yx.x}/\unicode[STIX]{x1D70B}_{yy}\neq 0$
, will the long run value of
 $y_{t}$
be conditional on
 $\boldsymbol{x}_{t}$
.Footnote
15
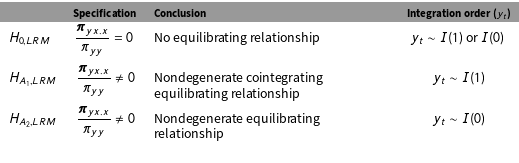
We present the null and alternative hypotheses for the LRM test in Table 2. If we cannot reject the null, then
 $y_{t}$
does not have a valid equilibrium with
 $\boldsymbol{x}_{t}$
, regardless of whether the data are
 $I(1)$
or
 $I(0)$
and whether the regressors are cointegrated. If we can reject the null, we infer a LRR between
 $y_{t}$
and
 $\boldsymbol{x}_{t}$
. We cannot, however, distinguish a long run cointegrating relationship,
 $H_{A_{1},LRM}$
, from a LRR between a set of stationary variables,
 $H_{A_{2},LRM}$
, using this test. Our contention is that this uncertainty is an inevitable—and appropriate—consequence of uncertainty in the pretesting phase. Perhaps analysts can appeal to theory to overcome this bind, but there are few persuasive theoretical arguments that make this effort in political science (for an example see Erikson, MacKuen, and Stimson Reference Erikson, MacKuen and Stimson2002).
The LRM test.
Note:
 $H_{0,LRM}$
is based on the Bewley instrumental variables regression given in equation (9).
The LRMs are not estimated directly in the ECM or the equivalent ADL. While we can calculate the LRMs from these models, the standard error is more problematic as there is no simple formula calculating the standard error of a ratio of coefficients. Various methods exist to approximate the variance of a quotient of items with known variances. One option is to apply the delta method. Alternatively, one can use instrumental variables to estimate the Bewley transformation of the model, which estimates the LRM and its standard error directly (Bewley Reference Bewley1979).Footnote 16 The Bewley transformation for the general case with a constant and trend is written as:
 $$\begin{eqnarray}y_{t}=\unicode[STIX]{x1D719}_{0}+\unicode[STIX]{x1D70F}t-\unicode[STIX]{x1D719}_{1}\unicode[STIX]{x1D6E5}y_{t}+\unicode[STIX]{x1D713}_{0}\boldsymbol{x}_{t}-\unicode[STIX]{x1D713}_{1}\unicode[STIX]{x1D6E5}\boldsymbol{x}_{t}+\unicode[STIX]{x1D707}_{t},\end{eqnarray}$$
where
 $\unicode[STIX]{x1D713}_{0}=-(\unicode[STIX]{x1D70B}_{yx.x}/\unicode[STIX]{x1D70B}_{yy})=LRM$
,
 $\unicode[STIX]{x1D719}_{0}=-(c_{0}/\unicode[STIX]{x1D70B}_{yy})$
,
 $\unicode[STIX]{x1D70F}=c_{1}/\unicode[STIX]{x1D70B}_{yy}$
,
 $\unicode[STIX]{x1D719}_{1}=-(\unicode[STIX]{x1D70B}_{yy}+1/\unicode[STIX]{x1D70B}_{yy})$
,
 $\unicode[STIX]{x1D713}_{1}=\unicode[STIX]{x1D70B}_{yx}$
, and
 $\unicode[STIX]{x1D707}=-(e/\unicode[STIX]{x1D70B}_{yy})$
in the conditional ECM. A constant, trend,
 $\boldsymbol{x}_{t}$
,
 $\boldsymbol{x}_{t-1}$
, and
 $y_{t-1}$
are used as instruments to estimate the model (Banerjee et al.
Reference Banerjee, Dolado, Galbraith and Hendry1993; De Boef and Keele Reference De Boef and Keele2008).
Because the LRM is a ratio of coefficients and the coefficients are a function of time series with potentially varying dynamic behavior, the form of the distribution of the LRM
 $t$
-test is not obvious. If
 $y_{t}$
is a unit root, it is likely to have a nonstandard distribution, like the
 $t$
and
 $F$
-tests evaluated by PSS. It is also unclear how the sample size, presence or absence of deterministic components, or number of regressors will affect the distribution.Footnote
17
In the next section we calculate the appropriate critical values for the LRM test, allowing each of these features of the data and model to vary, and we offer a bounds testing framework for inference.
Before doing so, we summarize three advantages of focusing on the significance of the LRM as a test for a valid long run equilibrium. First, inferences do not depend on whether any given time series is
 $I(0)$
or
 $I(1)$
. Second, the LRM test has a specific advantage over the ECM test for cointegration when we know
 $y_{t}$
is
 $I(1)$
and we have multiple independent variables in the model. While rejecting the null
 $H_{0}:\unicode[STIX]{x1D70B}_{yy}=0$
implies
 $y_{t}$
is cointegrated with a vector of
 $\boldsymbol{x}_{t}$
, it does not tell us which element(s) of
 $\boldsymbol{x}_{t}$
contribute to the cointegrating relationship. The LRM test allows us to draw inferences about whether there is a LRR between
 $y_{t}$
and any element of
 $\boldsymbol{x}_{t}$
. Third, rejection of the null implies a nondegenerate LRR between
 $y_{t}$
and
 $\boldsymbol{x}_{t}$
.
4 The Distribution of the LRM
 $t$
-Test

We compute the distribution of the LRM test by estimating the sampling distribution of the LRM test statistic in the Bewley IV regression given in equation (9) under the true null hypothesis that there is no LRR between
 $y_{t}$
and
 $\boldsymbol{x}_{t}$
(
 $\unicode[STIX]{x1D745}_{yx.x}/\unicode[STIX]{x1D70B}_{yy}=0$
) under a range of conditions.
4.1 The Importance of Autocorrelation and Existence of Bounds
Our first set of stochastic simulations demonstrates the sensitivity of the test’s behavior to the strength of autocorrelation in the data and to sample size. We generate critical values for the LRM
 $t$
-test for varying degrees of autocorrelation in
 $y_{t}$
and a single
 $x_{t}$
for sample sizes of 75 and 1000. The smaller sample size is common in applied work while the larger sample size produces critical values that approximate the asymptotic distribution. We generate two independent autoregressive processes,
 $y_{t}=\unicode[STIX]{x1D70C}_{y}y_{t-1}+e_{yt}$
and
 $x_{t}=\unicode[STIX]{x1D70C}_{x}x_{t-1}+e_{xt}$
with the errors drawn from independent standard normal distributions. We vary the values of
 $\unicode[STIX]{x1D70C}_{y}$
and
 $\unicode[STIX]{x1D70C}_{x}$
from 0 to 0.90 in increments of 0.10 and from 0.90 to 1.0 in increments of 0.01. For each combination of
 $\unicode[STIX]{x1D70C}_{y}$
and
 $\unicode[STIX]{x1D70C}_{x}$
, we simulate the sampling distribution of the LRM
 $t$
-statistic using 50,000 replications. The LRM
 $t$
-value is estimated as the
 $t$
-value on
 $x_{t}$
in the Bewley ECM, equation (9), in a model with an unrestricted constant and no trend. Figure 1 presents the simulated critical values associated with the 97.5 percentile of the distribution for values of
 $\unicode[STIX]{x1D70C}_{x}$
as
 $\unicode[STIX]{x1D70C}_{y}$
varies for both sample sizes.Footnote
18
Simulated critical values for the LRM
 $t$
-test (95th percentile). Note: Critical values are computed via stochastic simulations using 50,000 replications for the LRM
 $t$
-statistic in the Bewley instrumental variables regression in equation (9). The time series
 $y_{t}$
and
 $x_{t}$
are generated from:
 $y_{t}=\unicode[STIX]{x1D70C}_{y}y_{t-1}+e_{yt}$
and
 $x_{t}=\unicode[STIX]{x1D70C}_{x}x_{t-1}+e_{xt}$
where the errors are drawn from independent standard normal distributions.
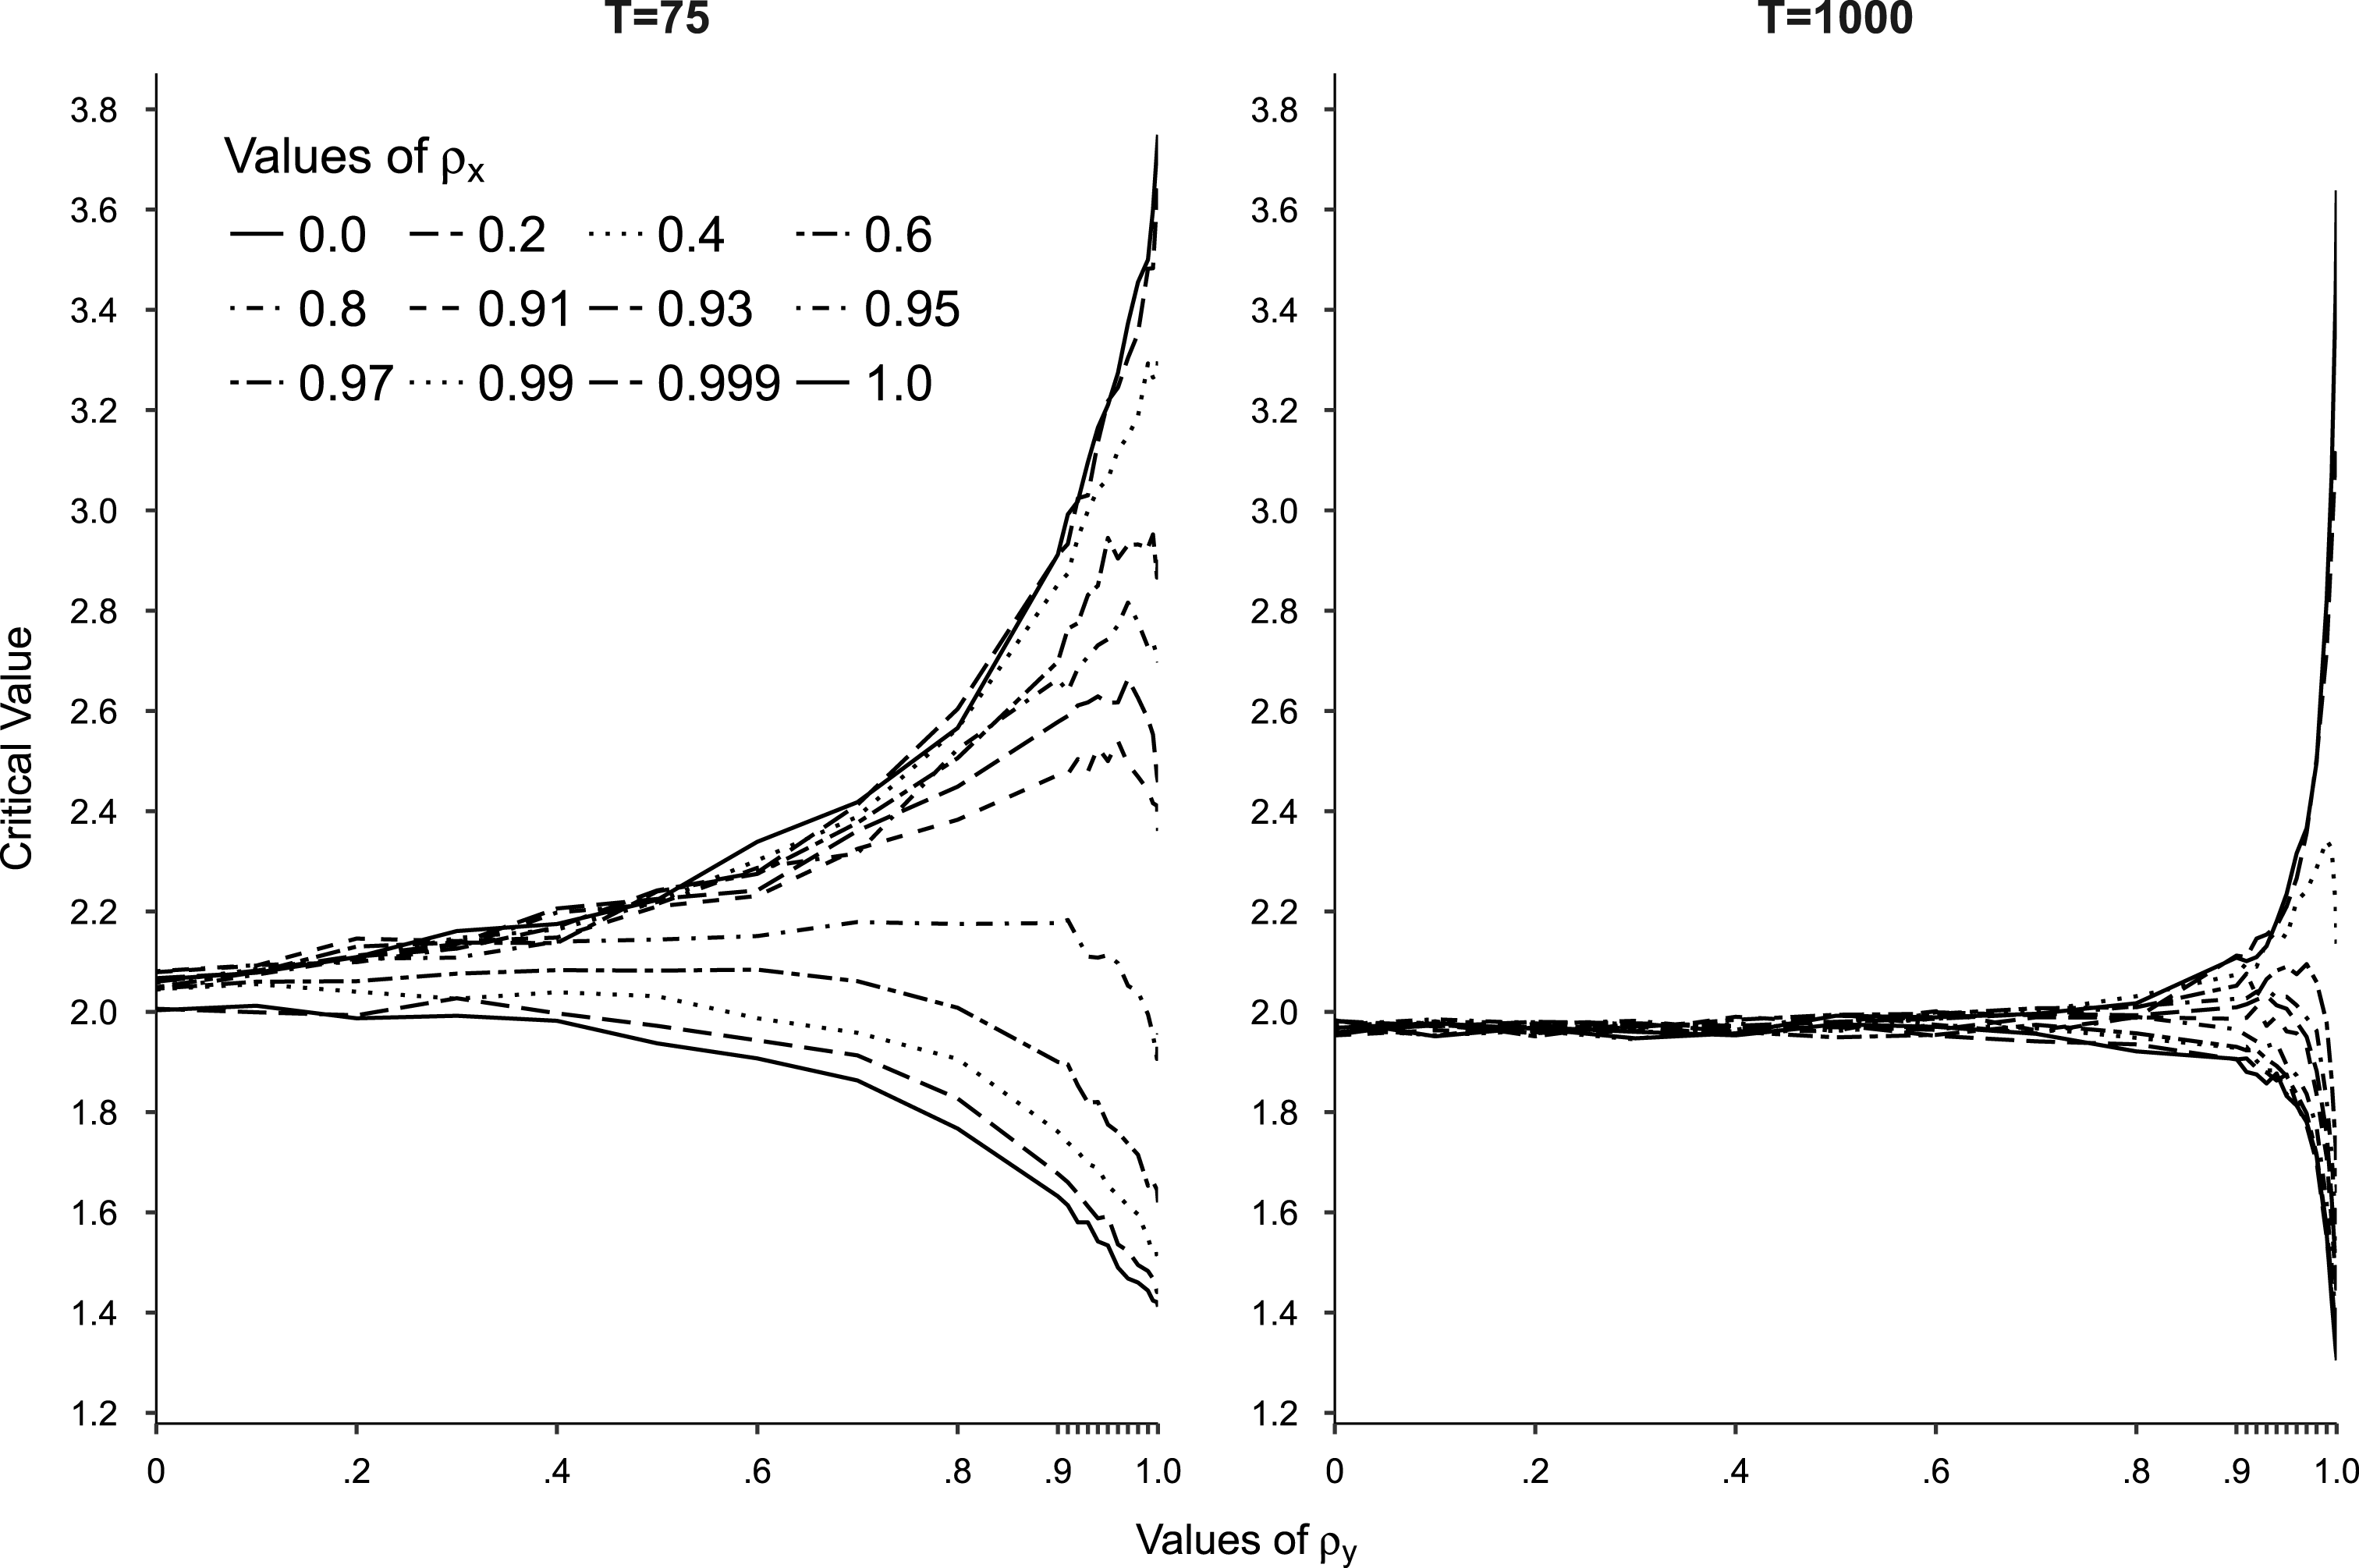
We draw three conclusions from our results. First, critical values are approximately standard normal for both sample sizes when
 $y_{t}$
is white noise, regardless of the dynamics in
 $x_{t}$
. However, as
 $y_{t}$
becomes more autoregressive, the appropriate critical values fan out based on the degree of autocorrelation in
 $x_{t}$
: for smaller
 $\unicode[STIX]{x1D70C}_{x}$
they are closer to zero and for larger
 $\unicode[STIX]{x1D70C}_{x}$
they are farther from zero than standard normal critical values.Footnote
19
Second, patterns are the same in both panels of the figure, although the range of autocorrelation for which critical values depart from standard normal is smaller for
 $T=1000$
. In fact, the range of autocorrelation in
 $y_{t}$
for which standard critical values are appropriate can be quite small when sample sizes take on values typical in applied work, suggesting the possibility that our confidence in some published findings regarding the significance of the LRM may be overstated. Third, the results establish lower and upper bounds that are similar regardless of sample size, about 1.30 and 3.65, respectively. If the LRM
 $t$
-statistic is greater than about 3.65, we can infer a LRR between
 $y_{t}$
and
 $x_{t}$
. If it is less than about 1.30 we can infer the absence of a LRR. For
 $t$
-statistics within the bounds, we need to know sample size and degree of autocorrelation in each series to draw an inference. Next, we assess how these bounds behave as more independent variables are added to the model, as the dynamic behaviors of
 $y_{t}$
and
 $\boldsymbol{x}_{t}$
vary, and as the specification of deterministic components varies.
4.2 The Conditions That Set The Bounds
Critical values could be calculated for the LRM
 $t$
-statistic if we knew the dynamic properties of the data, but this information is not available in applied settings. We can, however, establish the lowest and highest critical values associated with the LRM
 $t$
-statistic under a number of conditions. Table 3 shows quantiles for the empirical distributions of the ECM
 $t$
-tests estimated from a model with three independent variables (
 $k=3$
) and a constant. The rows of the table give the possible permutations of
 $I(0)$
and
 $I(1)$
variables ranging from the case where all the variables are independent white noise processes, to the case where all the variables are independent unit roots. We show the 2.5th and 97.5th percentiles for each LRM
 $t$
-test for each DGP. We simulated the sampling distributions using 100,000 replications of
 $T=1000$
.
The empirical distribution of the ECM
 $t$
-test and simulated critical values for the LRM
 $t$
-test: identifying the bounds conditions.

Note: Critical values are computed via stochastic simulations using 100,000 replications of
 $T=1000$
for the LRM
 $t$
-statistic in the Bewley instrumental variables regression in equation (9). A constant
 $\boldsymbol{x}_{t}$
,
 $\boldsymbol{x}_{t-1}$
, and
 $y_{t-1}$
are used as instruments. The time series
 $y_{t}$
and
 $x_{t}$
are generated from:
 $y_{t}=\unicode[STIX]{x1D70C}_{y}y_{t-1}+e_{yt}$
and
 $x_{i,t}=\unicode[STIX]{x1D70C}_{x_{i}}x_{i,t-1}+e_{x_{i},t}$
for
 $i=1,2,3$
, where the errors are drawn from independent standard normal distributions.
The first column shows the percentiles for the
 $t$
-statistic on
 $\unicode[STIX]{x1D70B}_{yy}$
, the error correction rate. The percentiles for the
 $t$
-statistics in the top half provide empirical estimates of the
 $t$
-test on
 $\unicode[STIX]{x1D70B}_{yy}$
when
 $\unicode[STIX]{x1D70C}_{y}=0$
. The null hypothesis is false in these cases:
 $\unicode[STIX]{x1D70B}_{yy}\neq 0$
. As such, the magnitudes of the observed
 $t$
-statistics are large. The simulated critical values reported in the bottom half of the table correspond to those reported by PSS for the ECM
 $t$
-test under the true null
 $\unicode[STIX]{x1D70B}_{yy}=0$
when
 $\unicode[STIX]{x1D70C}_{y}=1$
. Our bounds (
 $-3.12$
and
 $-4.01$
) are approximately equal to the bounds reported by PSS (
 $-3.13$
and
 $-4.05$
).Footnote
20
The lower bound for the
 $t$
-statistic on
 $\unicode[STIX]{x1D70B}_{yy}$
is set by the case where all the independent variables are white noise while the upper bound is set by the case where all the regressors are unit roots.
The next three columns show the behavior of the LRM
 $t$
-statistic. We make four observations. First, the empirical distributions of the LRM
 $t$
-statistics are (roughly) symmetric. Second, as in Figure 1, when
 $\unicode[STIX]{x1D70C}_{y}=0$
the critical values correspond to the standard
 $t$
-distribution, regardless of the dynamics in
 $\boldsymbol{x}_{t}$
. Third, the critical values are nonstandard for cases where
 $\unicode[STIX]{x1D70C}_{y}=1$
. Finally, the shapes of these nonstandard distributions change with the number of
 $I(1)$
variables in the model. We can use these results to determine the values of the LRM
 $t$
-statistic that establish a lower bound below which we fail to reject the null and an upper bound beyond which we can reject the null. These bounds can be applied in the absence of knowledge of the autoregressive properties of both
 $\boldsymbol{x}_{t}$
and
 $y_{t}$
.
The simulated bounds for the LRM
 $t$
-statistics are set under different conditions than those for the
 $t$
- and
 $F$
-tests reported by PSS. The lower bound for the LRM test is similarly set by the case where all the independent variables are white noise and
 $y_{t}$
is
 $I(1)$
, but the upper bound is set by the case where
 $y_{t}$
is
 $I(1)$
and exactly one independent variable is
 $I(1)$
. For example, in the case where
 $\unicode[STIX]{x1D70C}_{x1}=\unicode[STIX]{x1D70C}_{x2}=0$
and
 $\unicode[STIX]{x1D70C}_{x3}=\unicode[STIX]{x1D70C}_{y}=1$
, the
 $t$
-statistics for
 $x_{1}$
and
 $x_{2}$
are (roughly) equal at 1.38. The
 $t$
-statistic for
 $x_{3}$
is much higher (3.70). This same pattern exists regardless of which element of
 $\boldsymbol{x}_{t}$
is the unit root process. Critical values for all other
 $t$
-statistics, including the standard
 $t$
-statistics in the top half of the table, fall between these bounds.
Why is the upper bound for the LRM test different from the test statistics considered by PSS? Recall that the LRM is a ratio. The variance of a ratio may be approximated by
 $$\begin{eqnarray}\frac{a}{b}=\frac{1}{b^{2}}\text{Var}(a)+\frac{a^{2}}{b^{2}}\text{Var}(b)-2\frac{a}{b^{3}}\text{Cov}(a,b).\end{eqnarray}$$
The first quantity in equation (10),
 $(1/b^{2})\text{Var}(a)$
, shows that the variance of a ratio increases with the variance of the numerator, here the coefficient on
 $x_{t}$
. Spurious correlations among multiple
 $I(1)$
independent variables increase the variance of the associated LRM in the same way correlation among the independent variables in a regression model increases the variances of the estimated parameters for those variables. This spurious correlation in
 $\boldsymbol{x}_{t}$
does not affect the ECM
 $t$
-statistic, which is not a function of the variance of
 $a$
or the covariance of
 $a$
and
 $b$
in equation (10). Thus, the largest LRM
 $t$
-statistic will occur when there is exactly one unit root in
 $\boldsymbol{x}_{t}$
.Footnote
21
Table 4 shows how the bounds for the LRM
 $t$
-statistic change with
 $T$
and
 $k$
. The number of independent variables increases from 1 to 4 along the vertical dimension of the table. The sample size increases from 75 to 150 to 1000 along the horizontal dimension. We simulated the sampling distributions of the
 $t$
-statistics using 100,000 replications of each sample size.
Upper and lower bounds for the LRM
 $t$
-test by
 $k$
and
 $T$
.

Note: Critical values are computed via stochastic simulations using 100,000 replications for the LRM
 $t$
-statistic in the Bewley instrumental variables regression in equation (9). A constant
 $x_{t}$
,
 $x_{t-1}$
, and
 $y_{t-1}$
are used as instruments. The time series
 $y_{t}$
and
 $x_{t}$
are generated from:
 $y_{t}=\unicode[STIX]{x1D70C}_{y}y_{t-1}+e_{yt}$
and
 $x_{i,t}=\unicode[STIX]{x1D70C}_{x_{i}}x_{i,t-1}+e_{x_{i},t}$
for
 $i=1,2,3,4$
, where the errors are drawn from independent standard normal distributions.
The bounds are similar across conditions in Table 4, but with some notable patterns. The critical value of the LRM
 $t$
-statistic associated with the lower bound is essentially the same as
 $k$
increases from 1 to 4, but it slowly declines as the sample size increases from 75 to 1000. The small values of the lower bound reflect the low probability of finding a relationship between a white noise variable and a random walk, a probability that declines slightly with
 $T$
. The upper bounds behave differently. No clear patterns emerge as the sample size changes, but the upper bounds decline gradually as the number of independent variables increases from 1 to 4.Footnote
22
The upper bounds for
 $T=75$
,
 $T=150$
, and
 $T=1000$
are 3.69, 3.69, and 3.65 when
 $k=1$
. These values fall to 3.61, 3.59, and 3.61 when
 $k=4$
.
These results suggest an inferential strategy in which the analyst estimates any completely specified dynamic regression, calculates the LRM, and obtains the
 $t$
-statistics for each using either the delta method or the Bewley IV regression. Next, the results are compared to the bounds. If the LRM
 $t$
-statistic falls below the upper bound, the null hypothesis cannot be rejected regardless of whether
 $y_{t}$
is
 $I(0)$
or
 $I(1)$
and regardless of the dynamic behavior of the regressors. If the LRM
 $t$
-statistic is above the upper bound, the analyst can reject the null hypothesis and infer a LRR, again regardless of the dynamics of
 $y_{t}$
or
 $\boldsymbol{x}_{t}$
. However, if the estimated statistic falls between the bounds, no conclusion can be drawn absent full knowledge of the dynamic properties of all the variables in the model.
Upper and lower bounds for the LRM
 $t$
-test by
 $k$
and
 $T$
and deterministic components.

Note: Critical values are computed via stochastic simulations using 100,000 replications for the LRM
 $t$
-statistic in the Bewley instrumental variables regression in equation (9). A constant
 $x_{t}$
,
 $x_{t-1}$
, and
 $y_{t-1}$
are used as instruments. The time series
 $y_{t}$
and
 $x_{t}$
are generated from:
 $y_{t}=c_{0}+c_{1}t+\unicode[STIX]{x1D70C}_{y}y_{t-1}+e_{yt}$
and
 $x_{i,t}=\unicode[STIX]{x1D70C}_{x_{i}}x_{i,t-1}+e_{x_{i},t}$
for
 $i=1,2,3,4$
, where the errors are drawn from independent standard normal distributions.
 $c_{0}$
denotes the constant and
 $c_{1}$
the trend. The constant in the DGP (
 $c_{0}$
) took values of 0 and 1.
4.3 The Effects of Deterministic Features of
$y$
on the Bounds

Changes in the deterministic components in the DGP are more consequential. The bounds presented in Table 4 were derived assuming a DGP for
 $y_{t}$
that contained neither a constant nor a trend (
 $c_{0}=c_{1}=0$
in equation (5)).Footnote
23
The results presented in this section show that the critical values associated with a 95% confidence interval for the LRM
 $t$
-test shift toward zero if the DGP for
 $y_{t}$
includes a nonzero constant, trend, or both, as long as the estimated model encompasses the DGP. Omitting a constant or trend from the model when it is a feature of the DGP produces misspecification bias and renders any tests of the null hypothesis (
 $H_{0}:LRM=0$
) meaningless. Further, excluding a constant, even when it is zero, produces biased estimates of the effects of the
 $\boldsymbol{x}_{t}$
on
 $y_{t}$
(Greene Reference Greene2017).
Table 5 presents bounds for the four cases in which the DGP includes (a) neither a constant nor a trend (
 $c_{0}=c_{1}=0$
, top left); (b) a constant but no trend (
 $c_{0}=1$
,
 $c_{1}=0$
, bottom left); (c) a trend but no constant (
 $c_{0}=0$
,
 $c_{1}=1$
, top right); and (d) both a constant and trend (
 $c_{0}=c_{1}=1$
, bottom right). The regression model used to estimate the values in the left column includes a constant. Those in the right column add a trend. For each DGP and regression model, we present the bounds for
 $k=\{1,2,3,4\}$
independent variables (along the vertical dimension) for sample sizes
 $T=\{75,150,1000\}$
(along the horizontal dimension). We present values for the 97.5th percentiles of the sampling distributions of the
 $t$
-statistics for the LRMs. The distributions are symmetric. As above, the lower bound for each model is set by the case where
 $y_{t}$
is
 $I(1)$
and each of the independent variables is white noise while the upper bound is set by the case where
 $y_{t}$
and exactly one independent variable are
 $I(1)$
.
The bounds presented in the upper left of Table 5 correspond to those presented in Table 4 and have been discussed in detail.Footnote
24
In all other cases, the bounds shift closer to zero, but maintain a similar width. The differences can be understood in terms of the spurious regression problem (Granger and Newbold Reference Granger and Newbold1974) where two uncorrelated unit roots appear related more frequently than chance would predict. The addition of a constant or a trend in the DGP for
 $y_{t}$
, e.g.,
 $c_{0}\neq 0$
and/or
 $c_{1}\neq 0$
, causes the trajectory of
 $y_{t}$
to diverge from the trajectory of
 $x_{t}$
, which contains neither a constant nor a trend. As a consequence, the dynamics of
 $y_{t}$
and
 $x_{t}$
will be more distinct than in the classic case, pulling the distribution of the
 $t$
-statistic, and the value of the bounds, toward zero. As a result, the upper bounds presented in Table 4 and the top left panel of Table 5, when neither
 $y_{t}$
nor
 $\boldsymbol{x}_{t}$
contain a constant or trend, give the limiting case. The results also suggest that the lower bound hits a floor. Once any deterministic component enters the DGP, the behaviors of
 $y_{t}$
and
 $\boldsymbol{x}_{t}$
are so different that
 $y_{t}$
will very seldom appear to be related to mean reverting
 $x_{t}$
variables.Footnote
25
The results presented in Tables 4 and 5 illustrate how the critical values associated with the bounds for the LRM
 $t$
-statistic change based on the dynamics of
 $y_{t}$
. One might conclude that the changing critical values complicate our proposed hypothesis-testing procedure, that we are giving up a complicated set of preestimation procedures in exchange for a set of complicated postestimation procedures. In the next section we show the results above simplify hypothesis testing, allowing analysts to avoid making tenuous assumptions about the DGP for
 $y_{t}$
.
5 Inference Using the LRM: A Bounds Approach
The critical values for the LRM
 $t$
-statistic change based on the dynamics of
 $y_{t}$
and
 $\boldsymbol{x}_{t}$
. If
 $y_{t}$
is white noise, standard critical values apply. If
 $y_{t}$
is a unit root, critical values for the LRM
 $t$
-statistic change based on the number of
 $I(1)$
independent variables. The critical values are closer to zero if all the independent variables are white noise, farther from zero when multiple independent variables are
 $I(1)$
, and even farther from zero when exactly one the independent variables is
 $I(1)$
. The critical values change further based on the deterministic features of the DGP. The analyst must know all of this information to select the correct set of critical values. This would seem to leave the analyst at an impasse. None of this information can be known. The solution to this problem is to accept uncertainty associated with the features of
 $\boldsymbol{x}_{t}$
and
 $y_{t}$
and use a hypothesis-testing procedure that acknowledges this uncertainty.
We propose a general bounds testing procedure to accommodate dynamic uncertainty. The critical values furthest from 0 in Table 5 occur in the cases where neither
 $\boldsymbol{x}_{t}$
nor
 $y_{t}$
contain a constant or a trend (
 $a_{0}=a_{1}=0$
). These are the cases where the series are most similar and that set the upper bounds for the procedure. The critical values closest to zero in Table 5 occur in the cases where
 $y_{t}$
contains a trend (
 $c_{1}\neq 0$
), constant (
 $c_{0}\neq 0$
), or trend and constant (
 $c_{0}\neq 0$
and
 $c_{1}\neq 0$
). These cases set the lower bounds for the procedure. In practical terms, the change in the lower bound is unimportant for the analyst. Whether the test statistic falls within the bounds or below the lower bound, one fails to reject the null hypothesis. The only case where one can reject the null hypothesis while accounting for the uncertainty inherent in the classification of time series, is the case where the calculated test statistic falls beyond the upper bound. Thus, the upper limit of the bounds is set by the DGP with no trend and no constant and the lower bound is set by any of the DGPs that include deterministics. These combined bounds are presented in Table 6.
Bounds given uncertainty about deterministic features of the DGP.

Note: Critical values are computed via stochastic simulations using 100,000 replications for the LRM
 $t$
-statistic in the Bewley instrumental variables regression in equation (9). A constant
 $x_{t}$
,
 $x_{t-1}$
, and
 $y_{t-1}$
are used as instruments. The time series
 $y_{t}$
and
 $x_{t}$
are generated from:
 $y_{t}=\unicode[STIX]{x1D70C}_{y}y_{t-1}+e_{yt}$
and
 $x_{i,t}=\unicode[STIX]{x1D70C}_{x_{i}}x_{i,t-1}+e_{x_{i},t}$
for
 $i=1,2,3,4$
, where the errors are drawn from independent standard normal distributions.
The bounds presented in Table 6 facilitate every type of analytical uncertainty that typically vex time series analysts. One does not need to know whether a series is a stationary or unit root process. One does not need to know whether a series is characterized as a random walk, a random walk with drift, or a random walk with trend and drift. These bounds allow analysts to focus on the theoretical questions at the heart of political analysis, the existence of LRRs.
Applying the bounds is simple. The analyst must make a decision about whether to include a trend in the regression model. This can occur as part of the typical general-to-specific modeling procedure that should govern dynamic specification (Hendry Reference Hendry1995). The analyst includes a trend in the first model. If the trend is not significant, the trend can be removed. If the analyst is uncertain, the trend can be left in the model. Including the trend in the regression model when the trend is not part of the DGP does not affect the bounds. The second step is the estimation of the Bewley regression or application of the delta method to the estimated model. The
 $t$
-statistics for the estimated LRMs can be compared to the bounds presented in Table 6. This allows for inferences about the LRRs between the outcome and the independent variables that recognize the analyst’s uncertainty about the dynamics of the data.
The bounds procedure comes at a cost: an area of indeterminacy. There is a real possibility analysts will find themselves in a situation where they cannot reach a definitive conclusion. This may seem like a major shortcoming of the procedure. But the uncertainty associated with the dynamic properties of the variables has always affected applied time series analysis. The benefit of the bounds procedure is that this uncertainty is reflected in the hypothesis test. In the next section we demonstrate the utility of our proposed bounds procedure using data from previously published work.
6 Applications
We demonstrate our approach using two examples. In the first example we analyze the dynamics of public policy mood in the United States and in the second we look at explanations of presidential success in Congress.
Public policy mood is conceptualized as the overall predisposition among the public for an activist government role in solving society’s problems (Stimson Reference Stimson1991, Reference Stimson1998). It is measured from thousands of survey questions asking about preferences for more or less government in the domain of social policy. Measures of policy mood have been developed for a multitude of countries, and efforts to explain the dynamics of policy mood have proliferated to countries as diverse as Britain (Bartle, Dellepiane-Avellaneda, and Stimson Reference Bartle, Dellepiane-Avellaneda and Stimson2011; Green and Jennings Reference Green and Jennings2012), France (Stimson, Tiberj, and Thiébaut Reference Stimson, Tiberj and Thiébaut2010; Stimson, Thiebaut, and Tiberj Reference Stimson, Thiebaut and Tiberj2012; Brouard and Guinaudeau Reference Brouard and Guinaudeau2015), Mexico (Baker Reference Baker, Dominguez, Greene, Lawson and Moreno2015), Spain (Bartle, Bosch, and Orriols Reference Bartle, Bosch and Orriols2014), Portugal, Germany, and Japan.
Durr (Reference Durr1992) was the first to elucidate a theory to explain the dynamics of public policy mood and model its behavior in the United States. He argued that economic expectations and policy output exhibit long run equilibrium relationships with policy mood. According to Durr, perceptions of economic security pave the way for the implementation of a more expensive liberal domestic policy agenda “by fostering a willingness among the public to pay for such policies” (Durr Reference Durr1992, 159). His analysis (and others) also recognizes the “thermostatic” nature of policy preferences: the more (less) spending on domestic policy, the less (more) Americans demand it (Wlezien Reference Wlezien1995). Since Durr’s seminal analysis, many others have extended his work (Erikson, MacKuen, and Stimson Reference Erikson, MacKuen and Stimson2002; Enns and Kellstedt Reference Enns and Kellstedt2008; Ellis and Faricy Reference Ellis and Faricy2011; Ferguson, Kellstedt, and Linn Reference Ferguson, Kellstedt and Linn2013; Owen and Quinn Reference Owen and Quinn2016). Here we reanalyze Ferguson, Kellstedt, and Linn (Reference Ferguson, Kellstedt and Linn2013)’s replication and extension of Durr (Reference Durr1992) and Erikson, MacKuen, and Stimson (Reference Erikson, MacKuen and Stimson2002). We focus on their model of mood as a function of inflation, unemployment, and policy outcomes from 1968 (second quarter) through 2010.Footnote 26
Policy mood has been treated as a unit root (Durr Reference Durr1993) and as a stationary time series (Erikson, MacKuen, and Stimson Reference Erikson, MacKuen and Stimson2002; Ferguson, Kellstedt, and Linn Reference Ferguson, Kellstedt and Linn2013), with some noting that “mood potentially has a unit root” (Owen and Quinn Reference Owen and Quinn2016, p. 107) and others omitting any discussion of the question (Ellis and Faricy Reference Ellis and Faricy2011). Grant and Lebo (Reference Grant and Lebo2016) note that, if policy mood is a unit root, it is a bounded unit root because it has upper and lower limits (Cavaliere and Xu Reference Cavaliere and Xu2014). The nature of the dynamics of the public policy mood time series is not obvious from the usual battery of statistical tests. In Table 7 we present the evidence on this score.
Unit root and stationary tests: public policy mood, public policy outcomes, unemployment rate, and inflation: second quarter 1968 through the fourth quarter 2010 (
 $T=168$
).

Note: Shown are (augmented) Dickey–Fuller (Dickey and Fuller Reference Dickey and Fuller1979) test results for the null hypothesis that the series is a unit root (
 $\unicode[STIX]{x1D70F}$
) possibly with drift (
 $\unicode[STIX]{x1D70F}_{\unicode[STIX]{x1D707}}$
) and trend (
 $\unicode[STIX]{x1D70F}_{\unicode[STIX]{x1D70F}}$
). Also reported are tests of the null hypothesis that the constant, trend, and lagged dependent variable are jointly zero (
 $\unicode[STIX]{x1D719}_{2}$
), that the trend and lagged dependent variable are jointly zero (
 $\unicode[STIX]{x1D719}_{3}$
), and that the constant and lagged dependent variable are zero (
 $\unicode[STIX]{x1D719}_{1}$
). The lag length for the test was selected using the AIC (maximum of 12 lags). The KPSS (Kwiatkowski et al.
Reference Kwiatkowski, Phillips, Schmidt and Shin1992) test is of the null hypothesis that the series is stationary around a trend (
 $\unicode[STIX]{x1D70F}$
) or a mean (
 $\unicode[STIX]{x1D707}$
). We present test results for both a long and short lag truncation.
 $^{\ast \ast }p<0.01$
,
 $^{\ast }p<0.05$
,
 $^{+}p<0.10$
.
We first consider tests of the null hypothesis that mood contains a unit root. We use the Dickey–Fuller test and adopt an iterative testing procedure, assuming we are agnostic about whether the series contains a constant or trend under the null (Dickey and Fuller Reference Dickey and Fuller1979). We begin with the most general form of the test, including a constant and trend in the test regression.Footnote
27
Based on the
 $\unicode[STIX]{x1D719}_{2}$
and
 $\unicode[STIX]{x1D719}_{3}$
joint hypothesis tests, we conclude mood is not trending and so estimate a test regression omitting the trend. We then use
 $\unicode[STIX]{x1D719}_{1}$
to test for the inclusion of a constant in the test regression. Here the results are ambiguous. If we adopt a 0.05 significance level, we cannot reject the null, in which case we draw inferences from
 $\unicode[STIX]{x1D70F}$
and conclude mood is a unit root. But if we adopt a 0.10 significance level, inference relies on
 $\unicode[STIX]{x1D70F}_{\unicode[STIX]{x1D707}}$
and we thus conclude the series is not a unit root in favor of the alternative that it is stationary around a long run mean. The KPSS test does not help clarify our inference (Kwiatkowski et al.
Reference Kwiatkowski, Phillips, Schmidt and Shin1992). Assuming no trend, the test provides different inferences for each lag truncation parameter. Unsurprisingly, given the disparate treatment of the dynamic properties of mood in the literature, we find that inferences about the dynamic properties of mood vary based on the test used and the level of significance adopted by the analyst.
The dynamic properties of the independent variables also affect inference about LRRs. We report test results for inflation, unemployment, and policy outcomes in Table 7. Like mood, there is inconsistent evidence regarding the dynamic properties of policy outcomes. The Dickey–Fuller test suggests policy outcomes follow a simple random walk while the KPSS test (omitting a trend) provides evidence the series may be stationary. In contrast, test results for unemployment and inflation are unambiguous: unemployment is stationary around a long run mean, while inflation is a random walk with neither drift nor trend. Based on the evidence as a whole, we proceed by assuming none of the series contain a deterministic trend. We are otherwise uncertain about the dynamics of mood and policy outcomes, but are willing to conclude that unemployment is stationary and that inflation contains a unit root.
We begin our analysis of public policy mood under the assumption that it is weakly exogenousFootnote
28
such that we can estimate the conditional ECM where
 $m_{t}$
is policy mood,
 $v_{t}$
is an intervention for the Vietnam war,Footnote
29
 $\boldsymbol{x}_{t}=(\mathit{inflation},\mathit{unemployment},\mathit{policy})$
and
 $\boldsymbol{z}_{t}=(\mathit{mood},\mathit{Vietnam},\mathit{inflation},\mathit{unemployment},\mathit{policy})$
:
 $$\begin{eqnarray}\unicode[STIX]{x1D6E5}m_{t}=c_{0}+d_{1}v_{t}+\unicode[STIX]{x1D70B}_{mm}m_{t-1}+\unicode[STIX]{x1D745}_{\boldsymbol{m}\boldsymbol{x}\boldsymbol{\cdot }\boldsymbol{x}}\boldsymbol{x}_{t-1}+\unicode[STIX]{x1D6F4}_{i=1}^{p-1}\unicode[STIX]{x1D74D}_{i}\unicode[STIX]{x1D6E5}\boldsymbol{z}_{t-1}+\unicode[STIX]{x1D739}^{\prime }\unicode[STIX]{x1D6E5}\boldsymbol{x}_{t}+\unicode[STIX]{x1D707}_{t}.\end{eqnarray}$$
Estimates of the full model and each LRM are reported in Table 8.Footnote
30
Columns one and two contain estimates from the Generalized Error Correction Model (GECM), column three presents estimates of the LRM and their standard errors (equivalently estimated using the delta method and the Bewley IV regression), and column four presents the resulting test statistic. We focus our attention on the LRM test of the null hypothesis of no valid LRR. Using standard critical values, Ferguson et al. reject the null at the 0.05 level for policy outcomes, at the 0.10 level for inflation, and fail to reject the null for unemployment. However, given our uncertainty about the dynamic properties of mood and policy outcomes, the LRM statistics should be compared to the critical bounds given in the top left panel of Table 5 (
 $T=150$
: 1.35, 3.70). The resulting inference on unemployment (
 $t=-0.77$
) is unchanged, we cannot reject the null hypothesis, regardless of the dynamic properties of either mood or unemployment. The test statistic on the LRM for inflation (
 $t=1.96$
) and policy outcomes (
 $t=2.32$
) are well inside the bounds; unless we can be confident mood is a stationary series, we must admit our uncertainty about whether there is a LRR between either of these variables and mood. The ambiguity of these latter inferences is consistent with Ferguson et al.’s findings that Durr’s original results are not robust over time or across alternate measures of economic performance.
A model of domestic policy mood: second quarter 1968 through fourth quarter 2010.

Note: The LRM,
 $\text{LRM}_{SE}$
, and
 $t$
-LRM, are equivalently estimated using the delta method and the Bewley instrumental variables regression. Standard errors in parentheses. The
 $t$
-statistics are reported as “Below” when
 $|t|<1.35$
, “Between” when
 $1.35<|t|<3.70$
, and “Beyond” when
 $|t|>3.70$
.
Our second application examines presidential success in Congress, the percentage of times a president wins on votes on which he took a position in the House of Representatives each year, from 1953 to 2006 (Ornstein, Mann, and Malbin Reference Ornstein, Mann and Malbin2008). A long and old debate examines the importance of presidential approval to presidential success. For Neustadt (Reference Neustadt1960), the power of the president is the power to persuade, which might lead us to expect that political capital—in the form of public support—will lead to legislative accomplishments. Empirical studies have sometimes found support for the approval-success link (Bond and Fleisher Reference Bond and Fleisher1984; Ostrom, Jr and Simon Reference Ostrom and Simon1985). In The Strategic President, however, George Edwards argues that high approval levels might sometimes matter but that “presidential legislative leadership operates in an environment largely beyond the President’s control” (Edwards Reference Edwards2009, p. 150). Lebo and O’Geen (Reference Lebo and O’Geen2011) investigate several of these relationships including the effects of institutional factors, specifically, the partisan and ideological divisions within Congress. Tests of LRRs will help us identify the factors that shape the legacies of successes and failures of modern presidents.
It is unclear whether presidential success is a stationary or unit root process, however, and pretesting does not clear up our questions about univariate dynamics. Using the Dickey–Fuller tests we cannot reject the null hypothesis that presidential success is a unit root (with neither drift nor trend) but this result is contradicted by the KPSS
 $\unicode[STIX]{x1D707}$
test. Unless we rely on the short lag truncation parameter and an
 $\unicode[STIX]{x1D6FC}=0.10$
, we cannot reject the null that the series is stationary around a long run mean. The question of whether presidential success is a unit root or a stationary series over this period has no definitive answer.
Pretests for the explanatory variables indicate that we can reject the unit root null hypothesis for President’s party’s seat share in the House of Representatives and presidential approval. The KPSS test supports this inference for the president’s House share but for presidential approval it suggests we can reject the null of stationarity around a trend but not around a long run mean. Both the Dickey–Fuller and KPSS test results for the conditional party government index (CPG) (Aldrich, Berger, and Rohde Reference Aldrich, Berger, Rohde, Brady and McCubbins2002) suggest that the series is stationary. (See the Supplementary Appendix, Section 2 for full results.)
We incorporate the uncertainty in the pretesting stage in our tests of the null hypothesis of no valid LRR between presidential success and each of our three independent variables by comparing the LRM
 $t$
-statistics from a GECM of presidential success to the critical bounds given in the top left panel of Table 5 (
 $T=75$
: 1.40, 3.62). Columns one and two of Table 9 contain estimates from the GECM, column three presents estimates of the LRM and their standard errors (equivalently estimated using the delta method and the Bewley IV regression), and column four presents the resulting test statistic. Our results indicate that there is ambiguity as to the existence of a valid LRR between CPG and presidential success: the LRM
 $t$
-statistic for CPG (3.17) lies between the bounds. Without knowledge of the univariate properties of both series, we cannot draw a definitive conclusion. Inference on both presidential approval and the president’s House share are, however, conclusive. We cannot reject the null that a president’s approval is unrelated to his success in the House: the LRM
 $t$
-statistic (0.53) lies below the bounds. The test statistic for the president’s House share (5.38) is above both bounds and supports the existence of a valid LRR in which each point increase in the president’s party’s share of the House of Representatives increases his success rate by just over 2.3 points in the long run. Both conclusions hold regardless of what the dynamic properties of the individual series might be.
A model of presidential success, 1953–2006.

Note: The LRM,
 $\text{LRM}_{SE}$
, and
 $t$
-LRM, are equivalently estimated using the delta method and the Bewley instrumental variables regression. Standard errors in parentheses. The
 $t$
-statistics are reported as “Below” when
 $|t|<1.40$
, “Between” when
 $1.40<|t|<3.62$
and “Beyond” when
 $|t|>3.62$
.
These applications illustrate how applying a bounds hypothesis-testing framework to the LRM
 $t$
-test allows us to be transparent about how the uncertainty in pretesting translates into uncertainty about LRRs between time series. Is an area of indeterminacy in hypothesis testing unsatisfying? Yes, but it also reduces the risk of type I errors. A bounds framework also provides a firmer foundation for conclusions under the alternative hypothesis. Put differently, when the LRM
 $t$
-statistic is above the bounds, we can be more confident in the reliability of our findings, independent of any conclusions we might draw when pretesting.
7 Conclusion
Time series analysis typically begins with the analyst conducting pretests designed to determine the dynamic properties of one’s data. Such tests, one is led to believe, produce clear diagnoses that neatly dictate appropriate modeling and hypothesis-testing strategies. But classification is complicated. Most theories are ambiguous about the univariate properties of data, many political time series are short, and tests often produce conflicting results. When analysts are uncertain whether their time series are
 $I(0)$
,
 $I(1)$
—or some combination of both—the textbook strategies for inference regarding LRRs are untenable. If one can convincingly establish that the dependent variable contains a unit root, PSS’s hypothesis-testing framework is a workable alternative for inference that has become extremely popular in economics with over 8,000 citations on Google Scholar. But if, as in our examples above, the dynamic properties of the dependent variable are uncertain, this strategy, too, is untenable and we caution political scientists against the PSS tests.
Instead we offer the following suggestions for empirical researchers uncertain about the dynamics of their data. First, analysts should admit the uncertainty that hypothesis tests often conducted behind closed doors suggest. Second, analysts should adopt a modeling strategy and hypothesis-testing framework that account for that uncertainty. The LRM test combined with the bounds testing framework we recommend here generalizes and improves upon the strategy advocated by PSS by not insisting on certainty over the univariate characteristics of any of the variables in the model. Third, analysts should accept the possibility that inference will not permit a definitive conclusion on a hypothesis test. If analysts follow these guidelines we will be more transparent about uncertainty, reduce the false discovery rate, and increase the likelihood that significant findings are reproducible (Esarey Reference Esarey2017).Footnote 31
The procedure we advocate sacrifices the power of the test, increasing the risk of a type II error. The likelihood analysts find themselves in this position will depend on the strength of any LRR, the length of the time series, and the similarity in the dynamics of
 $y_{t}$
and
 $\boldsymbol{x}_{t}$
. This fact suggests that analysts may need larger samples to identify LRRs but it should also push analysts to develop stronger theories about both the univariate dynamics of their data and the nature of LRRs between them. This, in turn, might be used to justify the use of a particular test statistic and critical values. Out of sample forecasting presents another tool for assessing the performance of models when the LRM test statistic falls between the bounds.
In all, classifying political time series typically involves too much guesswork and time series analysts spend much too much time sparring over the nature of their data. Our work provides a way forward that recognizes that uncertainty. Further, when the LRM test statistic is above both bounds, one can reject the null hypothesis, learn about important dynamic relationships, and be believed. Taking uncertainty seriously and following a method that does not rely on tenuous conclusions from pretesting is the best way forward.
Supplementary material
For supplementary material accompanying this paper, please visit https://doi.org/10.1017/pan.2019.3.


















