The integrative perspective of developmental psychopathology suggests that intervention effects should be considered at a variety of levels of analysis, including neurobiological mechanisms. However, attention to neurobiological and physiological systems in prevention research has been quite limited. In the current paper, we present neurobiological data from a randomized trial of foster care as an intervention for previously institutionalized children in urban Bucharest, Romania. Of importance, the study involved the collection of electroencephalographic (EEG) measures alongside an extensive battery of other assessments. This study therefore presents a unique opportunity to examine questions concerning the effects of early experience on brain and behavioral development, as well as to investigate integrative relations between physiological and behavioral measures in the context of a preventative intervention beginning early in life.
Recent years have seen continued interest in the effects of institutional care on children's development. Particular emphasis has been placed on the extent to which cognitive and social deficits may be remediated by placement in family environments as well as issues related to sensitive periods in the timing of such interventions (Clarke & Clarke, Reference Clarke and Clarke2000; Gunnar, Reference Gunnar, Nelson and Luciana2001; MacLean, Reference MacLean2003; O'Connor, Reference O'Connor2003). A small number of research programs over the last two decades have attempted to study these questions from a scientifically rigorous standpoint. In one such program, Rutter and colleagues in the ERA Study Team (Rutter, Kreppner, & O'Connor, Reference Rutter, Kreppner and O'Connor2001; Rutter, O'Connor, & The ERA Study Team, Reference Rutter and O'Connor2004) monitored the development of children who were internationally adopted into the United Kingdom from Romania. The majority of children in these studies made intellectual and social gains after adoption, although gains tended to be larger for children who were adopted at earlier ages. At 4 and 6 years of age, children who had been adopted earlier had the highest scores in the sample on measures of cognitive status. In particular, children adopted before 6 months of age had better scores than children adopted between 6 and 24 months of age, with children adopted between 24 and 42 months performing the worst. A similar study followed a sample of children who had spent varying lengths of time (8–53 months) in a Romanian orphanage before being adopted into Canadian families, as well as a smaller sample who were adopted out of Romania in the first weeks of life, before they had experienced institutional life (Morison, Ames, & Chisholm, Reference Morison, Ames and Chisholm1995). Three years after adoption, earlier adoption was associated with increased IQ, with children adopted after 24 months of age having the lowest IQ levels in the study (Morison & Ellwood, Reference Morison and Ellwood2000). These studies support the more informal data of Dennis (Reference Dennis1973), suggesting that earlier adoption from institutional settings is associated with improved cognitive outcomes.
Although studies of postinstitutionalized, internationally adopted children have been extremely informative, they suffer from a number of weaknesses. These include selection effects, such that children who have been adopted into families may not be fully representative of children living in institutions, as well as problems with specifying the nature of the child's environment prior to adoption. In contrast, the Bucharest Early Intervention Project (BEIP; Zeanah et al., Reference Zeanah, Nelson, Fox, Smyke, Marshall and Parker2003) examined physical, social, cognitive, and biobehavioral characteristics of a group of children living in institutions in Bucharest, Romania. The study implemented a design in which institutionalized children were randomly assigned to one of two conditions: foster care that was provided by the BEIP infrastructure, or remaining under institutional care. The study was aimed at gathering scientific data to inform policy concerning the care of abandoned children (Nelson et al., Reference Nelson, Zeanah, Fox, Marshall, Smyke and Guthrie2007; Zeanah et al., Reference Zeanah, Nelson, Fox, Smyke, Marshall and Parker2003, Reference Zeanah, Koga, Simion, Stanescu, Tabacaru and Fox2006). As well as a variety of physical assessments, cognitive tests, social–emotional measures, and assessments of the caregiving environment, the BEIP also included noninvasive EEG measures to investigate the effects of early intervention on aspects of brain development (Zeanah et al., Reference Zeanah, Nelson, Fox, Smyke, Marshall and Parker2003). Although EEG responses are relatively diffuse and may not allow inferences about specific brain regions or networks, the EEG and associated techniques (e.g., event-related potentials [ERPs]) have played an important role in the study of early social, emotional, and cognitive development (Marshall & Fox, Reference Marshall, Fox and de Haan2007), in part because of their noninvasive nature, high temporal resolution, and suitability for use with infants and young children.
There has been much recent debate concerning the impact of early life experiences on brain development. Concerning the effects of institutionalization, differences in brain structure and function in postinstitutionalized, internationally adopted children have been observed by Chugani et al. (Reference Chugani, Behen, Muzik, Juhasz, Nagy and Chugani2001) using neuroimaging methods. In a small study of postinstitutionalized, internationally adopted children originally from Romania, glucose metabolism was lower in limbic and paralimbic regions of the brain among the previously institutionalized children compared to a comparison group of children who were never institutionalized. More recently, Eluvathingal et al. (Reference Eluvathingal, Chugani, Behen, Juhasz, Muzik and Maqbool2006) showed disruptions in brain connectivity in children who had experienced early institutionalization. The implication from these studies is that differences in central nervous system (CNS) activity that may have arisen as a function of early experiences in an institution may persist throughout childhood. However, although these studies examined the impact of early deprivation on concurrent neural functioning, they did not specifically examine the effects of intervention timing or duration. Other issues with these studies concern the relatively small sample sizes involved, the difficulty of finding an appropriate comparison/control group, and the extreme nature of the early deprivation that the children in these studies had experienced, which may not generalize to all studies of postinstitutionalized children.
As noted above, the integrative perspective of developmental psychopathology emphasizes the incorporation of neurobiological measures into intervention research. One key question concerns how such measures are framed in analytic models of early intervention. Neurobiological measures such as the magnitude of an electrophysiological signal (such as EEG power, EEG coherence, or ERP amplitude) may be framed in a variety of ways, including (a) as direct indices of intervention outcomes, (b) as moderators of other (e.g., behavioral or cognitive) indicators of intervention efficacy, (c) as potential mediators of the relation between intervention characteristics and intervention efficacy, with outcomes being measured by behavioral and cognitive outcomes. The first and simplest approach uses the physiological measure as a dependent variable or outcome measure. In this case, the impact of the intervention on the physiological measure is determined. Functional considerations are limited to a brief description of behavioral correlates of the dependent variable. The simplicity of this approach lends itself to common use, and indeed it is the primary strategy of the current paper. A second approach would be to view certain neurobiological variables as moderators of intervention effects. In this approach, neurobiological measures are treated as relatively constant “subject variables” that are inherent to the individual. Conceptually, this is perhaps a less favorable model, because it implies more limited plasticity in neurobiological systems than may be expected. However, it may find particular utility in the study of diathesis–stress models or gene–environment interactions, where a given characteristic or genotype may be associated with greater or lesser efficacy of an intervention or manipulation. The third perspective is that neurobiological processes may mediate the relation between intervention characteristics and other measured outcomes. From our perspective, this is a conceptually attractive approach, because it potentially allows a more complete understanding of intervention effects. Cicchetti and Curtis (Reference Cicchetti, Curtis, Cicchetti and Cohen2006) emphasized the utility of this approach in their extensive review of neurobiological processes in research on resilience. In contrast to the prior model of describing changes only in neurophysiological measures, this approach requires investigators to provide a high level of specificity in terms of the functional significance of their neurobiological measures. However, it should be noted that while it is easy to theorize about brain–behavior relations, this integration is a notoriously difficult endeavor when it comes to the domain of developmental psychopathology. Because many of the psychological constructs of interest in this field are complex and multifaceted, it is unlikely that robust relations are going to be found between individual neurobiological variables and behavioral measures that are meant to index such higher level constructs. Among others, Kagan (Reference Kagan2006) has emphasized that attempting to map psychological constructs onto patterns of brain activation is a problematic endeavor (see also Sarter, Berntson, & Cacioppo, Reference Sarter, Berntson and Cacioppo1996). This issue is also discussed in a more optimistic light by Pollak (Reference Pollak2005), who reviews the challenges and prospects for the inclusion of a neurobiological perspective in developmental psychopathology. He assesses conceptual problems in trying to link constructs such as attachment to neurobiological measures, but stresses that the affective neuroscience approach, rather than representing a negative form of biological reductionism, allows the addressing of “a new generation of compelling developmental questions” (p. 740).
Despite the large number of studies examining the impact of early intervention on cognitive and behavioral outcomes for infants and young children facing various psychosocial risk factors, few studies have examined the effect of early interventions on measures of CNS functioning. One exception is the study of Raine et al. (Reference Raine, Venables, Dalais, Mellingen, Reynolds and Mednick2001), which showed effects on the EEG of a 2-year long nursery intervention in young children. Two hundred Mauritian children aged 3–4 years were matched on autonomic reactivity and were then randomly assigned to one of two groups: an intervention group receiving full-day activities in a newly designed, structured, well-staffed setting, and a control group that did not receive the intervention. The control children were usually enrolled in low-quality care settings that were typical for most children on Mauritius at that time. At 11 years of age, the children were retested in a psychophysiological assessment that included the collection of EEG data. At rest, the intervention group had significantly lower delta and theta power compared with the control group. Raine and colleagues suggested that the reduction in slow power in the intervention group was because of “faster maturation of the cortex” (p. 263), because the amplitude of power in these low-frequency bands would be expected to decrease with age. Indeed, disproportionately high levels of low-frequency power (e.g., delta and theta) combined with a deficit of higher frequency power (typically in the alpha and/or beta bands) is an EEG profile that has been consistently associated with disorders of learning and attention in children (Barry, Clarke, & Johnstone, Reference Barry, Clarke and Johnstone2003; Chabot, di Michele, & Prichep, Reference Chabot, di Michele and Prichep2005) as well as with high levels of psychosocial risk factors related to poverty (Harmony, Marosi, Diaz de Leon, Becker, & Fernandez, Reference Harmony, Marosi, Diaz de Leon, Becker and Fernandez1990; Otero, Pliego-Rivero, Fernandez, & Ricardo, Reference Otero, Pliego-Rivero, Fernandez and Ricardo2003). We also observed a broadly similar profile in the baseline EEG assessment of the institutionalized children in the BEIP (Marshall, Fox, & The BEIP Core Group, Reference Marshall and Fox2004). Compared with never institutionalized community children, the institutionalized children in the study showed a higher proportion of theta power in the EEG, as well as lower levels of alpha and beta power. Based on the extant literature on EEG profiles in learning disorders (Barry et al., Reference Barry, Clarke and Johnstone2003), these effects were interpreted in the context of two models: that the EEG profile in the institutionalized children represented a maturational lag in the EEG, or that it was indicative of cortical hypoarousal.
In the current paper we present findings from analyses of EEG power and coherence in the follow-up EEG assessments in the BEIP at 30 and 42 months of age, with a particular focus on the latter data point. One aim of the current analyses is to examine the EEG profiles of the two groups (foster care and institutionalized groups) at these later assessments to assess the impact of the foster care intervention on children's EEG profiles as indexed by band power and coherence measures.
The EEG is a relatively inexpensive and noninvasive method of recording brain activity using individual electrodes distributed over the surface of the scalp. Several inherent properties of cortical circuits produce an ongoing rhythmicity in the EEG signal, which may be decomposed into oscillations occurring in different frequency bands with specific functional correlates and physiological origins (Niedermeyer & da Silva, Reference Niedermeyer and da Silva1993). For the quantification of electrical activity within each frequency band, the digitized EEG data are typically edited for motor and muscle artifact, and samples of artifact-free data are analyzed using a Fourier transform to quantify the spectral power in the EEG signal. Examples of functionally different frequency bands and their frequency ranges in adults include delta (1–3 Hz), theta (4–7 Hz), alpha (8–13 Hz), and beta (14–20 Hz), with the boundaries of the frequency bands being lower in infants and young children.
EEG coherence represents the squared cross-correction of oscillations within a particular frequency band across a pair of electrode sites. In this sense, coherence is a statistical measure of phase consistency between two time series, with high coherence between two electrode sites typically being considered to reflect a high degree of synchronization between two cortical areas. An influential model of the development of EEG coherence was developed by Thatcher (Reference Thatcher1992). More recently, Thatcher and colleagues used a complex multivariate analysis to relate various aspects of the EEG to individual differences in IQ in a larger (n = 400+) sample ranging from 5 to 52 years of age (Thatcher, North, & Biver, Reference Thatcher, North and Biver2005). Particularly relevant to the current study was the finding of a positive association between decreased EEG coherence and IQ. Decreased coherence may represent increased spatial differentiation and increased complexity of the brain, which in Thatcher's model are related to increased speed and efficiency of information processing. From a developmental perspective, decreased coherence has also been associated with improved cognitive performance in children (Gasser, Jennen-Steinmetz, Sroka, Verleger, & Mocks, Reference Gasser, Jennen-Steinmetz, Sroka, Verleger and Mocks1988; Marosi et al., Reference Marosi, Harmony, Becker, Reyes, Bernal and Fernandez1995). EEG coherence has also found particular utility in the study of language (Weiss & Mueller, Reference Weiss and Mueller2003), including the development of early communicative competence. Mundy, Fox, and Card (Reference Mundy, Fox and Card2003) assessed baseline EEG, joint attention, and parent report language measures in a longitudinal study of infants at 14, 18, and 24 months of age. They found that measures of joint attention and short-distance EEG coherence at 14 months were both related to language development at 24 months. Furthermore, both EEG coherence measures and joint attention measures made unique contributions to multiple regression equations predicting individual differences in language abilities.
The design of the BEIP allowed a number of questions to be addressed concerning the effects of early experience on EEG band power and coherence. Our primary hypothesis concerning EEG power was that the foster care intervention would remediate the high levels of slow (theta) power and the low levels of higher frequency (alpha and beta) power in the EEG signal that were observed across the institutionalized children at the baseline assessment. In terms of EEG coherence, our hypotheses were more exploratory. Based on the literature relating lower EEG coherence to increased levels of intellectual functioning, we tentatively hypothesized that the foster care intervention would be associated with reduced coherence. Given the variability in children's ages at placement into foster care (6–31 months of age), we were also able to assess the effect of placement age on the EEG outcomes. We expected that earlier placement into foster care would be associated with decreased theta power, increased alpha and beta power, and decreased coherence. Finally, we felt it was imperative to explore some of the functional relations between the EEG measures and measures of intellectual ability that were also collected in the study. Given our conceptual bias toward neurobiological measures as mediators between intervention characteristics and outcomes, we tested whether changes in the EEG measures mediated the relation between age at foster care placement and improvements in cognitive status among the children in foster care.
Methods
Participants
The institutionalized participants at the baseline assessment of the BEIP comprised 136 infants and young children aged between 6 and 31 months who were living in six institutions in Bucharest at the onset of the study in April 2001. The full study design is described in detail by Zeanah et al. (Reference Zeanah, Nelson, Fox, Smyke, Marshall and Parker2003). The basic design of the study involved an initial baseline assessment of all the children at entry into the study, followed by random assignment of half of the children into foster care. Prior to baseline, a pediatric neurological screening had ensured that the children were in fair health, and had no obvious genetic abnormalities or anthropomorphic signs of fetal alcohol syndrome (FAS). However, subsequent to the baseline assessment, 11 children developed late-appearing signs of neurological problems (e.g., congenital syphilis, FAS that was undetected at screening) and were excluded from further analyses.
Study design and intervention characteristics
The random assignment process resulted in two groups: the institutionalized group (IG) and the foster care group (FCG). Children in both groups were followed up and assessed at 18 months, 30 months, and 42 months of age, although the number of assessment points was determined by the age of entry into the study. Following the baseline assessment and subsequent randomization, the children in the FCG were placed in their foster home environments. The mean age of placement into foster care was 23.31 months (SD = 6.98, range = 6.8–33.0). The focus of the current paper is on the 42-month data, although the data from 30 months are also used in some of the analyses.
As noted below, we employed a policy of noninterference in terms of changes in children's placements over the course of the study. Between the onset of the study and later assessments, a number of children in both the IG and FCG were adopted domestically, reintegrated with their biological family, or moved into government foster care, at the direction of the appropriate legal authorities. The analyses in this paper, however, are presented from an intent to treat perspective, with the original group assignments being used for all comparisons. This approach represents a conservative approach to analyzing the effects of the foster care intervention, because a significant number of the IG children had left their institutions for family care placements over the course of the study.
The nature of the foster care intervention has been described elsewhere (Zeanah et al., Reference Zeanah, Nelson, Fox, Smyke, Marshall and Parker2003, Reference Zeanah, Koga, Simion, Stanescu, Tabacaru and Fox2006), and is only briefly described here. Because foster care only existed in an extremely limited form at the inception of the study, the BEIP team was responsible for setting up its own foster care system. Sixty foster parents were recruited from the Bucharest community, and were screened, trained, and licensed. Foster parents were paid equitable salaries and were provided with materials to support the foster children. Social workers from the BEIP maintained close contact with the foster families throughout the study.
Ethical considerations
All procedures were approved by the institutional review boards at the principal investigators' universities and by the National Authority of Child Protection and the Ministry of Health in Romania. Local support for the project was obtained through working with government authorities and nongovernmental organizations (NGOs) in Bucharest. Informed consent was obtained from government officials legally responsible for the institutionalized children and from birth parents, when possible, for children placed in foster care. See Millum & Emanuel (Reference Millum and Emanuel2007), Wassenaar (Reference Wassenaar2006), and Zeanah et al. (Reference Zeanah, Koga, Simion, Stanescu, Tabacaru and Fox2006) for more detailed discussions of related ethical issues and safeguards. Among these issues were three of particular importance: (a) a policy of noninterference was implemented in the study, which meant that children in the study in both the IG and FCG could be placed into alternative family care arrangements (e.g., government foster care, domestic adoption, or reintegration with the biological family) by the appropriate legal authorities; (b) this policy of noninterference was qualified by the stipulation that no child placed into BEIP foster care could be returned to an institution; (c) an agreement was made with the Romanian government and a local NGO (SERA Romania) that after the completion of the study, the foster families from the BEIP would continue to be supported.
Procedures for EEG data collection
EEG data were collected from 105 and 90 children at the 30- and 42-month assessments respectively (30 months: IG n = 49, 26 males; FCG n = 56, 28 males; 42 months: IG n = 41, 23 males; FCG n = 49, 25 males). Mean age at the 30- and 42-month assessments was 30.79 (SD = 0.88) and 42.55 months (SD = 0.51), respectively. EEG data were unavailable from an additional 14 children (10 IG, 6 FCG) at 30 months and 17 children (9 IG, 8 FCG) at 42 months because of technical problems, excessive EEG artifact related to gross motor movements, termination of the protocol because of fussiness, or parental/caregiver refusal. There were no significant group differences (IG vs. FCG) in the rate of attrition or data loss.
The EEG was recorded from 12 scalp sites (F3, F4, Fz, C3, C4, P3, P4, Pz, O1, O2, T7, and T8) plus the left and right mastoids using a lycra Electro-Cap (Electro-Cap International Inc., Eaton, OH) with sewn-in tin electrodes. An anterior midline site served as the ground electrode and the EEG was collected referenced to the vertex. After the cap had been correctly fitted, electrolytic conducting gel was inserted into the space between the scalp and the electrode. Impedances were measured at each electrode site and were considered acceptable if they were at or below 10 kΩ. All channels were digitized at 512 Hz onto the hard drive of a PC using a 12-bit A/D converter (±2.5 V input range) and Snap-Master acquisition software (HEM Data Corporation, Southfield, MI). One channel of vertical electrooculogram (EOG) was recorded using tin electrodes placed above and below the left eye to record blinks and other eye movement. The EEG and EOG signals were amplified by factors of 5,000 and 2,500, respectively, using custom bioelectric amplifiers from SA Instrumentation Company (San Diego, CA). Amplifier filter settings for all channels were 0.1 Hz (high pass) and 100 Hz (low pass). Prior to the recording of EEG from each participant, a 50-µV 10-Hz signal was input into each of the channels and the amplified signal was recorded for calibration purposes.
During EEG collection, an experimenter placed a number of brightly colored balls in a bingo wheel and spun the wheel for a series of nine trials, each lasting 10 s. This experimental protocol has proved useful for EEG collection in awake infants and young children (e.g., Calkins, Fox, & Marshall, Reference Calkins, Fox and Marshall1996). The spinning trials were separated by 10-s intervals in which the experimenter stopped spinning the wheel and changed the number of balls in the wheel in order to maintain the child's attention. The EEG signal was recorded for the entire 3-min period, but only data from epochs in which the wheel was being spun were subjected to further analysis.
Processing and analysis of the EEG signals was carried out using the EEG Analysis System from James Long Company (Caroga Lake, NY). Epochs containing blinks or other eye movement were excluded from further analysis (Somsen & van Beek, Reference Somsen and van Beek1998), as were epochs in which the EEG signal exceeded ±250 µV. The EEG channels were rereferenced in software to an average mastoids reference (Essl & Rappelsberger, Reference Essl and Rappelsberger1998). Consistent with prior research in this age range (Marshall, Bar-Haim, & Fox, Reference Marshall, Bar-Haim and Fox2002), the following frequency bands were utilized: theta (3–5 Hz), alpha (6–10 Hz), and beta (11–18 Hz). For each of these bands, spectral power was computed as both absolute power (AP) and relative power (RP). RP is computed as the proportion of power in a specific frequency band at a given electrode site relative to the total power in the EEG power spectrum at that electrode site. Because RP values are proportion scores, an increase in absolute power in one frequency band will affect RP values in other bands. Because of the relative merits of both metrics, one approach in developmental EEG studies is to quantify and analyze both AP and RP (Somsen, van't Klooster, van der Molen, van Leeuwen, & Licht, Reference Somsen, van't Klooster, van der Molen, van Leeuwen and Licht1997). This was the approach used in both the baseline analyses previously presented by Marshall et al. (2004), as well as the current analyses.
Intrahemispheric coherence was also computed between the following regions within each hemisphere: frontal–central (F3–C3 and F4–C4), frontal–temporal (F3–T7 and F4–T8), frontal–parietal (F3–P3 and F4–P4), and frontal–occipital (F3–O1 and F4–O2). A focus on intrahemispheric coherence between frontal and other sites is consistent with other developmental work examining EEG coherence in infancy and early childhood (Bell & Fox, Reference Bell and Fox1996; Mundy, Card, & Fox, Reference Mundy, Card and Fox2000; Mundy et al., Reference Mundy, Fox and Card2003).
Assessments of intellectual functioning
Other measures administered in the BEIP included the Bayley Scales of Infant Development (Bayley, Reference Bayley1993) and the Reynell Developmental Language Scales (RDLS; Reynell & Gruber, Reference Reynell and Gruber1985). The baseline levels and the effect of the foster care intervention on both these measures have been described elsewhere (Nelson et al., Reference Nelson, Zeanah, Fox, Marshall, Smyke and Guthrie2007; Smyke et al., Reference Smyke, Koga, Johnson, Fox, Marshall and Nelson2007; Windsor, Glaze, Koga, & the BEIP Core Group, Reference Windsor, Glaze and Koga2007). They are included in the current paper for the purpose of relating EEG changes to changes in intellectual abilities.
Results
Overall analysis of intervention effects
EEG power
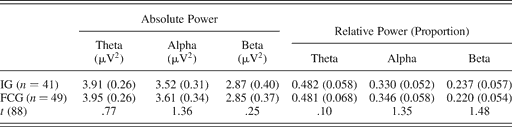
To examine group differences in EEG topography (regional and hemispheric differences) at the 42-month assessment, linear mixed models were conducted. There were no significant interactions involving group (IG, FCG) and electrode region (frontal, central, parietal, occipital, temporal) or hemisphere (left, right) for any frequency band. Given the absence of regional or hemispheric effects involving group, mean power was computed across all electrode sites for each of the three bands (theta, alpha, beta) in each of the two metrics: AP and RP. Independent sample t tests were then carried out for each of the six mean EEG measures. There were no significant group differences in any of the frequency bands for the AP or RP metrics (see Table 1).
Mean absolute power and relative power for the three frequency bands (theta, alpha, beta) in the institutionalized group (IG) and the foster care group (FCG) at the 42-month assessment
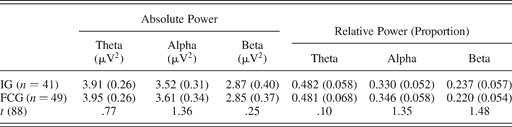
Note: Also shown are t statistics for group comparisons. Standard deviations are presented in parentheses.
EEG coherence
Similar linear mixed model analyses were conducted for intrahemispheric coherence in each of the three frequency bands (theta, alpha, beta) across the four electrode combinations of interest (frontal-central, frontal–temporal, frontal–parietal, and frontal–occipital). The mixed model analysis showed no significant main effect of group (IG, FCG) on EEG coherence, and no interaction of group with electrode region. However, the analysis did reveal a significant group by hemisphere interaction, F (1, 88) = 4.28, p < .05, with follow-up tests showing that the FCG had overall lower mean coherence in the right hemisphere compared with the IG (p < .05).
Effects of age at foster care placement on EEG power and coherence
Further analyses were conducted within the FCG to examine the effects of age at foster care placement on the EEG. If such effects were found, it might suggest that the overall variability in placement age within the FCG reduced the likelihood of finding overall group differences at the 42-month assessment. Two approaches were used in this set of analyses: first, correlations were computed within the FCG between the EEG variables of interest at the 42-month assessment and age at foster care placement. Second, we capitalized on the longitudinal design of the study to create groups of children who had been placed into foster care at different ages but who had received similar durations of intervention. This allowed us to examine the effects of earlier placement without the potential confound that earlier placement ages were associated with longer durations of intervention up to the 42-month time point.
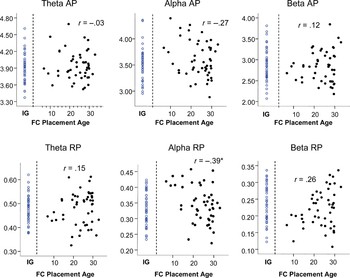
To assess differences in EEG band power associated with the variability in age of foster care placement within the FCG, Pearson correlations were computed between age at placement and each of the six band power measures at 42 months. Scatterplots for each of these correlations are shown in Figure 1. Mean alpha RP was significantly negatively correlated with age at foster care placement (r = −.39, p < .01. The negative correlation for alpha AP with placement age approached statistical significance (r = −.27, p = .06), as did the positive correlation for mean beta RP (r = .26, p = .07). All other correlations were not statistically significant.
Scatterplots showing 42-month EEG band power for absolute (µV2) and relative power (proportion) in the theta, alpha, and beta band against age of placement into foster care. The Pearson correlation coefficients for the relation between placement age and EEG power are also shown. The individual values for children in the institutionalized group (IG) are shown for reference. [A color version of this figure can be viewed online at journals.cambridge.org/dpp]

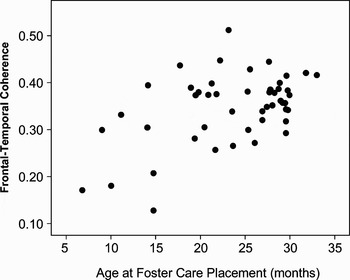
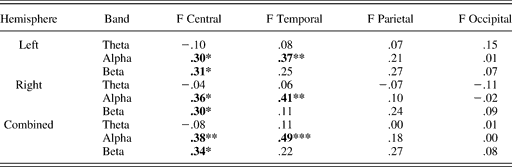
Similar analyses involving EEG coherence involved computing Pearson correlations between the coherence variables at 42 months of age and the age at which children were placed into foster care. Correlations were computed for intrahemispheric coherence in each of the three frequency bands of interest (theta, alpha, beta). As shown in Table 2, significant positive correlations were found between age at foster care placement and certain measures of coherence in both hemispheres. The most salient finding was that short-distance coherence (i.e., frontal–central and frontal–temporal electrode pairings) in the alpha and beta bands was lower for children placed into foster care at earlier ages. No relation with placement age was found for coherence in the theta band or for longer distance (frontal–parietal and frontal–occipital) coherence in any of the three frequency bands. The pattern of correlations also suggested no hemispheric differences in the relation between age at foster care placement and EEG power. For further analyses, the coherence measures were collapsed across hemispheres. The correlation of largest magnitude (for frontal–temporal alpha coherence across both hemispheres) is shown graphically in Figure 2.
A scatterplot showing the relation between mean EEG coherence between frontal and temporal electrode sites (averaged across hemisphere) and age at foster care placement within the foster care group (FCG).

Correlations within the foster care group between age at placement into foster care and EEG coherence variables at the 42-month assessment (n = 49)
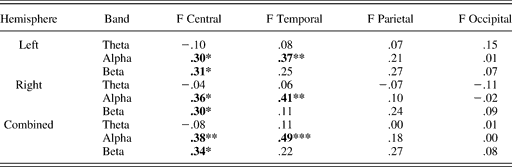
Note: Statistically significant correlations are shown in bold.
*p < .05. **p < .01.
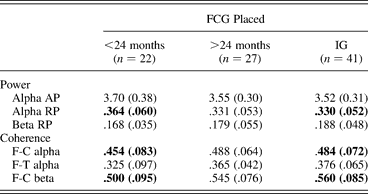
The correlational analyses suggested that effects of placement age were present in the FCG for certain EEG measures at 42 months, particularly alpha power and short-distance coherence in the alpha and beta bands. Children placed into foster care at earlier ages tended to have higher alpha power and lower short-distance (e.g., frontal–temporal) alpha coherence at 42 months. This pattern of correlations prompted a set of analyses that examined whether EEG differences between the IG and FCG at 42 months were more apparent for children placed into foster care at earlier ages. As a first pass at this analysis, the foster care group was divided using a cutoff of 24 months of age, which approximated the median age at foster care placement. The two groups formed by this division were compared with the IG on the six EEG variables at 42 months that had met or approached statistical significance in the previous correlational analyses. Individual univariate analysis of variances showed a significant main effect of group (FCG placed before 24 months, FCG placed after 24 months, IG) for alpha RP, F (2, 87) = 3.13, p < .05, frontal–temporal alpha coherence, F (2, 87) = 3.98, p < .05, and frontal–central beta coherence, F (2, 87) = 3.66, p < .05. Post hoc Bonferroni comparisons showed that the FCG children who were placed before 24 months of age had higher power (p = .06) and lower coherence (p < .05) than the IG. The FC children who were placed after 24 months of age did not differ significantly from the IG on these variables. Means from all six analyses are shown in Table 3.
Mean values on selected EEG variables at 42 months for children placed into foster care (FCG) before or after 24 months of age and for the institutionalized group (IG)
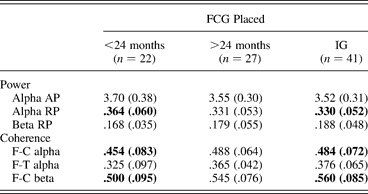
Note: Values in bold indicate significant post hoc comparisons (see text). AP, absolute power; RP, relative power.
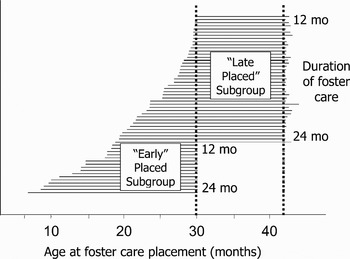
The correlational analyses and the subsequent analyses using a 24-month cutoff for age at foster care placement suggests that earlier placement into foster care is associated with a differential EEG profile at the 42-month assessment. However, strong inferences cannot be made about the effect of earlier placement age on the EEG solely from these correlations or group comparisons, because children placed at earlier ages also had received longer durations of foster care at the 42-month assessment. For example, at the time of the 42-month assessment, a child placed into foster care at 12 months of age had received 30 months of foster care intervention. In contrast, a child placed into foster care at 24 months of age had received 18 months of intervention by the time of their 42-month assessment. In an attempt to disentangle intervention duration from placement age, an additional analysis strategy involved dividing the FCG on the basis of a specific age at placement (18.5 months of age) and comparing the earlier (<18.5 months) and later (>18.5 months) placed subgroups at the 30- and 42-month assessments, respectively. Note that the small number of children placed into foster care later than 30 months of age were not included in this analysis. The 18.5-month age cutoff was selected to equate the duration of FC intervention between the two subgroups as closely as possible given the distribution of placement ages within the FCG. Thus, children in the early-placed FCG subgroup (n = 13 with EEG data) at the 30-month assessment and those in the late-placed FCG subgroup (n = 40 with EEG data) at the 42-month assessment had all received between 12 and 24 months of foster care intervention, but had been placed at different ages. Figure 3 shows a graphical representation of the two subgroups. The mean age at placement for the early-placed group was 12.5 months (SD = 3.4), and the mean age at placement for the late-placed group was 26.2 months (SD = 3.9). On average, the children in these subgroups had received similar durations of intervention. By the time that they were assessed at 30 months of age, children in the early-placed FC subgroup had been in foster care for a mean duration of 18.1 months (SD = 3.3). At the 42-month time point, the late-placed FC subgroup had been in foster care for a mean duration of 16.2 months (SD = 3.8). Comparison subgroups were also created of children in the IG who had entered the study before 18.5 months of age (n = 15 with EEG data) and those who entered the study after 18.5 months of age (n = 29 with EEG data). There were no significant differences between the four subgroups in the length of time elapsed since entry into the study (or foster care placement) and the 42-month EEG assessment. Because each subgroup had received comparable mean lengths of intervention or time since entry into the study, this analysis potentially allowed for more inference to be drawn about the differential effects of early and late placement.
Illustration of the early-placed and late-placed subgroups within the larger foster care group (FCG). Each horizontal line represents one participant within the FCG. The chart shows the entire FCG (excluding children placed after 30 months of age), whereas the analyses in the text deal with only the children with complete EEG data.

The above approach allowed two further questions to be addressed. First, are EEG differences between the FCG and IG apparent for subgroups of children who were placed into foster care earlier rather than later? Addressing this question involved comparing the newly created FC subgroups with IG children who entered the study at comparable ages. Second, are there differences between the subgroups of children in the FCG who were placed into foster care at earlier versus later ages? This second comparison involves comparing the early-placed FCG subgroup at the 30-month assessment with the late-placed FCG subgroup at the 42-month assessment. This latter comparison was undertaken tentatively, because potential age-related changes in the EEG are likely to confound the comparison across two different age points.
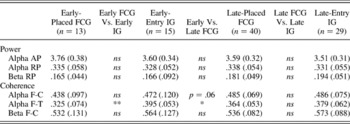
Subgroup analyses focused on the EEG measures for which the 42-month correlations with age at placement were of the largest magnitude: mean absolute and relative alpha power averaged across all electrode sites, relative beta power across all electrode sites, alpha coherence for frontal–central and frontal–temporal electrode pairs, and frontal–central beta coherence. Means for each of the four subgroups are shown in Table 4. For the EEG band power measures, a series of t tests did not reveal differences between the early-placed FCG at 30 months of age and the subgroup of IG children who were similar ages when they entered the study. Significant differences were also not observed between early-placed FC children at 30 months and late-placed FCG children at 42 months. Although absolute alpha power was higher for the early-placed FC subgroup compared with the late-placed subgroup, this difference was not significant (p = .12). For coherence, the early-placed foster care subgroup had significantly lower frontal–temporal alpha coherence than the subgroup of institutionalized children who entered the study at early ages, t (26) = 2.94, p < .01. In addition, the early-placed FC subgroup showed significantly lower frontal–temporal alpha coherence, t (51) = 2.08, p < .05) than the later-placed FC subgroup, with a trend toward a similar difference for frontal–central alpha coherence, t (51) = 1.96, p = .06.
Mean EEG power and coherence for four subgroups of the institutional and foster care groups (IG and FCG) based on a cutoff of 18.5 months at placement or study entry

Note: The means for the early-placed FCG and early-entry IG are from the 30-month time point. The means for the late-placed FCG and late-entry IG are from the 42-month time point. Significance values from t tests are shown for three sets of comparisons: early-placed FCG with early-entry IG, early-placed FCG with late-placed FCG, and late-placed FCG with late-entry IG.
*p < .05. **p < .01. ns p > .05.
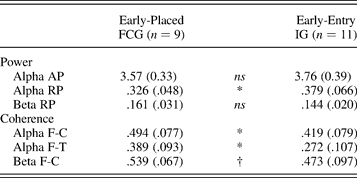
The formation of the early- and late-placed FCG subgroups allowed one further question to be addressed, which is whether the early-placed FC subgroup differed from the IG at the 42-month assessment, at which point the early-placed FC subgroup had received between 24 and 36 months of intervention (M = 29.9, SD = 4.6). In this case, there can be no similar comparison involving the late-placed FC subgroup, because the 42-month time point was the last time point that involved the collection of EEG in the study. For mean relative alpha power at 42 months, the early-placed FC subgroup had higher power than the subgroup of IG children who had entered the study at comparable ages (n = 9 and 11, respectively), t (18) = 2.06, p = .05. Significant differences between the FCG and IG subgroups were not observed for the other power measures. For coherence, there were significant differences between the subgroups for all three of the coherence measures examined. Specifically, the early-placed subgroup had significantly lower coherence than the IG subgroup for frontal–central alpha coherence, t (18) = 2.13, p < .05, frontal–temporal alpha coherence, t (18) = 2.60, p < .05, and frontal–central beta coherence, t (18) = 2.13, p < .05. Group means for power and coherence are shown in Table 5.
Mean EEG power and coherence at the 42-month assessment for selected frequency bands and electrode combinations for the early-placed foster care group (FCG) subgroup (placed before 18.5 months) and the comparison institutionalized group (IG) subgroup
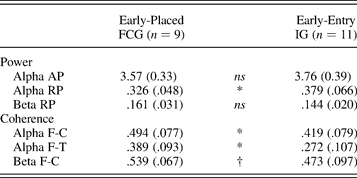
Note: The results of significance tests from independent-samples t tests are also shown.
†p < .10. *p ≤ .05. ns p > .10.
An additional analysis concerned the observation that the sizes of the subgroups in the previous analysis were relatively small. This poses a particular threat to internal validity in terms of the possibility of preexisting differences between the subgroups. To safeguard against this, an additional check was carried out that involved comparing the FCG and IG subgroups on the selected EEG power and coherence measures at the baseline assessment (prior to randomization). These analyses showed that no significant differences in the power and coherence measures existed at baseline between the FCG subgroups and the comparison subsets of the IG who entered the study at comparable ages.
Relation of EEG measures to intellectual functioning at 42 months
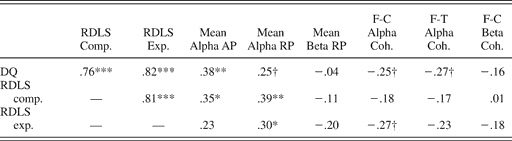
To determine whether changes in the EEG were related to functional changes in cognitive abilities at 42 months, Pearson correlations were first computed between the six EEG variables from the previous analyses and the measures of cognitive status (developmental quotient [DQ], RDLS). The correlation coefficients at 42 months between DQ, RDLS comprehension, RDLS expressive language, and the EEG variables are shown in Table 6. Significant correlations were observed between DQ and absolute alpha power, between the RDLS raw score for comprehension and both absolute and relative alpha power, and between the RDLS adjusted raw score for expressive language and relative alpha power at 42 months. No significant correlations were found for the EEG coherence variables. All three measures of cognitive functioning were also correlated with age at foster care placement (DQ, r = −.36, p = .01; RDLS comprehension, r = −.41, p < .01; RDLS expressive, r = −.49, p < .01; note that these correlations refer to the 49 FCG children with EEG data at 42 months). The existence of the intercorrelations within the FCG between specific EEG power measures, DQ, the language measures, and age at foster care placement suggested that a mediational model may be appropriate for testing the functional relations between changes in the EEG, changes in cognitive functioning, and age at placement. Specifically, it was conceptualized that changes in the EEG measures may mediate the associations between the cognitive measures and age at placement. Initial examinations involved the computation of partial correlations, but these correlations did not suggest strong evidence for mediation. For instance, the partial correlation between 42-month DQ and age at placement within the FCG was still significant (r = −.29, p < .05) when absolute alpha power at 42 months was controlled for. No suggestion of mediational effects of the EEG measures was also found for other combinations of the DQ, language measures, and EEG power and coherence measures. More formal tests of mediation using multiple regression also failed to expose a role for the six EEG measures in mediating the relation between age at placement into foster care and cognitive outcomes at 42 months.
Pearson correlations within the foster care group (FCG) at 42 months between development quotient, raw scores on the Reynell Developmental Language Scales (comprehension and expression), and the six EEG measures that correlated with age at foster care placement
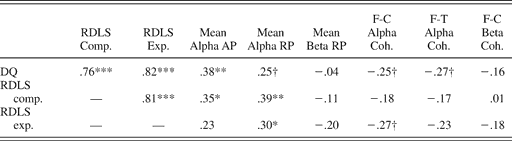
Note: n = 49. AP, absolute power; RP, relative power.
†p < .10. *p < .05. **p < .01. ***p < .001.
Discussion
We tested the hypothesis that placement of institutionalized children into foster care at ages ranging between 7 and 31 months would be associated with a specific profile of the resting EEG in the FCG at 42 months of age. Relative to the continually institutionalized children, the FCG children were hypothesized to show low levels of slow frequency power and increased levels of higher frequency power, as well as lower levels of short-distance EEG coherence. We tested this hypothesis by comparing the foster care and institutionalized groups at the 42-month assessment. We also tested an accompanying hypothesis that earlier placement into foster care would have a greater impact on EEG power and coherence than foster care that was initiated at a later age. This second hypothesis was initially tested by computing correlations between foster care placement age and EEG coherence measures, as well as a basic group approach that involved splitting the FCG into groups of children who had been placed before or after 24 months of age. A subsequent approach involved creating subgroups within the foster care group such that the children in these subgroups had entered foster care at different ages but had received, on average, a similar duration of intervention.
Considering EEG power, the initial analysis comparing the groups at 42 months of age did not reveal main effects of the foster care intervention. One interpretation of this lack of findings is that the intervention was essentially unsuccessful in changing EEG band power in the foster care group relative to the institutional group. However, it is also possible that the wide variability in age at foster care placement obscured changes in the EEG that were associated with age at placement. Given that the age at foster care placement ranged between 7 and 31 months of age, it could be that effects on EEG power were only apparent for the small number of children placed into foster care at the earliest ages in the study. Subsequent analyses indeed suggested a relation between age at placement into foster care and certain EEG power measures at the 42-month assessment. For instance, age at placement was negatively correlated with both absolute and relative alpha power within the FCG. Visual inspection of the scatterplots showing the relation between these variables suggests that the negative correlations between placement age and EEG alpha power were driven by a group of children who had entered foster care at the earliest ages (between 7 and 15 months of age). Group analyses that split the foster care group into two groups (placed before 24 months of age and placed after 24 months of age) also suggested that children who entered foster care earlier had higher alpha power at 42 months of age than the institutionalized group.
The above findings concerning EEG power are subject to at least three explanations, each of which raises a number of further questions relating to the confounding of age at foster care placement and duration of foster care intervention in the 42-month data. One interpretation is that the foster care intervention was unsuccessful at changing EEG power in the FCG, and that the group of early-placed children that appears to be driving the correlational findings is too small to warrant strong conclusions about the effect of foster care on the EEG. We do not believe that such an interpretation is warranted. A second interpretation would be that the foster care intervention was successful in changing the EEG only for children who began to receive the intervention at the earliest ages of the study, and that this change for these children was because of the intervention occurring within a sensitive period for EEG development. From this perspective, the design of the study did not include enough children placed earlier (e.g., in the first year of life) for overall group differences to be detected in EEG power at 42 months. A third, opposing interpretation of the correlational findings states that the profile of EEG power observed at 42 months in the group of children entering foster care at the earliest ages is primarily because of the longer duration of intervention for these children, rather than earlier placement into foster care. This interpretation would also suggest that the overall mean duration of intervention was too short to reveal group differences between the IG and FCG on band power at 42 months, and further, that IG/FCG group differences would emerge at assessment ages later than 42 months.
Given the confound in the current study between age at placement and the duration of foster care at the 42-month assessment, it is problematic to chose between the second or third interpretations presented above on the basis of the correlations between age at foster care placement and the EEG variables. We attempted to address this issue by creating subgroups of children of children in the foster care group who had received similar mean durations of intervention, but who had been placed either at younger (mean = 13 months) or older (mean = 27 months) ages. This analytic approach involved assessing the early-placed group at the 30-month age point and the late-placed group at the 42-month age point. This enabled a number of key comparisons to be made. The early-placed FC subgroup was compared on the 30-month measures with the subgroup of IG children who entered the study at similar (early) ages, and the late-placed FC subgroup was compared on the 42-month measures with the subgroup of IG children who entered the study at later ages. The early-placed FC subgroup at 30 months of age was also compared with the late-placed FC subgroup at 42 months of age. However, although the latter comparison is appropriate for standardized measures, developmental changes in the EEG introduce some problems into the interpretation of this comparison. Finally, we compared the early-placed FC subgroup and the appropriate IG comparison subgroup at 42 months of age, at which time the FC children had received between 24 and 36 months of foster care.
The subgroup analyses for EEG band power utilized the three power measures for which the 42-month correlations with age at placement were of the strongest magnitude: absolute and relative alpha power, and relative beta power. At the 30-month assessment, after a mean duration of 18 months in foster care, the early-placed foster care subgroup did not differ on these EEG power measures from the group of IG children who entered the study at similar ages. The early-placed FC subgroup also did not differ from the late-placed FC subgroup on the three measures of EEG band power. In the third set of comparisons, the early-placed FC subgroup did differ from the appropriate IG comparison group on relative alpha power at 42 months of age. Although the small sizes of the subgroups at the 42-month assessment may limit the degree of inference possible from this finding, it does suggest that effects on alpha power were not apparent for children in the FCG after 12 to 24 months of intervention, regardless of whether they were placed into foster care at earlier (<18.5 months) or later (>18.5 months) ages. Instead, differences between the IG and FCG began to emerge in the children placed at the earliest ages after the longest durations of intervention (24–36 months). This is consistent with the patterns evident from the scatterplots in Figure 1 for relative alpha power, where the correlation appears to be driven by the small group of children placed at the earliest ages. However, this finding still leaves open the question of whether the key aspect is whether children were placed into foster care at earlier ages, or whether 24 to 36 months of foster care is needed to see group differences emerge in relative alpha power, regardless of age at placement.
As seen above, effects of the intervention on EEG band power primarily concerned changes in relative alpha power for the children placed at the earliest ages in the study, who also received the longest durations of intervention. The coherence measures presented a slightly different picture in terms of the effect of the foster care intervention on the resting EEG. As for EEG power, the initial between-group analyses for coherence did not show clear overall effects of the foster care intervention. However, a weak interaction between group and hemisphere emerged that suggested that the intervention was associated with overall lower right-hemisphere coherence in the FCG compared with the IG. Because we did not have specific hypotheses concerning intervention effects on hemispheric asymmetries in coherence, this finding is difficult to interpret. However, prior developmental work has suggested that better performance on cognitive tasks has been associated with decreased right-hemisphere coherence, although this work was primarily with younger infants (Bell, Reference Bell2001; Bell & Fox, Reference Bell and Fox1997). In addition, lower coherence in the right hemisphere compared with the left has also been observed in typical development (Barry, Clarke, McCarthy, & Selikowitz, Reference Barry, Clarke, McCarthy and Selikowitz2005; John et al., Reference John, Ahn, Prichep, Trepetin, Brown and Kaye1980).
Although the overall FCG-IG comparison did not yield clear main effects for coherence, the correlational analyses revealed significant, negative relations between age at foster care placement and specific coherence measures at 42 months. Analyses using a median split approach also suggested that FCG children placed before 24 months of age differed from the IG at 42 months, although the FCG children placed after 24 months of age did not. The measures that showed this pattern were primarily those which indexed coherence across relatively short interelectrode distances (frontal–central and frontal–temporal) for the alpha and beta bands. Coherence between pairs of electrodes that were more spatially separated (frontal–parietal and frontal–occipital) was not related to age at foster care placement. In addition, coherence across both short- and long-distance derivations for the theta band did not show any relation with age at placement. The focus of the coherence analyses was therefore on short-distance coherence, primarily in the alpha band.
The analysis strategy of examining subgroups that was used to separate the effects of placement age and duration intervention for EEG power was also used for the analyses of EEG coherence. The primary finding for coherence was that at the 30-month assessment, frontal–temporal alpha coherence was significantly lower in the early-placed FC subgroup than the appropriate comparison subgroup of the IG. The later-placed FC subgroup did not show a similar pattern of low frontal–temporal coherence. This suggests that effects of the foster care intervention on EEG alpha coherence at 30 months of age were apparent for a specific short-distance electrode combination (frontal–temporal) for children placed into foster care before 18 months of age. The same effects of early placement while holding duration of intervention constant were not as apparent for the other coherence measures, specifically alpha and beta coherence between frontal and central electrode sites. However, it should also be noted that the early-placed FC subgroup at 30 months had lower frontal–temporal and frontal–central alpha coherence compared with the late-placed FC subgroup at 42 months. Although it is somewhat problematic to compare across different age points because of maturational factors, these findings support a general interpretation that earlier ages at foster care placement were associated with lower short-distance alpha coherence at later assessments.
When the early-placed FC subgroup was compared with the appropriate IG subgroup at the 42-month assessment, all three coherence measures (frontal–central alpha and beta coherence as well as frontal–temporal alpha coherence) showed group differences. This suggests that intervention effects on aspects of EEG coherence emerged consistently for the earliest placed children in the foster care group after the longest possible durations of intervention (24–36 months of foster care).
For a number of our EEG variables, the lack of an EEG assessment after 42 months of age precludes strong inferences about the effects of earlier placement versus longer durations of intervention. Despite this constraint, our theoretical bias leads us to favor an interpretation that earlier age at placement into foster care was responsible for the correlations of the EEG measures with age at foster care placement, despite the confound of this variable with duration of intervention. Such an interpretation is consistent with work on postinstitutionalized, internationally adopted children in which earlier age at adoption was associated with improved cognitive outcomes compared with adoption at later ages (MacLean, Reference MacLean2003; Rutter, Reference Rutter, Marshall and Fox2006). Although transitions to a more favorable caregiving environment are almost always associated with improvement in various domains of functioning (Clarke & Clarke, Reference Clarke and Clarke2000), there is also evidence suggesting that plasticity in a number of behavioral and neurobiological systems may indeed be greater at earlier ages (Nelson et al., Reference Nelson, Zeanah, Fox, Marshall, Smyke and Guthrie2007; O'Connor, Reference O'Connor2003).
In terms of limitations, there are a number of questions that could be raised about the current findings. One question concerns the observation that contrary to one of our initial hypotheses, the foster care intervention did not appear to change theta (low-frequency) EEG power. In comparing the entire institutionalized sample with the community comparison sample at the baseline assessment (i.e., prior to randomization), Marshall et al. (2004) reported an EEG profile in the institutional group characterized by an excess of theta power combined with a reduction in higher frequency (alpha and beta) power. This EEG profile has been associated with cognitive delays, learning disabilities, and attentional problems in a variety of samples (mostly with older children) and was interpreted by Marshall et al. (2004) as signifying two possible deficits: cortical hypoarousal (from the lack of higher frequency power) or a delay in the development of the EEG as indicated by the excess of low-frequency theta power, which is expected to decrease with age. Given the strength of findings concerning an excess of theta power in the EEG profile of the institutionalized children at baseline, it is somewhat surprising to see intervention effects mostly occurring in the alpha band but not the theta band.
Another particularly important question concerns the functional significance of the EEG changes that were observed in the current analyses. In terms of alpha power, the main finding was that the children placed into foster care at the earliest ages showed increased levels of power at the 42-month assessment, relative to children in the institutional group. Our perspective on this finding is that the increase in alpha power in the FCG represents a partial remediation of the deficits in this measure that were present at the baseline assessment. When viewed in the context of the models presented by Marshall et al. (2004), this remediation may represent catch-up in the development of the EEG in the foster care children placed at the earliest ages in the study. In terms of coherence, the current findings are consistent with work by Mundy et al. (Reference Mundy, Fox and Card2003), who showed that decreased short-distance EEG coherence in infancy was predictive of improved language outcomes, as well as research relating increased coherence to cognitive delays in children (Gasser et al., Reference Gasser, Jennen-Steinmetz, Sroka, Verleger and Mocks1988; Marosi et al., Reference Marosi, Harmony, Becker, Reyes, Bernal and Fernandez1995).
A final question concerned how the changes in EEG power and coherence relate to changes in other measures in the BEIP, particularly assessments of cognitive status. As suggested in the introduction to this paper, one theoretically favorable model states that changes in neurobiological measures may be expected to mediate changes in behavioral or psychological measures that are seen in response to a given intervention. When the children placed in foster care were assessed at 42 months, we did observe correlations between specific EEG band power variables and scores on particular tests of intellectual functioning, namely, the Reynell Language Scales and the DQ derived from the Bayley Scales. We also found that specific EEG measures and the scores on the cognitive assessments tended to correlate with the age at placement in foster care for the FCG. These intercorrelations, along with the other evidence presented here and elsewhere (Nelson et al., Reference Nelson, Zeanah, Fox, Marshall, Smyke and Guthrie2007) suggest that the children placed in foster care at earlier ages show concurrent gains in both cognitive functioning and the development of certain aspects of the EEG signal (e.g., an increase in alpha power). However, analyses using partial correlations and multiple regression did not find particular evidence, suggesting that the EEG variables were mediating the changes in DQ or language abilities. It is possible that our sample size was too small to detect such effects, but the lack of mediation also illustrates the often complex and sometimes counterintuitive relations between measures of physiological functioning and measures tapping complex psychological constructs. The nature and importance of these cross-domain relations has been the subject of much debate both within the domain of developmental psychopathology (e.g., Cichetti & Curtis, 2006; Pollak, Reference Pollak2005) and in psychology more generally (e.g., Kagan, Reference Kagan2006).
Additional limitations of the current analyses should be pointed out. Although we found particular effects of age at placement, it should be noted that children were not randomized on age at foster care placement. This leaves open the possibility that children placed earlier and later into foster care may have differed on certain preexisting characteristics. However, analyses of these subgroups at baseline did not reveal preexisting differences on the EEG variables that were used as later outcomes. Perhaps of more importance, the sample sizes at 42 months of age were relatively small given the (reasonable) rate of attrition and noncompliance with the EEG procedures. The small sample sizes were particularly evident in the comparison of the early- and late-placed foster care subgroups and the comparison subgroups of institutionalized children, so our conclusions about age at placement may be tempered by issues of statistical power as well as the possibility of a Type I error. One final point concerns the lack of strength of the intervention effects. It should be noted that the intent to treat analysis adopted in the current paper represents a conservative approach toward the assessment of the foster care intervention. Because a significant number of the institutionalized children were no longer living in institutions at the 42-month assessment, the foster care intervention is essentially being compared to the natural course of institutionalization over the course of the 3 years of the study. These 3 years turned out to be a fairly rapid period of social change in Romania, and the natural course of institutionalization for young children over those 3 years often did not involve staying in an institution, and for many children involved a placement into an alternative, family environment. This could be one of the contributing factors why we did not observe clear overall effects of the foster care intervention on the EEG at the 42-month assessment. Finally, the EEG measures used in the current study were nonspecific, and were not collected during an active task. The low-density electrode array utilized does not lend itself to particular conclusions about particular brain systems that were impacted by the foster care intervention. Instead, our conclusions about brain function are limited to fairly general EEG profiles that have been associated with global cognitive functioning rather than more specific behavioral or psychological constructs.
Conclusion
In summary, we believe that we have found evidence for foster care being associated with neurophysiological changes in the central nervous system in previously institutionalized children, with the extent of these changes being partly dependent on age at placement into foster care. In this sense, the current study provides a novel and unique perspective on brain–behavior relations in early preventative interventions.