Implications
Smooth metabolic adaptation and maintaining rumen health are highly important during the transition period in dairy cows. This study monitored changes in metabolic and endocrine responses and reticuloruminal pH in periparturient dairy cows that experienced different degrees of lipolysis early postpartum. The findings of different metabolic adaptation strategies to cope with the energy deficit postpartum and the differences regarding reticuloruminal pH indicate a role of rumen fermentation in the metabolic adaptation of dairy cows. This implies that it is necessary to find a proper balance between prevention of rumen fermentation disorders and excessive lipolysis through appropriate feeding management in periparturient dairy cows.
Introduction
In dairy cows, transition from pregnancy to lactation is characterized by important metabolic adaptations aiming to counteract the acute energy deficit at the onset of lactation. The adaptations include concerted changes that enable a more efficient use of glucose and also increased generation of fuels from alternate endogenous sources (Aschenbach et al., Reference Aschenbach, Kristensen, Donkin, Hammon and Penner2010), because the requirements for glucose are much higher than the alimentary sources. Accordingly, cows enhance the utilization of endogenously available glucogenic sources such as glycogen, skeletal amino acids, lactate and, most importantly, increase the mobilization of triacylglycerols (TAG) from fat tissues to generate the necessary fuels (De Koster and Opsomer, Reference De Koster and Opsomer2013), to overcome the negative energy balance (NEB) postpartum (Ingvartsen and Andersen, Reference Ingvartsen and Andersen2000). These metabolic adaptations are triggered by the energy deficit and seem to be orchestrated by endocrine changes during the transition period including a lowered insulin sensitivity of many tissues (De Koster and Opsomer, Reference De Koster and Opsomer2013; Rico et al., Reference Rico, Bandaru, Dorskind, Haughey and McFadden2015). Depending on the level of the energy deficit, various degrees of lipolysis take place in early lactation cows (Hammon et al., Reference Hammon, Stürmer, Schneider, Tuchscherer, Blum, Engelhard, Genzel, Staufenbiel and Kanitz2009; Gruber et al., Reference Gruber, Urdl, Obritzhauser, Schauer, Häusler and Steiner2014). The excessive rates of lipolysis result in markedly elevated plasma concentrations of non-esterified fatty acids (NEFA), making preprandial NEFA an accurate indicator of the actual body lipid loss (Chilliard et al., Reference Chilliard, Ferlay, Faulconnier, Bonnet, Rouel and Bocquier2000), and the best predictor of various metabolic diseases postpartum (Ospina et al., Reference Ospina, Nydam, Stokol and Overton2010).
Feeding management is crucial to alleviate energy deficit and lipolysis, enabling a smooth metabolic adaptation of the cows during the transition period (Drackley and Cardoso, Reference Drackley and Cardoso2014). To lessen the energy deficit postpartum, cows usually are fed increasing amounts of energy-rich concentrates. These shifts in the diet composition towards concentrates, however, happen at the expense of fiber-rich forages, causing dietary imbalances (i.e. lowered concentration of physically effective fiber) with critical importance for rumen health (Zebeli et al., Reference Zebeli, Aschenbach, Tafaj, Boguhn, Ametaj and Drochner2012). Proper rumen health during the transition period is crucial to enhance the energy supply and also prevent rumen and systemic disorders in the periparturient cow (Zebeli et al., Reference Zebeli, Ghareeb, Humer, Metzler-Zebeli and Besenfelder2015). Rumen pH is routinely used as an indicator of rumen health, as pH reflects both the ruminal milieu needed for proper ruminal functioning and also indicates the fermentation output available as energy source for gluconeogenesis and milk production (Aschenbach et al., Reference Aschenbach, Kristensen, Donkin, Hammon and Penner2010 and Reference Aschenbach, Penner, Stumpff and Gäbel2011), thus likely modulating the metabolic adaptation of the transition cow. Nevertheless, as ruminal pH is also affected by neutralisation processes (Aschenbach et al., Reference Aschenbach, Penner, Stumpff and Gäbel2011), these factors might also contribute to rumen health and metabolic adaptation of periparturient dairy cows. We have recently demonstrated that transition dairy cows show different responses of ruminal pH despite similar feeding management (Humer et al., Reference Humer, Ghareeb, Harder, Mickdam, Khol-Parisini and Zebeli2015a), posing them at different risks of rumen fermentation disorders postpartum. Moreover, researches over the last years suggested a large variation among dairy cows in the release of stored energy from adipose tissues (Weber et al., Reference Weber, Hametner, Tuchscherer, Losand, Kanitz, Otten, Singh, Bruckmaier, Becker, Kanitz and Hammon2013; Rico et al., Reference Rico, Bandaru, Dorskind, Haughey and McFadden2015). Transition cows appear to use different strategies in acquiring and partitioning of nutrients and energy to support the homeorhetic adaptation, depending on the production level and energy deficit postpartum. The aim of the present study was to evaluate metabolic, endocrine and reticuloruminal pH changes in periparturient dairy cows experiencing variable lipolysis early postpartum.
Material and methods
Animals, housing and feeding
The trial was conducted at the Dairy Research Facilities of the Institute of Livestock Research, Agricultural Research and Education Centre Raumberg-Gumpenstein, Austria. A total of 30 (12 primiparous and 18 multiparous) pregnant cows (25 Holstein and five Simmental), were used in this longitudinal study. The length of the study was 5 weeks, starting from 14 days before expected calving until 21 days of postpartum. At the beginning of the trial, on day 14 prepartum, Holstein cows weighed 694±59.1 kg (mean±SD), whereas Simmental cows weighed 786±88.6 kg. Average lactation number was 2.00±1.22 in Holstein cows and 1.96±0.93 in Simmental cows, respectively. The difference between the expected day of calving and the real day of calving was −3.2±5.1 days.
All cows were fed the same forage-rich close-up diet during the 2 weeks prepartum and a fresh cow diet postpartum. Both diets were based on the same ingredients including good quality forages such as second cut meadow hay, corn silage and grass silage, whereas ground barley grain and a protein–mineral–vitamin supplement (PMV; mainly based on soybean and rapeseed meals) were provided as concentrates (Supplementary Table S1). The forage proportion (dry matter (DM) basis) in the close-up diet consisted in 31% meadow hay, 37% corn silage, and 32% grass silage, whereas the forage proportion of the fresh-lactation cow diet was 32% meadow hay, 36% corn silage and 32% grass silage. The concentrate proportion in the close-up diet consisted of 91% barley grain and 9% PMV, whereas the concentrate proportion in the fresh-lactation cow diet consisted of 85% barley grain and 15% PMV. The amount of concentrate in the diet was set at 1.5% on day 14 prepartum and increased daily by 1.2 percentage units, reaching inclusion levels of 40% (DM basis) at day 21 postpartum. The close-up diet met or slightly exceeded the requirements of pregnant cows for NEL and nutrients (GfE, 2001). The NEL and nutrient contents of the fresh-lactation cow diet were according to GfE (2001) guidelines.
Cows were fed forages and concentrates separately in Calan gates, being offered 110% of the average amount of feed consumed on the 3 preceding days (realized average daily feed refusals of 5% to 10%). Fresh feed was offered twice a day (0430 and 1600 h), whereby the cows received their forage portions first, followed by their concentrate allowance. Amounts of feed offered and refused were recorded each time to determine the feed intake of cows by difference. All cows had free access to water.
Cows were located in a free stall except when cows were housed in pregnancy pens (for 1 week before until 1 week after parturition) with straw bedding material. All procedures involving animal handling and treatment were in accordance with national regulations for animal use in research and approved by the local veterinary authority according to §9ff, Law for Animal Experiments (GZ FA10A-78Gu-19/2012-2).
Classification of cow groups according to body fat mobilization
All cows were monitored from week 2 before the expected calving up to week 3 after calving. Cows were retrospectively classified into three different fat mobilization groups based on mean NEFA concentrations in the serum on day 2 and day 21 after calving, using common risk thresholds for postpartal NEFA concentrations in dairy cows (Adewuyi et al., Reference Adewuyi, Gruys and Eerdenburg2005; Ospina et al., Reference Ospina, Nydam, Stokol and Overton2010; González et al., Reference González, Muiño, Pereira, Campos and Benedito2011). Cows were classified as Low, Medium, and High body fat mobilization group if serum NEFA concentrations were <0.4 mmol/l, between 0.4 and 0.7, and >0.7 mmol/l, respectively. The Low group pertained eight cows (seven Holstein, one Simmental), the Medium group had 11 cows (10 Holstein, one Simmental), whereas the High group consisted of 11 cows (eight Holstein, three Simmental). The Low group included three primiparous and five multiparous cows, the Medium group four primiparous and seven multiparous, and the High group five primiparous and six multiparous cows.
Feed sampling and chemical analyses
Feed and orts samples were collected daily. They were mixed and aliquots were used for analyses of nutrient composition. Dry matter was determined after oven-drying for 72 h at 55°C. The ground samples (1-mm screen) were analyzed for N using the Dumas combustion methodology; ether extract and ash were measured according to the official methods (VDLUFA, 2012). The NDF and ADF were determined using the methods described by Van Soest et al. (Reference Van Soest, Robertson and Lewis1991), with heat stable α-amylase used in the NDF procedure. The content of net energy of lactation (NEL) of all feeds was calculated based on their analyzed chemical composition and in vivo digestibility coefficients obtained from each feed in a sheep balance trial, as described previously (Gruber et al., Reference Gruber, Urdl, Obritzhauser, Schauer, Häusler and Steiner2014).
Blood sampling and analyses
Blood samples were collected shortly before the morning feeding from the coccygeal vein on experimental days −14, −4, 2 and 21 relative to calving. Serum 10 ml vacutainer tubes (Vacuette; Greiner Bio-One, Kremsmünster, Austria) were used to collect blood samples. Immediately after collection, blood samples were allowed to clot for 30 min at 25°C; subsequently serum was separated by centrifuging at 3000×g at 4°C for 20 min. Serum samples were stored at −20°C until analyses. Concentrations of serum amyloid A (SAA) and haptoglobin (Hp) were determined by commercially available ELISA bovine kits (Tridelta Development Ltd., Greystones Co. Wicklow, Ireland) according to the methods described previously (Humer et al., Reference Humer, Khol-Parisini, Gruber, Gasteiner, Abdel-Raheem and Zebeli2015b). In brief, serum samples for SAA were initially diluted 1 : 200, and samples with optical density values above the range of the standard curve were diluted further (1 : 400 or 1 : 250) and reanalyzed. No dilution was necessary for measurement of Hp. All samples were tested in duplicate and the optical density values were read by an iMark microplate absorbance reader (Bio-Rad Laboratories GmbH, Vienna, Austria) at 450 nm. The serum insulin level was measured using a commercially available ELISA kit (Monobind Inc., CA, USA). The concentrations of NEFA, β-hydroxybutyrate (BHB), glucose, blood urea nitrogen (BUN), total protein (TP), bile acids, bilirubin, cholesterol, lactate, calcium (Ca), phosphorus (P), cortisol and liver enzymes such as aspartate aminotransferase (AST), glutamate dehydrogenase (GLDH), and γ-glutamyltransferase (GGT) in the serum were measured by a conventional large-scale analyzer for clinical chemistry at the laboratory of the Central Clinical Pathology Unit, University of Veterinary Medicine, Vienna. Standard enzymatic colorimetric analyses were performed on a fully automated autoanalyzer for clinical chemistry (Cobas 6000/c501; Roche Diagnostics GmbH, Vienna, Austria). The intra-assay variation was controlled by limiting the coefficient of variation to ⩽10% for SAA, Hp and insulin and <5% for other blood variables.
The revised quantitative insulin sensitivity check index (RQUICKI) was calculated as RQUICKI=1/[log (glucose)+log (insulin)+log (NEFA)], as described by Holtenius and Holtenius (Reference Holtenius and Holtenius2007).
Milk data
Cows were milked twice daily at 0400 and 1500 h in a tandem milking parlor. Milk yields were recorded electronically and milk samples were collected from the morning and afternoon milking of cows until day 21 postpartum. Milk samples were analyzed for fat, protein, lactose, milk urea nitrogen (MUN) and somatic cell counts (SCC) by Milkoscan (Foss Electric, Hillerod, Denmark).
Reticuloruminal pH
To monitor rumen pH continuously over several days, all cows received an indwelled wireless pH-transmitting unit (smaXtec Animal Care Sales GmbH, Graz, Austria). These wireless pH-transmitting units (3.5 cm i.d., 12 cm long and weighing 210 g), validated previously (Klevenhusen et al., Reference Klevenhusen, Pourazad, Wetzels, Qumar, Khol-Parisini and Zebeli2014), were manually inserted into the reticulorumen via the esophagus on day 17 postpartum (Humer et al., Reference Humer, Khol-Parisini, Gruber, Gasteiner, Abdel-Raheem and Zebeli2015b). Before their use, the units were calibrated by a two-point calibration using a buffer of pH 4.0 and one of pH 7.0 following the company’s instruction protocol. The measurements of pH were taken continuously every 10 min and analyzed from day 18 to day 20 of lactation. Daily mean, minimal and maximal pH values as well as duration (min) and total area (pH×min) that pH was below thresholds of 5.8 and 6.0 were calculated per cow per day.
Measurement of BW, body condition score and energy- and protein balance
BWs were recorded daily on electronic scales after milking during the entire experiment. For BW changes, postcalving differences were calculated from week 2 and 3 relative to week 1. Body condition score (BCS) was recorded at 2 weeks before expected parturition as well as at 2 weeks thereafter using a scale from 1 to 5, including 0.25 points, where 1=thin and 5=extremely fat cow, and was always performed by the same trained person. The estimated balances of NEL and utilizable CP at the duodenum (uCP) were assessed on a weekly basis by comparing the individually measured intake in NEL and uCP to the corresponding individual demands for pregnancy and growth, milk production and estimated losses (Gruber et al., Reference Gruber, Urdl, Obritzhauser, Schauer, Häusler and Steiner2014).
Statistical analyses
Data were assesed by ANOVA using the MIXED procedure of SAS (version 9.2; SAS Institute Inc., Cary, NC, USA). For each response variable tested, the model included the fixed effects of day or week relative to calving, parity, and mobilization as well as the resulting two-way interaction between day or week relative to calving and mobilization. The breed was considered as random effect in the model. The data gained from the same cow but at different times were considered as repeated measures in the model with a first-order autoregressive variance-covariance matrix. Degrees of freedom were estimated with the method of Kenward–Roger. The PDIFF option was used in each of the comparisons with the Tukey method. The significance level was set at P<0.05, and a trend was considered up to the 0.05⩽P⩽0.10 level.
Results
Metabolic and endocrine changes
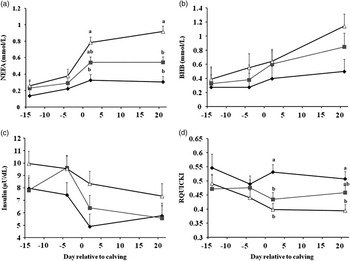
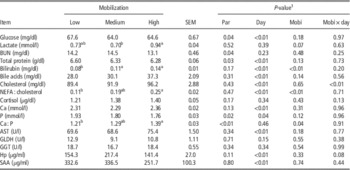
Results of the serum variables are shown in Table 1 and Figure 1. Serum NEFA concentrations (Figure 1a) were affected by both day relative to calving (P<0.01) and fat mobilization (P<0.01). While average NEFA concentrations remained below 0.4 mmol/l in all groups before calving, pronounced differences occurred thereafter, showing average concentrations of 0.32, 0.54 and 0.85 mmol/l in Low, Medium and High fat-mobilizing cows, respectively (P<0.05). Blood BHB concentrations were highest at day 21 (P<0.01), but remained without significant group differences (Figure 1b). A trend towards lower BHB concentrations was observed in primiparous compared with multiparous cows (P=0.07). Glucose concentrations were affected by sampling day (P<0.01) but not by mobilization degree, showing lowest concentrations on day 21. Furthermore, differences between parities revealed higher concentrations in primiparous (67.0±1.28 mg/dl) compared with multiparous (63.7±0.97 mg/dl) cows (P=0.04). Lactate concentration was higher in group High compared with Medium, but no difference was observed among other groups (Table 1).
Serum concentrations of non-esterified fatty acids (NEFA) (a), β-hydroxybutyrate (BHB) (b), insulin (c) and the revised quantitative insulin sensitivity check index (RQUICKI) (d) from week 2 before to week 3 after calving in cows with low ( , n=8), medium (
 , n=11), and high (
 , n=11) fat mobilization after calving. Data are presented as least squares means±standard errors. Statistically significant effects for mobilization are indicated by differing superscripts (P<0.05).

Serum variables measured from week 2 before to week 3 after calving in cows with low (n=8), medium (n=11) and high (n=11) fat mobilization after calving

BUN=blood urea nitrogen; NEFA=non-esterified fatty acids; Ca=calcium; P=phosphorus; AST=aspartate aminotransferase; GLDH=glutamate dehydrogenase; GGT=γ-glutamyltransferase; Hp=haptoglobin; SAA=serum amyloid A.
abDifferences among LSM at P<0.05.
1 Effect of parity (Par), day relative to parturition (Day), fat mobilization (Mobi), and interactive effect of fat mobilization and day relative to parturition (Mobi×day).
The BUN and TP concentrations did not differ among groups, but were lower in primiparous compared with multiparous cows (P<0.05). The TP concentrations were additionally affected by sampling day with highest concentrations on day 21 postcalving (P<0.01). Concentrations of bilirubin were lower (P<0.01) in group Low (0.08±0.019 mg/dl) compared with Medium and High (0.11±0.019 and 0.14±0.016 mg/dl, respectively). Furthermore, higher concentrations were measured at day 2 postcalving compared with the other sampling days (P<0.01). The concentration of bile acids increased linearly after calving (P<0.01). Blood cholesterol concentrations were highest at day 21 (P<0.01) and were interactively affected by mobilization and sampling day (P<0.01), showing a trend for higher concentrations in group High compared with group Low at day 21. The ratio of NEFA to cholesterol was higher in group High compared with Low (P<0.01) and was also affected by day, showing highest values at day 2 compared with the other sampling days (P<0.01).
Blood cortisol concentrations were influenced neither by sampling day nor by parity or fat mobilization. Blood insulin concentrations decreased (P<0.01) after calving and were higher (P=0.04) in cows of group High compared with Low (Figure 1c). Furthermore, an effect of parity was noticed (P<0.01), showing lower insulin concentrations in primiparous (6.55±1.07 μU/dl) compared with multiparous (8.6±0.98 μU/dl) cows. Data of RQUICKI were higher in group Low compared with Medium and High (P<0.01, Figure 1d).
The concentrations of serum Ca and P were affected by sampling day showing lowest concentrations at day 2 (P<0.05), and primiparous cows had higher P concentrations (1.91±0.08 mmol/l) than multiparous cows (1.75±0.07 mmol/l, P<0.05), which resulted in a lower ratio of Ca : P in primiparous (1.21±0.08) than multiparous (1.38±0.07) cows (P<0.01). Furthermore, a higher Ca : P ratio was observed in group High compared with Low (P=0.04).
The blood concentrations of the liver enzymes AST, GLDH and GGT were neither affected by mobilization, nor by parity. Solely an influence of sampling day for AST revealed elevated levels after calving (P<0.01).
The acute phase proteins (APP) Hp and SAA were not influenced by mobilization. However, a trend towards an interaction between mobilization and day was observed for Hp (P=0.08) with lower concentrations in group Low compared with group Medium at day 2. Haptoglobin and SAA were affected by day, showing elevated levels at day 2 (P<0.01).
Feed intake and reticuloruminal pH
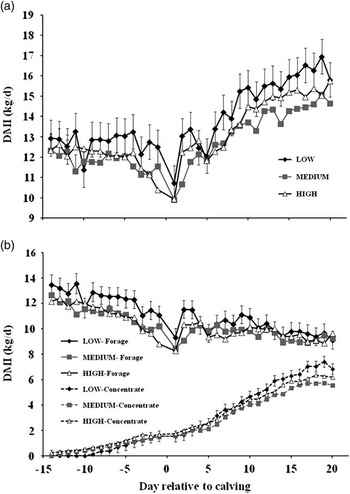
Dry matter intake (DMI) increased after calving, and was higher in multiparous (14.7±0.45 kg DM/day) compared with primiparous cows (11.7±0.49 kg DM/day, P<0.01). Cows of the Low group tended to show greater overall DMI compared with their Medium counterparts (P=0.07), but did not differ with High group (Figure 2a). The Low group cows showed greater (P=0.03) DMI of forages prepartum, compared with both other groups, and tended to increase (P=0.09) concentrate intake only postpartum and only compared with Medium group (Figure 2b).
Daily feed intake (a), and separate daily intake of forage and concentrate (b) from wk 2 before to week 3 after calving in cows with low (n=8), medium (n=11), and high (n=11) fat mobilization after calving. Data are presented as least squares means±standard errors.

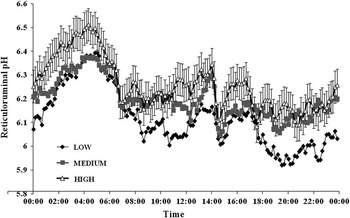
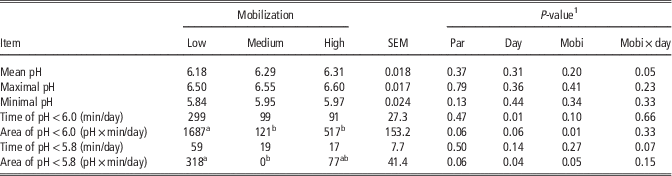
Data of reticuloruminal pH are summarized in Table 2. Cows with lowest mobilization showed a trend (P=0.10) for higher duration of pH<6.0 (299 min/day) compared with other groups (99 and 90 min/day for Medium and High groups, respectively). Daily mean pH values as well as the time spent below pH 5.8 showed a trend for interaction between mobilization and day, too (P⩽0.07). Largest area of pH below 6.0 and 5.8 were found in group Low (P⩽0.05). Multiparous cows showed a trend towards larger areas for pH below 6.0 (1200±466 in multiparous and 351±597 in primiparous, P=0.06) and 5.8 (234±66 in multiparous and 25±87 in primiparous, P=0.06) compared with primiparous cows. However, no differences were noticed between primi- and multiparous cows for the remaining variables related to the reticuloruminal pH. Diurnal pH dynamics on an exemplary day (day 19 after parturition) are shown in Figure 3. The pH profile showed that the highest pH was measured just before the morning feeding and the lowest late after the feeding in the afternoon. On this day, lower pH values were measured in the group Low compared with the other groups (P<0.01, Figure 3).
Diurnal pH dynamics on day 19 after calving in cows with low (n=8), medium (n=11), and high (n=11) fat mobilization after calving. Data are presented as least squares means±standard errors.

Reticuloruminal pH in cows with low (n=8), medium (n=11) and high (n=11) fat mobilization after calving

1 Effect of parity (Par), measurement day (Day), fat mobilization (Mobi), and interactive effect of fat mobilization and measurement day (Mobi×day).
Milk production and composition
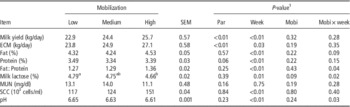
Milk yield and ECM yield increased with increasing distance to calving (P<0.05), were higher in multiparous compared with primiparous cows (P<0.01), but were not affected by fat mobilization (Table 3). Milk fat and protein concentration, as well as the ratio between them, showed no differences among different fat mobilizing cows. Overall, lowest milk fat concentrations were measured in week 3 (P<0.01) and milk protein concentration decreased linearly with increasing distance to calving (P<0.01), thus resulting in an increased fat-to-protein ratio in week 2 and 3 compared with week 1 (P<0.01). A trend for higher milk protein concentrations was found in multiparous compared with primiparous cows (P=0.06). Milk lactose concentration was lower in week 2 compared with week 3 (P=0.01) and was interactively affected by week and fat mobilization (P=0.02), showing higher concentrations in Low cows compared with High cows at the onset of lactation. Overall, a trend towards higher lactose concentrations were measured in Low compared with High cows (P=0.09). No difference in MUN was found between mobilization groups as well as between primiparous and multiparous cows. The SCC was affected by week, showing lower values in week 3 compared with the first 2 weeks of lactation (P<0.01), but no differences with regard to parity and mobilization occurred. Milk pH was solely affected by week (P<0.01), showing increasing values as lactation proceeded (P<0.01).
Milk production and composition during the first 3 weeks in milk in cows with low (n=8), medium (n=11) and high (n=11) fat mobilization after calving

ECM=energy-corrected milk; MUN=milk urea nitrogen; SCC=somatic cell count.
a,bDifferences among LSM at P<0.05.
1 Effect of parity (Par), week after parturition (Week), fat mobilization (Mobi) and interactive effect of fat mobilization and week after parturition (Mobi×week).
Energy and protein balance, BW, body condition score and postpartal changes of BW
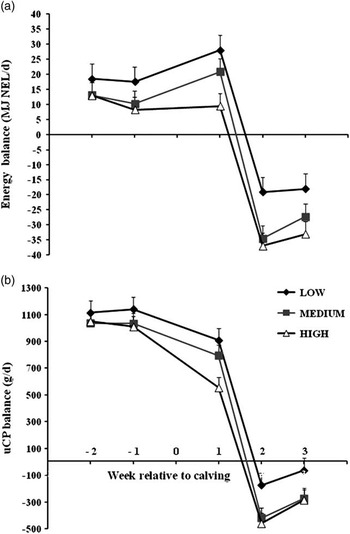
The estimated NEL-balance tended to be 5.9 MJ lower in primiparous than multiparous cows (P=0.10) and was lowest in week 2 and 3 (P<0.01). Furthermore, a significant effect of mobilization was observed (P=0.02, Figure 4a), showing lower NEL-balance in High cows compared with Low cows. The estimated uCP-balances were affected by parity (106 g uCP per cow and day higher deficit in primiparous compared with multiparous cows; P=0.08), week (P<0.01) and mobilization (P=0.03), showing higher values in Low compared with High cows (Figure 4b).
Estimated balance of net energy of lactation (NEL) (a) and utilizable crude protein at the duodeneum (uCP) (b) balance from week 2 before to week 3 after calving in cows with low (n=8), medium (n=11), and high (n=11) fat mobilization after calving. Data are presented as least squares means±standard errors.

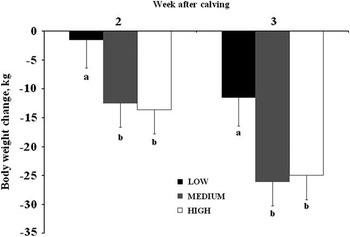
The BCS showed no differences among lipolysis groups before parturition (3.15±0.33 in Low, 3.43±0.33 in Medium and 3.40±0.32 in High, respectively) as well as after calving (3.01±0.33 in Low, 3.22±0.33 in Medium and 3.09±0.32 in High, respectively), respectively (P=0.19). Furthermore, no differences between parities were observed (P=0.37). Mean BW was on average 70.1 kg higher in multiparous compared with primiparous cows (P<0.01), but not affected by mobilization (P=0.62, Supplementary Figure S1). Overall, BW decreased linearly after calving (P<0.01) with multiparous cows being heavier (717.5±47.0 kg) compared with primiparous cows (647.5±47.9 kg) (P<0.01). The BW changes are shown in Figure 5. Significantly higher BW losses during week 2 and 3 were observed in group Medium and High compared with Low (P<0.05, Figure 5).
Relative changes of BW from week 1 to week 2 and week 3 after calving in cows with low (n=8), medium (n=11), and high (n=11) fat mobilization after calving. Data are presented as least squares means±standard errors. Statistically significant effects for mobilization are indicated by differing superscripts (P<0.05).

Discussion
The present study evaluated metabolic, endocrine and reticuloruminal pH changes in periparturient dairy cows experiencing variable lipolysis postpartum. The lipolysis typically is triggered by the need to counteract the deficit of cows for energy postpartum. In our study, the deficits in NEL and uCP were least pronounced in the Low group which also tended to have greater DMI than the others. However, these deficits were at about the same level for Medium and High groups at 2 and 3 weeks postpartum. While serum glucose levels did not differ, the deficit in energy triggered an increased release of NEFA and also lactate concentration in the High group, as compared with Medium group cows. An overall sparing activity of glucose and an increased utilization of lactate is part of the metabolic adaptation of cows to generate metabolic fuels for early lactation (De Koster and Opsomer, Reference De Koster and Opsomer2013). This metabolic adaptation strategy seems to be used by Low and High group cows similarly, to generate their metabolic fuels. However, in contrast to Low cows, which increased their DMI to combat the energy deficit, the High group cows increased the mobilization of fat tissues to balance their increased energy demand, which is reflected by significantly higher NEFA in the blood of the latter cows. In the present study, cows of the High group reached average circulating levels of NEFA of ~1.0 mmol/l, which is more or less comparable with the levels of fat mobilization reported in high-yielding cows (Weber et al., Reference Weber, Hametner, Tuchscherer, Losand, Kanitz, Otten, Singh, Bruckmaier, Becker, Kanitz and Hammon2013).
One source of lactate in the serum is rumen fermentation, especially when easily fermentable carbohydrates are fermented by rumen microbes at low pH (Aschenbach et al., Reference Aschenbach, Kristensen, Donkin, Hammon and Penner2010 and Reference Aschenbach, Penner, Stumpff and Gäbel2011). Because cows of the High group tended to have a higher ruminal pH than those of Low group, it is not justified to assume that ruminal fermentation intensity and ruminal lactate output was greater in High cows to contribute to the increased levels of serum lactate. Another source of lactate is the anaerobe oxidation of glucose occurring in the skeletal muscles and other peripheral tissues, which is known to be enhanced during early lactation (De Koster and Opsomer, Reference De Koster and Opsomer2013). Hepatic gluconeogenesis is one major pathway to clear lactate from the systemic circulation; however, lactate appears to be a glucogenic substrate that is rather easily displaced from gluconeogenesis when available precursors exceed the catalytic capacity to utilize them (Aschenbach et al., Reference Aschenbach, Kristensen, Donkin, Hammon and Penner2010). Thus, higher lactate concentrations in the blood of cows in the High group might be due to either an increased anaerobe generation of lactate by peripheral tissues, or lower utilization of lactate in the gluconeogenesis of these cows.
Cows of the Low group also showed a better sensitivity to insulin compared with the Medium and High groups, as measured by RQUICKI. The differing response concerning insulin sensitivity among High v. Low groups was comparable with results reported recently for high-yielding cows experiencing different degrees of lipolysis in the peripartal period (Weber et al., Reference Weber, Hametner, Tuchscherer, Losand, Kanitz, Otten, Singh, Bruckmaier, Becker, Kanitz and Hammon2013; Rico et al., Reference Rico, Bandaru, Dorskind, Haughey and McFadden2015). The lower insulin sensitivity during the periparturient period enhances the availability of glucose, fatty acids and amino acids to the mammary gland (Bell, Reference Bell1995); however, exaggerated insulin resistance promotes excessive adipose tissue lipolysis, thus exposing cows to metabolic dysfunctions (Hayirli et al., Reference Hayirli, Keisler, Doepel and Petit2011). In our study, the cows that experienced the highest degree of lipolysis showed not only lower insulin sensitivity and higher NEFA concentrations, but also a greater NEFA to cholesterol ratio, which exceeded the cut-off point suggested for a higher risk for fatty liver development (>0.2; Mostafavi et al., Reference Mostafavi, Seifi, Mohri and Jamshidi2013) in cows as early as day 4 prepartum. In addition, postpartal NEFA of >0.57 mmol/l, which is below the values measured in the High group of the present study, have been suggested as a threshold to increase the risk of metabolic disorders in dairy cows (Ospina et al., Reference Ospina, Nydam, Stokol and Overton2010).
It is known that although the release of NEFA into the blood provides energy to various body tissues, excessive amounts might become toxic due to the limited capacity of the bovine liver to metabolize NEFA (Emery et al., Reference Emery, Liesman and Herdt1992). When the limit is reached, TAG accumulate in the liver, and acetyl CoA that is not utilized in the tricarboxylic cycle is converted into ketone bodies, such as acetoacetate, acetone and BHB (Nelson and Cox, Reference Nelson and Cox2005). Overall, there were no significant differences in serum BHB concentrations among the three groups of the present study. Nonetheless, at day 21 postpartum cows in the High group had average BHB values twice as high as those of the Low group and close to literature threshold values for subclinical ketosis (1.2 to 1.4 mmol/l; McArt et al., Reference McArt, Nydam, Oetzel, Overton and Ospina2013). This means that several High cows experienced subclinical ketosis at week 3 postpartum; whereas, subclinical ketosis was a rare event in Low cows. These considerations support the view that excessive lipomobilization generally favors hyperketonemia (McArt et al., Reference McArt, Nydam, Oetzel, Overton and Ospina2013) but may not necessarily be linked to elevated BHB concentrations and subclinical ketosis in the individual animal (González et al., Reference González, Muiño, Pereira, Campos and Benedito2011).
It is well-known that metabolic stresses associated with NEB during early lactation primarily afflict liver activity (Bobe et al., Reference Bobe, Young and Beitz2004). An extreme lipid mobilization from adipose tissues that exceeds the metabolizing capacity of the liver can affect cellular integrity and function of the liver, finally being reflected in elevated concentrations of enzymes that indicate liver injury (AST, GGT and GLDH) as well as bile constituents like bilirubin and bile acids in the blood (Bobe et al., Reference Bobe, Young and Beitz2004; Geelen and Wensing, Reference Geelen and Wensing2006). Furthermore, increased concentrations of liver TAG are accompanied by decreased concentrations of structural lipids, like free cholesterol (Bobe et al., Reference Bobe, Young and Beitz2004). In the present study, higher bilirubin concentrations were measured in cows that experienced higher degrees of lipolysis, but corresponded with reference values reported in literature (Cozzi et al., Reference Cozzi, Ravarotto, Gottardo, Stefani, Contiero, Moro, Brscic and Dalvit2011). Also, the differing fat mobilization among groups did not affect the activity of the liver enzymes AST, GLDH and GGT, which were within reference intervals, too (Wille et al., Reference Wille, Simon, Platen and Oertel2010). Thus, the cows in the present study did not seem to suffer from any measurable depression of liver function and/or liver damage.
A larger area for pH below 6.0 and 5.8 as well as a tendency for extended duration of reticuloruminal pH below 6.0 in the Low group indicates an increased ruminal fermentation intensity such as greater accumulation of short-chain fatty acids (mainly acetate, propionate, butyrate and valerate) in the rumen fluid, but also suggests a greater risk for the latter cows to develop subacute rumen acidosis (Zebeli et al., Reference Zebeli, Aschenbach, Tafaj, Boguhn, Ametaj and Drochner2012 and Reference Zebeli, Ghareeb, Humer, Metzler-Zebeli and Besenfelder2015). The reason for the lower pH of the Low group can be due to an increased DMI found in this group of cows. Because ruminal pH is a product of both fermentation and neutralization processes, with chewing activity and inherent absorption and metabolization capacity of the rumen epithelium playing a role (Aschenbach et al., Reference Aschenbach, Penner, Stumpff and Gäbel2011), these factors might also have contributed to the differences in ruminal pH among groups.
An enhaced rumen fermentation provides important glucogenic precursors for the early lactation cows, whereby propionate and valerate are directly used to support gluconeogenesis in cows (Aschenbach et al., Reference Aschenbach, Kristensen, Donkin, Hammon and Penner2010). Thereby, enhanced fermentation characteristics may link to a better metabolic and endocrine adaptation in the Low cows. Nonetheless, the elucidation of the underlying mechanisms behind the role of reticuloruminal pH and fermentation in metabolic adaptation during transition period needs futher investigations.
Overall, the differences in lipid mobilization and energy deficits were not accompanied by differences in BW and BCS, which is in accordante with Kessel et al. (Reference Kessel, Stroehl, Meyer, Hiss, Sauerwein, Schwarz and Bruckmaier2008), who found no differences in BW, BCS and backfat-thickness in dairy cows differing in postpartal fat mobilization until 6 weeks postpartum. Thus, observed variability between the groups support the notion that other factors than nutrition and housing affect the individual capacity to cope with metabolic stress, too. The observed differences are thus likely to be attributable to genetic or epigenetic differences, or both (Henricson et al., Reference Henricson, Jonsson and Pherson1977). Additionally, rumen bacterial metagenomic regulation might also contribute to the differing responses to counteract the acute energy deficit at the onset of lactation (Kessel et al., Reference Kessel, Stroehl, Meyer, Hiss, Sauerwein, Schwarz and Bruckmaier2008).
Conclusions
The present study revealed differences in various metabolic and endocrine responses of postpartum cows kept within the same feeding management conditions but experiencing different degrees of lipolysis postpartum. Although all cows had similar levels of blood glucose and milk production, they showed different levels of circulating NEFA, differed in insulin sensitivity and in the concentration of lactate. The degree of lipolysis was not reflective of the rather similar deficits of NEL and uCP in High and Medium cows, but mirrored the lower NEL and uCP deficits in the Low group. The latter cows seemed to regulate their homeorhesis by an increase of DMI which alleviated the energy deficit and BW loss. Furthermore, reticuloruminal pH was lower in these cows, which indicates greater ruminal fermentation intensity, potentially ameliorating the metabolic status of the latter cows. In this respect, more research is warranted to determine the role of rumen fermentation in the metabolic adaptation of high-producing dairy cows and, in particular, in finding a balance between prevention of rumen fermentation disorders and excessive lipolysis in periparturient dairy cows.
Acknowledgments
The authors acknowledge the assistance of S. Gschaider, A. Rudischer, A. Dockner, M. Wild and S. Leiner (Institute of Animal Nutrition and Functional Compounds, University of Veterinary Medicine, Vienna) with the animal trial and laboratory analyses. The authors thank the staff of the research station at AREC Raumberg-Gumpenstein for their care to the cows as well as A. Schauer and A. Adelwöhrer for their excellent help in data collection and preparation. This research was supported by the collaborative project ADDA (ADvancement of Dairying in Austria) of Austrian Research Promotion Agency (FFG), which are highly acknowledged.
Supplementary Material
To view supplementary material for this article, please visit http://dx.doi.org/10.1017/S1751731116000859