

1. INTRODUCTION
1.1. Context and objective
The vessel traffic service (VTS), which was first implemented in 1948 for the efficient and safe access of vessels to port areas, has been expanded with the development of technology and its importance is growing (IALA, 2016). VTS provides the following three services to ships and for the safety and efficiency of the port area: information service, traffic organisation, and navigation assistance. VTS is provided in a variety of ways through very high frequency (VHF) radio, phone, fax, e-mail, and automatic identification system (AIS), but VHF radio plays the most important role in VTS communication (Nautical Institute, 2018). In the case of VHF radio, there is a frequency assigned to each zone, and communication is possible using the frequency allocated between the ship and the VTS.
Communication by VHF radio is composed of the sender's message transmission and the receiver's understanding and feedback, which can be termed a two-way communication. Because VHF radio is a two-way communication, it is difficult for other participants to intervene in the middle of a conversation. Therefore, communication via VHF radio can be understood as a type of queuing system. The queue is a theory that studies the optimal scale of service facilities by using the probability of arrival time of a customer, service time, etc., and comprises the customer's arrival process, service time and server (Lee, Reference Lee1998). If the queuing theory is applied to the VTS, then the VHF communication arrival probability, the distribution of communication time, and the number of communication channels become components, and the service performed through the VHF communication in the VTS area can be analysed quantitatively.
The purpose of this study is to analyse quantitatively the status of VHF radio communication in ports using the queuing theory and to suggest ways to reduce communication congestion for safe and efficient maritime traffic management. For this aim, we analysed VHF communications during four days in Busan Port, South Korea, which has the largest number of incoming and outgoing vessels in the country. We proved that VHF communication in the port follows the queue model and suggest three ways to improve the congestion level for urgent communication and reduce the congestion of communication at the Busan Port VTS Centre. However, the limitation of the research is that the study was conducted with data available over a relatively short period of time (four days) at a single port; based on this basic research, more data will be analysed in the future.
1.2. Literature review
Given that a ship communicates using the designated channel in the VTS area, the movement of the ship in the port and the control pattern of the VTS officer can be known through analysis of the VHF channel. Therefore, the study of VHF communications is an active analysis. IALA states that effective VTS VHF communications directly contribute to navigational safety and efficiency (IALA, 2017a). The IALA Workshop also addressed the modification of the VTS section of the SMCP (Standard Marine Communication Phrases) for VTS phrase and voice communication standards, the development of communication guidelines, and the need for training (IALA, 2017b, 2019). Armacost (Reference Armacost1977) used queues to analyse communications in the New York Harbor VTS area quantitatively. The arrival rate of the message is presumed through the entry/exit of the ship, the location of the reporting point, and the number of vessels encountered in the control area. The communication time is based on data from San Francisco Harbor, and communication within the VTS area proved to follow the queue. Park et al. (Reference Park, Cho and Seo2012) analysed VHF communications for 24 h in Incheon Port to analyse quantitatively the inhibition factor of VHF communication efficiency. It was found that the faster the initial response and the less frequent the occurrence of retransmission, the higher the communication efficiency. Kim (Reference Kim2015) analysed the VTS communication data in Busan North Port for three days to identify the risk factors in the VTS area. It was found that it was difficult to communicate in the port at certain times, and there was excessive communication in port transportation business, such as refuelling boats and towboats. It was also revealed that the control techniques of the VTS officers are subjective. Park and Park (Reference Park and Park2016a) provided appropriate control intervention distances and risk of collision for each vessel encounter situation in the VTS area to quantify the subjective control techniques of the VTS officers. Park and Park (Reference Park and Park2016b) calculated the risk of vessel collision in an encounter situation involving VTS officer intervention by communication analysis in the Busan North Port control area and proved that the interval of occurrence of a risk situation in which the VTS officer intervenes follows an exponential distribution. Another paper proposed a VTS decision support system to prevent collision between vessels and to provide an optimal route for ships (Kao et al., Reference Kao, Lee, Chang and Ko2007; Tsou et al., Reference Tsou, Kao and Su2010; Szlapczynski, Reference Szlapczynski2011). This study carries out a quantitative analysis using real communication data and differs from the existing VHF communication analyses in that it proposes a quantitative improvement of the congestion communication time.
Queuing in port areas, where waiting times can be calculated quantitatively, has been extensively researched. Jang (Reference Jang1991) proposed the waiting time per vessel as a service index of the port and suggested that the estimation equation can be used when the distributions of arrival time and service time indicate the Erlang distribution. Baek (Reference Baek1998) analysed the arrival form of the ship and the dock service time by applying the queuing theory and found the relationship between the average berth occupancy and the expected waiting time of the vessel. Lee et al. (Reference Lee, Kim, Kim and Jeong2015) calculated the waiting rate and berth occupancy of a port as a way to develop the service index of the port. According to this calculation, the waiting rate in Pohang Port was high owing to the presence of general cargo ships and bulk carriers, and the berth occupancy rate was also high in Pohang New Port. Lee and Park (Reference Lee and Park2018) used the terminal operating data to derive the difference between the theoretical queue and the actual waiting rate and found that there was a large difference between the theoretical calculation and the actual condition. Hess et al. (Reference Hess, Kos and Hess2007) proved that the operation of a bulk cargo handling terminal followed the queue model. The proposed model was applied to the actual bulk terminal which confirmed that it was helpful in decision making for efficient operation. Park et al. (Reference Park, Park and Park1999) analysed the BCTOC container entry and departure system in 1989 through queuing theory and simulation. They systematised the container terminal cargo handling system as a queue model and compared it with the simulation result. Koo (Reference Koo1997) considered the time required by a ship to move to the appropriate safety distance when using the route as service time and calculated the congestion of the route using the queuing theory.
The existing studies have focused on ships using ports and have applied the queuing theory, but no study has addressed the intangible communication service in ports. This study quantitatively analyses the VTS communication, which is one of the services of a port, through queuing and suggests an improvement plan to reduce the congestion of the radio communication channel.
1.3. Definitions and regulations of VTS
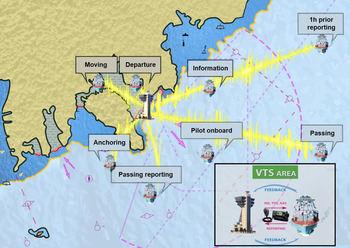
The International Maritime Organization (IMO) defines the VTS as ‘a service provided by the Competent Authority to improve the safety and efficiency of ship traffic and to protect the environment, which can interact with and respond to traffic conditions occurring within the VTS area’ (IMO, 1997). Chapter 5, regulation 12, of the International Convention for the Safety of Life at Sea states that VTS contributes to the safety of life at sea, safety and efficiency of navigation, and protection of the marine environment, adjacent shore areas, work sites, and offshore installations from possible adverse effects of the maritime traffic. The International Association of Marine Aids to Navigation and Lighthouse Authorities (IALA) defines the VTS as ‘a service carried out by the computer authority to provide the safety and efficiency of the message traffic and protection of the environment’ as defined in IMO. These services are required to interact with the vessels within the VTS area to cope with traffic conditions. This implies that interaction with the vessel is a prerequisite for the VTS to function properly (IALA, 2016). Article 2 (Definitions) of the Maritime Safety Act of the Republic of Korea states that, ‘monitoring movements of vessels and providing vessels with safety-related information by installing and operating equipment capable of detecting the location of each vessel and communicating with vessels so as to promote safety and efficiency in marine traffic and protect marine environment and facilities.’ There are three main types of information security services.Footnote 1 (1) The traffic information service (INS) ensures that essential information is available in time for onboard navigational decision making. (2) The traffic organisation service prevents dangerous maritime traffic situations from developing, achieving safe and efficient movement of vessel traffic within the VTS area. (2) The navigational assistance service assists onboard navigational decision making and monitors its effects. In the VTS area, the VTS provides the communication service, and the ship passes the feedback on the provided service through a series of processes. In other words, the VTS establishes communication facilities and interacts with ships to achieve its effective purpose. Given that information is provided only through intangible communications, it is necessary to analyse the communications in the VTS area accurately as it will be able to confirm what kind of effort the VTS makes for the safety of the port. Figure 1 shows the concept of VTS-to-ship communication within the VTS area. Within the VTS area, various reporting and control services are provided through VHF. The designated frequency is fixed within particular zones of the VTS area. Therefore, there is no limit to the customers (vessels) that require the service, but the service channel is limited.
VHF communication concept in the VTS area.

2. METHOD: COMMUNICATION ANALYSIS USING THE QUEUE MODEL
2.1. Queuing
A queue is a line of customers who wait for a service provider to satisfy a service demanded by individual customers in the service facility. Therefore, to understand the situation of queues, we need to observe two basic behaviours: arrival of customers and provision of services. The focus of attention is, consequently and as a result of the interaction of these two behaviours, how many customers are in the queue system and how much time they have spent in it. Therefore, from the customer's point of view, the number of new customers participating will be of concern, and in terms of providing the service, the number of customers leaving the service will be a problem. The queuing theory can be interpreted as the expression of various phenomena by considering the distribution of the arrival and service rates against a statistical probability model. The characteristic elements of the queue can be expressed in the following way (Lee, Reference Lee1998):
 $$(x/y/z):(u/v/w)$$
where
x = arrival distribution,
y = service time (or departures) distribution,
z = number of parallel servers (z = 1, 2, …, ∞),
u = service discipline,
v = maximum number allowed in system (v = 1, 2, …, ∞), and
w = size of calling source (w = 1, 2, …, ∞).
Arrival distribution and service time are M for the Poisson distribution, D for the constant time interval, Ek for the Erlang distribution of order-k, K for the chi-square distribution, and HE. If the specific distribution type is not seen, the arrival rate is GI and the service rate is G. Service discipline is classified as: first come first served, last come first served, service in random order, shortest processing time, and general service discipline. In this study, the actual communication in the VTS area is applied to the M/G/1 model (Armacost, Reference Armacost1977). M/G/1 model is that the arrivals have a Poisson distribution, the service time is characterized by a general distribution, and with a single server.
2.1.1. Arrival process
If the arrival process follows the Poisson distribution, the following can be applied. Define
 $$p_n (t)=p[n\ \mbox{arrivals in the time interval}(0,t)].$$
The assumptions of the Poisson process are
 $$\begin{aligned} & p_1 (h)=\lambda \Delta t+o(\Delta t)\mbox{ where}\ \lambda \ \mbox{is a constant}, t\ge 0\ \mbox{and}\ \mathop {\lim }\limits_{\Delta t\to 0} o(\Delta t)=0, \\ &\mathop {\lim }\limits_{\Delta \mbox{t}\to 0} p_{n>1} (\Delta t)=0. \end{aligned}$$
The above probabilities are independent, so they have ‘no memory’ property. The probability p n(t + Δt), Δt → 0 could be expressed as
 $$\begin{aligned} p_n ( {t+\Delta \mbox{t}} )&= p_n ( t )[{1-\lambda \Delta \mbox{t}} ]+p_{n-1} ( t )\lambda \Delta \mbox{t}, \\ p_0 ( {t+\Delta \mbox{t}} )&= p_0 ( t )[{1-\lambda \Delta \mbox{t}} ]. \end{aligned}$$
The equations may be written in this way
 $$\begin{aligned} \frac{p_n ( {t+\Delta \mbox{t}} )-p_n ( t )}{\Delta \mbox{t}}&=-\lambda p_n ( t )+\lambda p_{n-1} ( t ),\\ \frac{p_0 ( {t+\Delta \mbox{t}} )-p_0 ( t )}{\Delta \mbox{t}}&=-\lambda p_0 ( t ). \end{aligned}$$
Because of the small Δt, the terms on the left sides may be considered as derivative:
 $$\begin{aligned} &\mathop {\lim }\limits_{\Delta \mbox{t}\to 0} \frac{p_n ( {t+\Delta \mbox{t}} )-p_n ( t )}{\Delta \mbox{t}}=-\lambda p_n (t )+\lambda p_{n-1} ( t ), \\ &\mathop {\lim }\limits_{\Delta \mbox{t}\to 0} \frac{p_0 ( {t+\Delta \mbox{t}} )-p_0 ( t )}{\Delta \mbox{t}}=-\lambda p_n (t ). \end{aligned}$$
that is,
 $$\begin{aligned} \frac{dp_n ( t )}{dt}&= -\lambda p_n ( t )+\lambda p_{n-1} ( t ), \\ \frac{dp_0 ( t )}{dt}&= -\lambda p_0 ( t ). \end{aligned}$$
These equations represent a set of differential equations, with the solution
 $$p_n ( t )=\frac{( {\lambda t} )^n}{n!}e^{-\lambda t},\quad n=0, 1, 2\ldots$$
where
n = number of occurrences of the event,
λ = average number of occurrences per unit time.
2.1.2. Queuing result
The values that can be derived from the M/G/1 model are as follows:
Average arrival rate (average number of customers arriving per unit time): λ
Average service rate (average of customers receiving service per unit of time): μ
The probability of using the system or the number of customers receiving service at any point in time:
 $$\rho =\lambda/\mu$$
Average number of customers in queue:
 $$L_q =\frac{\lambda ^2E( {S^2} )}{2( {1-\rho } )}$$
Average number of customers in the system:
 $$L_s =\rho +L_q$$
Average waiting time on the queue:
 $$W_q =\frac{L_q }{\lambda }$$
Average time spent in the system (service hours):
 $$W_s =W_q +\frac{1}{\lambda }$$
2.2. Study subjects
2.2.1. Research scope
As described above, the VTS communication is performed by mutual communication between the VTS officer and the ship's operator. Therefore, it is expected that there will be a strong relationship between the number of incoming ships to the port and the VTS communications. To confirm this, we examined the correlation between the number of VTS communications per hour in Busan Port and the number of inbound and outbound vessels per hour (Figure 2). A Pearson correlation analysis showed that there was a correlation with p-value 0·000, and the correlation coefficient was 0·691, indicating a positive correlation. In other words, a port with numerous inbound and outbound vessels means a large number of VTS communications (Figure 2). Therefore, for this study, we selected Busan Port, which has the largest number of inbound and outbound vessels among ports with VTS in South Korea (Ministry of Oceans and Fisheries, 2019) (Table 1), for a quantitative VTS communication analysis. The communication channels of Busan Port are VHF channel 12 (Busan North Port), 09 (Gamcheon Port), 10 (Busan New Port), and 16 for emergency (Figure 3). In this study, the research was limited to channel 12.
Correlation between the number of communications and arrival and departure of ships.

Study area (Busan Port).

Ship arrival/departure status of South Korean ports with VTS.

2.2.2. Research data collection
Inoue and Hara (Reference Inoue and Hara1973) suggested that at least three days of surveillance survey work would be necessary to obtain representative populations. Based on this, we listened to the VHF channel 12 of Busan North Port area for four days (96 h) from 15:00 on 11 December to 16:00 on 15 December 2015. The data collection process is shown in Figure 4. We had listened to the data recorded at the same time in order to double check and arrange the data. The data was summarised in terms of: communication start time, communication end time, time duration, contents, and subject of communication start.
Data analysis process.

3. RESULTS: COMMUNICATION STATUS OF BUSAN NORTH PORT AREA
3.1. Number of communications by time slot
The graph in Figure 5 shows the number of communications (in a four-day cumulative period) by time slot. The communication time was divided into day time (06:00 to 19:00) and night time (19:00 to 06:00). In the day time, there was an average of 52·71 communications per hour, and at night time, there was an average of 24·79 communications per hour; thus, there were 2·12 times more communications during day time than during night time. Therefore, in this study, we analysed the day time time as peak time and the night time as non-peak time.
Number of communications by time slot (hours).

3.2. Communication contents
Communications in the VTS area were classified according to the sender, when the ship was communicating with the VTS, when the VTS was communicating with the ship, and when the ship was communicating with another ship (Figure 6(a)). Of the 3387 communications in four days, 2879 (75%) were contacts from ship to VTS, 578 (15·1%) were contacts from VTS to ship, and 376 (9·8%) were contacts between ships. When a ship contacts the VTS (the highest percentage), the route of departure, passing, moving, entry, inquiry, pilot, anchor, and ship can be classified (Figure 6(b)). The number and percentage of communications were as follows: arrival communications 826 (28·7%), passing communications 517 (18·0%), moving communications 510 (17·7%), departure communication 452 (15·7%), inquiry communications 256 (8·9%), pilot communications 225, (7·8%), anchoring communications 54 (1·9%), and intention communications 39 (1·4%). According to the reporting time and report contents of vessels to be controlled by each centre, the vessels are required to report their identification in the Busan Port VTS area. The types of identification report are as follows: passing report, arrival report (including forecast), and departure report (including forecast) (Legislation, 2019]). In other words, 2359 cases (61·4%) of the total communications were found to be ship identification reports.
Classification by contents of communication: (a) classification by sender, (b) contents of vessel starting communication.

3.3. Communication arrival rate
The Poisson distribution is a probability distribution with the number of events occurring in unit time as a random variable. In this case, let t be the time until the next event occurs, and let the random variable be the frequency of occurrence of the event in time t; then, the random variable is 0 until the first event occurs, and the average frequency of occurrence for time t is λ t. This is expressed as a probability mass function of the Poisson distribution as follows (Lee, Reference Lee1998):
 $$f(0;\lambda t)=\frac{e^{-\lambda t}( {\lambda t})^0}{0!}=e^{-\lambda t}$$
The time it takes for an event to occur first is a random variable X, and this random variable X that exceeds the time t can be expressed as
 $$P(X>t)=e^{-\lambda t}$$
Here, the cumulative distribution function for the random variable X is as follows.
 $$P( {0\le X\le t} )=F( t )=1-e^{-\lambda t}$$
If the cumulative distribution function is differentiated, then
 $$\begin{align} \frac{dF( t )}{dt}&=\frac{d}{dt}(1-e^{-\lambda t}),\label{eq16} \end{align}$$
 $$\begin{align} f( t )&=\lambda e^{-\lambda t}\label{eq17} \end{align}$$
The probability variable X follows the exponential distribution when the lapse time of two consecutive events in the Poisson distribution with the parameter λ t is taken as the random variable. According to Equation (18), the time taken to reach the next communication is an exponential distribution, and the number of communications per unit time is a Poisson distribution. The chi-square test was performed to confirm that it followed the exponential distribution, and the verification confirmed that the p-value followed this distribution. There were approximately 39·58 communications per hour in the VTS area (Figure 7).
Distribution of time until next arrival.

3.4. Communication time
The average communication time (service time) through VHF during the survey period was 23·5 s, and the standard deviation was 18·6 s. To confirm the distribution of the communication time, the communication time was expressed by a histogram of 5 s (Figure 8). The hypotheses were that the communication time would follow the gamma distribution, and then the chi-squared test. As a result, it cannot be rejected at the p-value level of 5% to follow the gamma distribution, which is a null hypothesis (p-value 0·5274), and the communication time (service time) follows the gamma distribution.
Distribution of communication time.

3.5. Queue result
Given that the time taken until the next communication follows the exponential distribution and the communication time follows the gamma distribution, the communication in the VTS area can be seen as following the queuing. To observe the utilisation rate according to Equation (9), the number of communications was divided into one hour and the average of the communication time and number of communications per minute were plotted (Figure 9). The percentage of non-peak time communications was less than 40%, and that of peak time communications had a maximum of 68·11%. Armacost (Reference Armacost1977) proposed 40% to 60% as the optimal utilisation rate and 30·7% of peak time communications, which was more than the 40% of utilisation rate in the survey area.
Utilisation of communication channel.

The graph in Figure 10 shows the waiting time in the queue according to the utilisation ratio using Equation (12). In the case of Busan North Port, a ship should wait approximately 10·36 s during the peak time and approximately 3·44 s during the non-peak time to communicate through channel 12. The graph in Figure 11 shows the service time in the VTS area using Equation (13). This is the sum of the waiting time for communication in the VTS area and the time spent in actual communications, which means the total service time in the VTS area. That is, the average service time in the VTS area of the Busan North Port is approximately 32·94 s during the peak time and 27·10 s during the non-peak time.
Waiting time in queue.

Service time in the system (VTS area).

The graph in Figure 12 shows a ship waiting in a queue using Equation (10). During peak time, there were average of 0·18 and in non-peak time there were average of 0·02 waiting in the queue. As the utilisation rate increased, the number of waiting vessels tended to increase, but the maximum number of waiting vessels was 0·96. The graph in Figure 13 shows the number of vessels receiving service in the VTS area using Equation (11). In Busan North Port, the average of vessels receiving service in the VTS area was 0·53 during peak time and 0·17 during non-peak time, up to 1·64 services. Except for part of the peak time, it seems that one or more queues do not occur and the VTS is performed. However, according to the surveys conducted in 2007 and 2014, the ship operator or the VTS officer had to wait, unable to communicate the desired situation (Ministry of Oceans and Fisheries, 2007; South Regional Headquarters, Korea Coast Guard, 2014). This suggests that it is necessary to reduce channel congestion by simplifying the contents and procedure. In particular, 61% of survey respondents said that communication with the VTS was not smooth during times of traffic congestion. In other words, the congestion of the channel based on the queuing theory is different from the congestion reported by the actual user. Therefore, this study adjusted the service time in the VTS area, assuming that the ship should be emptied for at least one turn to prepare for emergencies. In other words, the new service time, including the average time per communication in one turn, is defined as follows.
Waiting vessels in queue.

Vessels serviced in the system (VTS area).

 $$\mu'=\mu+\alpha$$
where α = the average service time. However, utilisation ρ < 1.
Using the new service time according to Equation (19), the average communication time and the number of communications per minute are shown in Figure 14. For 59·6% of the peak time the analysis found more than 60% of the utilisation rate and for 4·5% of the non-peak time it was more than 60% of the utilisation rate. The proposed utilisation rate increased 1·96 times (34·5% > 67·7%) in the peak time and 1·94 times in the non-peak time (15·2% > 29·6%) than the original usage rate. In the next section, we propose the improvement of VTS communication for the reduction of the proposed utilisation rate (Figure 14).
Proposed utilisation of communication channel.

4. DISCUSSION: IMPROVEMENT PLAN FOR REDUCTION OF COMMUNICATION CONGESTION
The above results underline the need to reduce congestion in the communication channel of the VTS in Busan North Port. For that purpose, we propose three ways to improve the current situation: separation of the peak time control channel, exclusion of the passing reporting, and decrease of the reporting time.
4.1. Separation of peak time control channel
The communication in the VTS area can be classified by contents into vessel identification report and control service. In consideration of this, the opening of an additional channel at peak time is proposed so as to have two channels available, that is, a reporting channel and a control service channel. This increases one server at a specific time in the queue theory. The graph in Figure 15 shows the change in usage rate, in one-hour units, when the control channel is added. The red box on the graph is the time period from 06:00 to 19:00, when the control channel is added at the peak time. For the time period in which the control was added, the usage rates of the reporting channel of the ship and the channel for the control service are displayed. In the case of day 1, the maximum utilisation rate of 84·3% in the time period from 12:00 to 13:00 could be reduced to 40·1% for the ship information channel and 44·2% for the control service channel, and the peak utilisation rates were 35·2% and 21·2%, respectively. In the case of day 2, the maximum utilisation rate of 99·9%, from 14:00 to 15:00, could be reduced to 53·0% for the ship information channel and 52·0% for the control service channel, and the average peak usage rates were 37·3% and 28·4%, respectively. In the case of day 3, the maximum utilisation rate of 99·9% from 10:00 to 11:00 could be reduced to 66·9% for the ship information channel and 44·0% for the control service channel, and the peak utilisation rates were 52·1% and 26·7%, respectively. In the case of day 4, the maximum utilisation rate of 99·9% for the time zone from 09:00 to 10:00 could be reduced to 72·0% for the ship information channel and 36·6% for the control service channel, and the average peak usage rates were of 47·7% and 30·1%, respectively. Overall, the average utilisation rate of 67·7% could be divided into 43·1% and 26·6% through the establishment of the control channel at the peak time, with a decrease of 24·6% and 41·1%, respectively.
Change in utilisation when installing an additional VTS channel: (a) first day, (b) second day, (c) third day, (d) fourth day.

4.2. Exclusion of passing report
A ship must report its presence in the VTS area. By notifying the VTS officer that it will enter the VTS area, this also serves as a confirmation that the ship is listening to the designated channel. The number of such reports was of 517 in four days, accounting for 13·4% of the total communications with 23 s on average. Meanwhile, according to a survey conducted in 2014, 66% of the respondents indicated that their reporting needed to be streamlined. This is because access to the VTS area can be confirmed by the AIS signal of the ship in addition to the communication confirmation (South Regional Headquarters, Korea Coast Guard, 2014). Therefore, in this study, we omitted the passing report through the VHF and examined the change in the utilisation rate when the VTS officer monitored the vessel only by AIS. In the queuing theory, this is equivalent to controlling the number of customers arriving. The graph in Figure 16 shows the change in utilisation rate, in one-hour increments, excluding the report in the VTS area. The average of the first-day usage rate was 37·7%, and it was 32·9% when the passing report was excluded, with a reduction of 4·8%. In particular, the usage rate decreased 14·5% from 11:00 to 12:00. The average of the second day use rate was 48·4% and it was possible to decrease it by 7%, to 41·4%, by excluding the passing report. In particular, the usage rate decreased 12·6% from 08:00 to 09:00. The average of the third day usage rate was 55·7%, and it was possible to decrease it by 6·6%, to 49·1%, by excluding the passing report. In particular, the usage rate decreased by 19·4% from 13:00 to 14:00. The average of the fourth-day usage rate was 59·1%, and it was possible to decrease it by 4·5%, to 54·6%, by excluding the passing report. In particular, the usage rate could be reduced by 14·4% from 13:00 to 14:00. In summary, during the four days it was possible to decrease the utilisation rate by an average of 5·7% by excluding the passing report.
Change in utilisation by excluding the passing report: (a) first day, (b) second day, (c) third day, (d) fourth day.

4.3. Decrease of ship identification reporting time
We tried to confirm the reduction in the usage rate when reducing the communication time of the ship identification reporting, which accounts for 61·4% of the communication in the VTS area. This is equivalent to adjusting the service time in the queuing theory. The graph in Figure 17 shows the changes in utilisation when the reporting time for ship identification is reduced by 20%, 40%, and 60%. Considering an allowance of one turn (23·5 s) for a ship to communicate in the VTS channel, the average time required to report ship identification is 46 s, which changes to 36·8 s with a 20% reduction, 27·6 s with a 40% reduction, and 18·4 s with a 60% reduction in reporting time. When the communication time decreased by 20%, the usage rate decreased by 7·82% from 13:00 to 14:00. The average usage rate was of 47·69%, which was 2·59% lower than the original usage rate. In the case of 40% decrease, the usage rate decreased by 15·64% from 13:00 to 14:00, and the average utilisation rate was 44·87%, which was 5·40% lower than the original utilisation rate. In the case of 60% decrease, the usage rate decreased by 23·47% from 13:00 to 14:00, and the average utilisation rate was of 41·93%, which was 8·35% lower than the original utilisation rate. Overall, if the ship identification reporting time is reduced by 20%, the average rate of use of the VTS area communication channel was reduced by 2·59%. With a 40% reduction, the decrease was of 5·40%, and with a 60% reduction, it was possible to reduce the use by 8·35% on average.
Change in utilisation rate when ship reporting time is reduced: (a) first day, (b) second day, (c) third day, (d) fourth day.

5. CONCLUSION
Voice communication with ships in the VTS area is achieved using VHF radio, and it is difficult for other participants to enter in the middle of a conversation because this is a two-way communication. Therefore, communication via VHF radio can be understood as a type of queuing system. This work quantitatively analyses the status of VHF radio communications in ports using the queuing theory and suggests ways to reduce communication congestion for safe and efficient maritime traffic management. The summary of the study is as follows.
(1) To analyse the communications within the control area, we listened to the Busan North Port VTS channel 12 for four days. The results showed that there were 3837 communications over four days and approximately 2·12 times more communications during the day than at night. According to the analysis, the communication contents included those in which the VTS made a call to the ship, the ship made a call to other ships, the ship made a call to the VTS, and the ship called the VTS for the ship identification report, which accounted for 61·4% of the whole communication activity. In other words, many of the current communication contents appear to be determined by the regulations.
(2) Given that the number of communications per hour in the control channel follows the Poisson distribution, and the time from the start to the end of the communication follows the gamma distribution, and other communications cannot be performed simultaneously during the communication, the M/G/1 model proved to follow the queue. As a result, an average of 39·58 communications per hour occurred in the VTS area, and the average communication time was 23·5 s. The four-day usage rate was 34·5% during peak time and 15·2% during non-peak time. As a result of analysis using this data, the vessels (including the waiting vessels) using the service in the VTS area have a peak time average of 0·53 and a non-peak time of 0·17. It took 32·9 s during peak time and 27·1 s during non-peak time to complete the service, including the waiting time in the VTS area.
(3) However, in real terms, the opinion of users is that the channel is crowded at peak time in the user side, and a new communication time is required, including an allowance for urgent communications. This study found that the peak time usage is 67·7%, which is 1·96 times higher than that at the previous peak, and usage in non-peak time is 29·6%.
(4) To reduce the congestion in the communication channel, this study proposed to separate the peak time control channel, omit the passing report, and reduce the reporting time of the ship identification. It is analysed that the usage rate is decreased by 41·1% when the peak time control channel is separated, by 5·7% when the passing report is omitted, and by 8·35% when the reporting time of ship identification is decreased by 60%.
The results imply that it is meaningful to present a quantitative measure to analyse the VTS communication and to reduce the utilisation rate, to adjust the responsibilities of the VTS officer in the VTS area, and adjust the duty report contents, among other possible measures. This can be used as basic data for policy to reduce congestion for the VHF channel. However, the results of this study are limited to the Busan North Port and the available data covers a short period of four days. Moreover, one limitation of the study is including one communication turn (23·5 s) margin in service time to propose a new utilisation rate. Future research should be aimed at addressing this limitation. In addition, service time may differ between native and non-native languages; thus, it is necessary to expand and continue the research.