I. INTRODUCTION
Advanced cathode materials are needed to produce the stable, high current electron beams needed for compact, high power, high frequency, vacuum electronic devices. Current state of the art thermionic cathodes require high operating temperatures, resulting in inefficient power consumption, poor reliability, and shorter lifetime. The high powers associated with thermionic cathodes require the incorporation of device cooling, which in turn leads to additional complexity and added weight, both of which are undesirable. Field emission (FE) cathodes are an appealing alternative to thermionic cathodes due to significant reduction in power requirements for such operating devices. Power reduction in the FE devices also offers an opportunity to reduce the size of the cathode device significantly. These demands have driven the research of FE or “cold” cathode technologies.
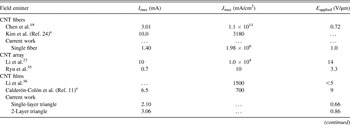
Carbon nanotubes (CNTs) have proven to be excellent field emitters due to their high aspect ratio and high electrical and thermal conductivity. Reference Milne, Teo, Minoux, Groening, Gangloff, Hudanski, Schnell, Dieumegard, Peauger, Bu, Bell, Legagneux, Hasko and Amaratunga1–Reference Perea-López, Rebollo-Plata, Briones-León, Morelos-Gómez, Hernández-Cruz, Hirata, Meunier, Botello-Méndez, Charlier, Maruyama, Muñoz-Sandoval, López-Urías, Terrones and Terrones12 Recent research Reference Li, Kinloch and Windle13–Reference Behabtu, Young, Tsentalovich, Kleinerman, Wang, Ma, Bengio, ter Waarbeek, de Jong, Hoogerwerf, Fairchild, Ferguson, Maruyama, Kono, Talmon, Cohen, Otto and Pasquali15 has focused on fabricating free standing films, yarns, and fibers of CNTs in the attempt to transfer their exceptional physical properties from the nanoscale to the macroscale. CNT yarns that are spun from vertically grown CNT arrays have been studied Reference Zakhidov, Nanjundaswamy, Obraztsov, Zhang, Fang, Klesch, Baughman and Zakhidov16–Reference Chen, Shin, Roth and Lee19 for their use as FE sources, and the FE properties of acid-spun CNT fibers have been described Reference Behabtu, Young, Tsentalovich, Kleinerman, Wang, Ma, Bengio, ter Waarbeek, de Jong, Hoogerwerf, Fairchild, Ferguson, Maruyama, Kono, Talmon, Cohen, Otto and Pasquali15,Reference Shiffler, Fairchild, Tang, Maruyama, Golby, LaCour, Pasquali and Lockwood20–Reference Fairchild, Back, Ferguson, Boeckl, Koemer, Maruyama, Lange, Lockwood, Cahay, Behabtu, Young, Averett, Murray and Pasquali22 previously. Although FE CNT devices have been shown Reference Chen, Shin, Roth and Lee19 to demonstrate extraordinary current densities (∼108 A/cm2), the total current from a FE CNT cathode seems to be limited to ∼10 mA. Reference Li, Zhang, Cole, Shivareddy, Barnard, Lei, Wang, Pribat, Amaratunga and Milne23,Reference Kim, Lee, Song, Chu and Kim24 A summary of the reported FE properties of several CNT-based cathodes is presented in Table I.
The maximum observed current, current density, and applied voltage from the literature as well as results reported here are included. The listed recent results represent what one would expect from a variety of experimental approaches with CNT field emitters. All experiments were run in dc mode and represent conditions for the maximum observable current. Although direct comparisons are difficult to make given the subtle differences between experiments, this work compares reasonably well with previously reported results of fibers, arrays, and films.

a Composite material.
Here we report the FE properties of laser cut CNT fibers and free standing films that were fabricated by direct online condensation from a floating catalyst chemical vapor deposition reactor. Reference Li, Kinloch and Windle13,Reference Paukner and Koziol14 The goal of this work was twofold. The first was to explore the extent to which cathode geometry affected the overall FE performance. To this end, we have characterized the FE properties of CNT-based emitters that were produced as fibers as well as free standing films. FE was measured from the tips of vertically mounted fibers and from the edge of vertically mounted films. Both fibers and films were cut with a laser to create a clean nonragged edge for the emission site. For the CNT films, the top edge of the cathode was either straight cut or pattern cut with triangular features which resulted in a field enhancement effect. Sharp pointed features will concentrate field lines, which should result in more current for the same applied voltage when compared to a film that is simply straight cut.
The second goal of this effort was to obtain a more fundamental understanding of the mechanisms underlying FE from these macroscopic CNT materials. When examining FE of the CNT fibers, we found that, at high field strengths, current was emitted not only from the fiber tip but also from the sidewall. This has a detrimental effect of both increasing the angular spread of the emitted electrons which lowers the emittance of CNT fiber cathodes Reference Jensen27,Reference Jensen28 as well as increasing the energy spread of the emitted beam. Additionally, if not accounted for, sidewall emission will result in an inaccurate reporting of current densities if only the fiber diameter is used in the calculation. In contrast, when investigating FE from laser cut films containing triangular features, we find that even at the high field strengths, emission appears to be localized at the triangular tips. Cathodes with such features also possess some redundancy in that damage to features that were emitting prior to damage (through excessive Joule heating) can be replaced by other features that begin to emit after the original features have been damaged.
The FE experiments were performed in a custom-built system that incorporates both optical and infrared (IR) imaging of the emitting cathodes along with a residual gas analyzer (RGA) for examining the species desorbed during FE. This unique suite of capabilities allows for thorough characterization of cathode performance which helps to provide insight into the mechanisms leading to cathode breakdown and eventual failure. Photon emission (both optical and IR) occurring in the anode–cathode (A–K) gap during FE can be captured, allowing one to determine the FE location (cathode tip or otherwise), for accurate determination of current densities. This luminescence can be correlated with the emitted species seen with the RGA as well as the temperature as measured with the IR camera, thus providing insight into the FE process over cathode lifetime from turn-on to failure.
II. EXPERIMENTAL
Aligned CNT fibers and free-standing films were drawn directly out of a floating catalyst chemical vapor deposition reactor as a one-step CNT generation process. Although this technique is thoroughly covered in Ref. Reference Li, Kinloch and Windle13, it is briefly discussed here. A carbon source (toluene) was introduced into a hydrogen atmosphere accompanied by a catalyst source (ferrocene). This gas mixture flowed through a reaction furnace (at 1200 °C) where the constituents broke down to form floating catalytic nanoparticles. From these nanoparticles, CNTs grew and formed collectively as an aerogel cloud in the reactor. This aerogel cloud was mechanically drawn directly out of the reactor and collected on a spinning wheel to form an aligned film. The feedstock choice enables CNT fiber spinning without catalyst stabilizer or promoter commonly used in the conventional process Reference Li, Kinloch and Windle13 as described previously. Reference Paukner and Koziol14 This process allows for the synthesis of CNT fibers made from predominantly single-walled CNTs with a significant reduction of carbonaceous impurities compared to the material from the conventional process. Reference Li, Kinloch and Windle13 The speed at which the CNT aerogel is extracted dictates the internal CNT alignment and electrical and mechanical properties. To produce CNT films, acetone is applied to densify the films as a post process step. In the case where aligned CNT fiber is desired, an acetone mist is sprayed directly on the CNT material as it exits the reactor (online condensation). The capillary effect of evaporating acetone pulls CNT bundles together, closing gaps and thus increasing the contact area. A rotating second winder gives a direction to the CNT bundles, thus enhancing their alignment along the fiber axis. The fiber material used for the present study contained approximately 10 wt% carbonaceous impurities and below 4 wt% iron, as indicated by thermogravimetric analysis. The full width at half maximum of the thermogravimetric analysis mass derivative indicated the presence of one type of carbon allotrope.
Laser manufacturing processes were used to cut and shape both CNT fibers and films for use as FE cathodes. Laser cutting was accomplished with both nanosecond (ns) and femtosecond (fs) lasers. The ns laser (SPI Lasers, Model G3, Southampton, UK) operated at 1064 nm with a maximum pulse energy of 1.5 mJ, repetition frequency of 25 kHz, pulse duration of 10 ns, and average power of 25 W with a traverse rate across the sample of 380 mm/s. The fs laser (Spectra-Physics, Model Hurricane i, Santa Clara, CA) operated at 800 nm with a maximum pulse energy of 1.0 mJ, repetition frequency of 5 kHz, pulse duration of 130 fs, and average power of 20 mW with a traverse rate across the sample of 0.05 mm/s. The fs laser was used to cut the fibers which provided a nonthermal ablation mechanism, resulting in minimal peripheral damage to the fiber and negligible carbon build up on the cut surface. The ns laser was used to cut the CNT films since, at the time these experiments were performed, it offered better control for cutting patterns into the CNT films. Upgrades and improvements will be made in the future to allow for fs laser patterning of CNT films.
The CNT film samples were 10-μm thick and cut into 5 × 5 mm squares. A pattern consisting of 5 triangles was laser cut into one edge. The triangles were 1-mm tall and 0.5-mm wide at the base resulting in a 28° angle at the apex. Each triangle was separated by 0.5 mm creating a 1-mm gap between the triangular tips. This pattern proved to be sufficiently mechanically stable so that the triangles did not droop or fold over when the films were vertically mounted. The 1:1 ratio of apex tip height to spacing was sufficient for creating a field enhancement factor large enough to demonstrate an improvement in FE performance over the straight cut films. Reference Nilsson, Groening, Emmenegger, Kuettel, Schaller, Schlapbach, Kind, Bonard and Kern29
FE experiments were carried out in a load locked ultrahigh vacuum chamber whose base pressure was 4.0 × 10⁻⁷ Pa. A stainless steel anode probe tip (7 mm in diameter) mounted on a stepper motor capable of 2.5-μm step size movements was used to control the A–K gap distance. The sample holder was a 2 × 2" plate mounted with a transfer arm onto an x–y translation stage. The CNT fiber and film cathode samples were mounted with silver paint onto a small piece of copper shim to serve as structural backing for FE testing and then mounted on a small stainless steel rail that was fixed to the sample holder. Approximately 2 mm of the CNT material was left exposed above the shim. Optical imaging was accomplished with the use of two cameras mounted on orthogonal viewports which allowed for precise sample positioning under the anode. One camera was attached to an Infinity SK long distance microscope which was used to image the sample and anode to accurately determine the A–K gap distance. The A–K gap was varied with integrated stepper motors capable of a minimum step size of 2.5 μm. Once the A–K gap distance was set, the voltage on the anode was increased with a Keithley 2410 source meter (Keithley Instruments, Inc., Cleveland, OH), typically at the rate of 1 V per 10 s to the maximum of 1000 V. Data were recorded at each voltage setting under labview control. The RGA was situated in a line of sight with respect to the FE region at a distance of 15 cm to the RGA entrance aperture. The RGA and FE scans were acquired such that the intensity for each particle mass was recorded at every voltage step.
Thermal images of the cathodes were captured during FE experiments with an infrared camera that was attached to the long distance microscope mounted on the FE chamber. The Xenics Xeva 320 InGaAs array camera (XENICS USA, Beverly, MA) had a resolution of 320 × 240 pixels and an optical response between 900 nm and 1.7 μm. Integration times used to capture the images were between 100 and 2000 μsec, and the InGaAs sensor was cooled between −40 and −10 °C. To obtain fiber temperatures, a calibration was performed at multiple integration times using the combination of the Xenics camera, Infinity SK long-distance microscope, and a vacuum chamber window against a blackbody source. Postprocessing the captured images against the calibration data produced temperature information for points along the length of the fibers. The calibration was carried out over the temperature range of 300–900 °C.
III. RESULTS AND DISCUSSION
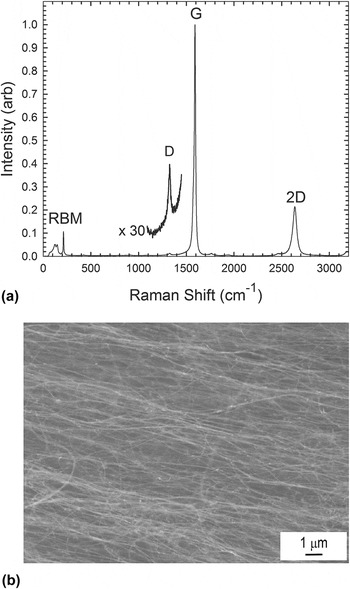
Shown in Fig. 1(a) is a Raman spectrum acquired from one of the CNT films. As indicated in the spectrum, the CNT films and fibers were predominantly composed of single-walled CNTs and had a high degree of graphitic order (Raman G:D ratio ∼ 19:1). The prominent radial breathing mode (RBM) peaks near 150 cm−1 indicate the presence of single-walled CNTs. Shown in Fig. 1(b) is a scanning electron micrograph (SEM) of a CNT film, showing the high degree of CNT bundle alignment within the film.
(a) Raman spectrum of the CNT film made by direct online condensation by floating catalyst chemical vapor deposition. The Raman spectrum indicated here has a G:D ratio of 96, indicating a high degree of graphitic crystallinity. The prominent RBM peaks near 150 cm−1 indicate the presence of single-walled CNTs. (b) SEM image of a CNT film showing alignment of CNT bundles within the fiber.

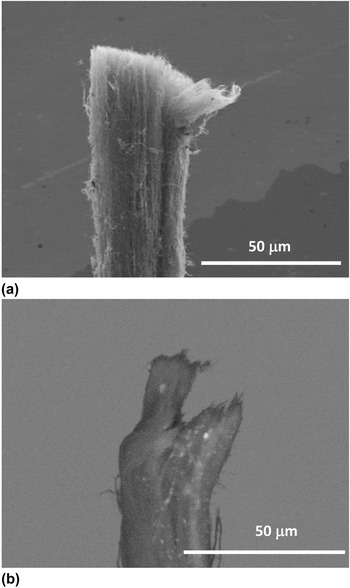
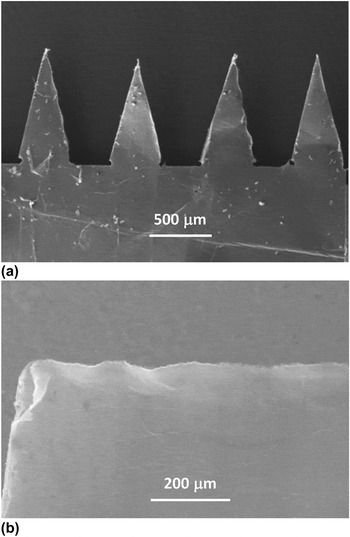
Figure 2(a) shows an ∼30-μm-diameter CNT fiber with a uniform laser cut at the tip and with some minimal fraying at the edge due to handling. For comparison, Fig. 2(b) shows a fiber that was cut with a razor blade which resulted in an uneven and ragged cut. Figure 3 shows SEM images of the CNT film samples that were cut with the ns laser. Figure 3(a) is a SEM image of the patterned CNT film and Fig. 3(b) is a SEM image of a film that was straight cut with the laser.
(a) SEM image of a CNT fiber was cut by the fs laser. The fiber diameter is approximately 30 μm. (b) Mechanically cut fiber with an uneven tip due to cutting with a razor blade.

CNT films cut with the ns laser. (a) Triangle pattern consisting of 1 mm × 0.5 mm triangles separated by 0.5 mm. (b) Straight cut CNT film.

A. FE results
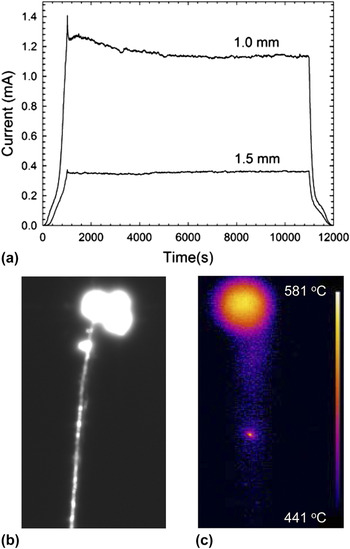
Figure 4(a) shows the current versus time (I–T) curves for the laser cut CNT fiber cathode at A–K gap distances of 1.0 and 1.5 mm. For the first run, the gap was fixed at 1.5 mm resulting in a maximum field strength of 0.66 V/μm; the dwell time at 1000 V was 10,000 s. The fiber cathode showed very stable emission with an average current value of 356 μA. For the second run, the gap was fixed at 1.0 mm resulting in the maximum field strength of 1.0 V/μm. The average emission current over the dwell time was 1.16 mA. Six different fiber samples were tested in this configuration, all from the same fabrication batch of fibers. To determine the maximum current achievable, the A–K gap was decreased (increasing the field strength) on successive runs until the fiber failed. The average maximum current achieved for the six samples tested was 1.48 mA, with 2.23 mA being the highest current and 0.98 mA the lowest. Deviations in performance can be attributed to irregularities in the fibers due to changes in density, diameter, and defects due to localized accumulation of excess impurities. This can result in localized resistive heating at these accumulation sites resulting in failure.
(a) Current versus time curve for an fs laser cut CNT fiber cathode at A–K gap distances of 1.0 and 1.5 mm. The voltage was ramped from 0 to 1000 V and held there for 10,000 s before ramping down. (b) Optical and (c) IR images of the fiber inside the FE chamber during FE. The maximum temperature at 1.13 mA was 570 °C.

Figures 4(b) and 4(c) show optical and infrared camera images, respectively, of the same fiber during FE. The optical image [Fig. 4(b)] shows considerable photon emission near the fiber tip with an additional smaller hot spot below the tip indicating that FE is occurring from the fiber sidewall. The infrared camera image [Fig. 4(c)] was acquired while the emission current was 1.13 mA; the maximum temperature of the fiber tip, determined by the calibrated IR camera, was determined to be 570 °C.
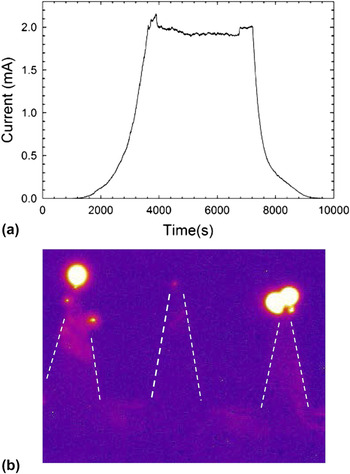
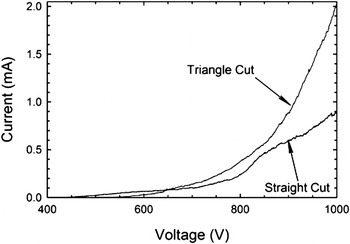
Figure 5(a) shows the I–T curve for a single (triangle cut) CNT film cathode at an A–K gap distance of 1.5 mm with a dwell time (at 1000 V) of 3600 s, resulting in a maximum field strength of 0.66 V/μm. This cathode showed stable emission under these conditions with an average maximum current value of 1.95 mA; Fig. 5(b) shows the IR image of the same film during the FE run. Dashed lines have been added to the image to outline the triangular features. The maximum cathode temperature at a current level of 2 mA was determined to be 830 °C. Figure 6 compares the I–V curves for cathodes made from the triangle cut and straight cut process. For both cathodes, the voltage was ramped from 0 to 1000 V for an A–K gap spacing of 1.5 mm. At 1000 V, the straight cut film cathode reached a maximum current of 0.90 mA compared to 2.02 mA for the triangle cut film. The field enhancement created by the sharp tips in the triangle pattern lead to a current increase of 1.12 mA over the straight cut film at the same voltage, thereby demonstrating the utility of fabricating cathodes with such features. Three different triangle patterned films were tested, and maximum currents before failure were 2.9, 2.5, and 2.0 mA.
(a) Current versus time curve for a single triangle cut CNT film cathode at A–K gap distance of 1.5 mm. The voltage was ramped from 0 to 1000 V and held there for 4000 s before ramping down. (b) IR image of the triangle cut CNT film inside the FE chamber during FE. Dashed lines are used to highlight the edges of the triangle cuts. The maximum temperature was 830 °C while emitting 2 mA.

Comparison of I–V curves for straight cut and triangle cut CNT film cathodes for an A–K gap of 1.5 mm. The maximum current is 0.90 mA for the straight cut and 2.02 mA for the triangle cut due to the field enhancement provided by the triangle pattern.

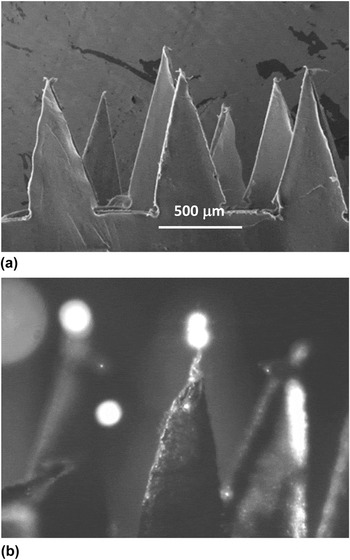
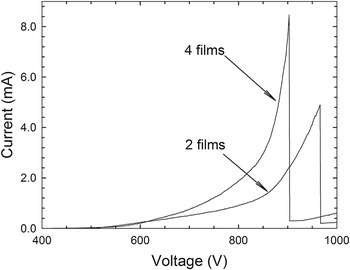
Cathodes with additional emission sites were made by stacking together patterned cut CNT films. Figure 7(a) is a SEM image of multiple films stacked together; Fig. 7(b) is an optical image during FE. Figure 8 compares the I–V curves of cathodes comprised of two films and four films. The two-film cathode exhibited a maximum emission current of 4.89 mA before failure at an applied field strength of 0.86 V/μm (858 V, 1-mm gap). The four-film cathode reached a maximum current level of 8.46 mA before failure at an applied field strength of 1.30 V/μm (978 V, 0.75 mm gap). These were the best samples tested. The other two-film cathode reached a maximum current of 3.6 mA, whereas the other four-film cathode tested reached a maximum current of 7.6 mA. Differences in performance can be attributed to variations in the density of the paper used to make the cathodes, as well as inconsistencies in the laser cuts or mounting which could result in height irregularities of the triangular tips.
(a) SEM image of three CNT films stacked together. (b) Optical image of a stacked film cathode inside the FE chamber shows glowing at the triangle tips while emitting 1.2 mA.

Comparison of I–V curves for two film and four film cathodes, both made from triangle-patterned CNT films. The A–K gap was 0.75 mm. The maximum currents before failure were 4.9 mA for the two-film cathode and 8.5 mA for the four-film cathode.

Optical emission is evident in Fig. 7(b) from two of the three triangular features shown. FE can be occurring at the nonglowing tip but at a current level that is not sufficiently high enough to result in observable photons. Several hundred microamperes of current have been measured in the absence of visible luminescence, and Bonard et al. Reference Bonard, Stöckli, Maier, de Heer, Châtelain, Salvetat and Forró30 estimate that one photon corresponds to 106 field-emitted electrons from CNTs. Difference in FE currents from the triangular tips can result from slight variations in the tip heights from wither laser cutting or mounting which can lead to differences in the strength of the field concentration at the tips.
It is interesting to note that the film cathodes appear to have more localized heating at the triangular tips and higher temperatures than the fibers. Since the fibers are condensed, they are likely to have higher thermal conductivity than the films which would allow for better heat distribution through the body of the emitter. In the optical images of the films, there is little evidence of emission other than from the tips, unlike with the fibers that emit beneath the tip at higher currents. The current emitted from triangular tips is from an area much smaller than the CNT fiber tip. Therefore, power dissipation near the triangular tips occurs over a smaller volume increasing self-heating effects in that region and leading to an increased temperature of the emission area. In fact, Fig. 7 (b) shows evidence of an annealing effect at the triangular tip resulting in a condensed apex of the triangle when compared to the triangle tips in Fig. 7 (a). In a CNT fiber, emission from the sidewall is responsible for power dissipation from an area different from the tip leading to a smaller tip temperature for the same emission current.
B. Fowler–Nordheim and RGA analysis
Before meeting the practical goal of achieving emission current levels in excess of 10 mA, we must first focus on characterizing and understanding the FE process from CNT assemblies in the form of fibers or films with triangular features. We therefore examine the FE results from both the fiber and film cathodes in more detail next.
If Fowler–Nordheim (FN) emission is taking place, the current-applied electric field characteristics should be well fitted by an expression of the form,
 $${\it I}({\rm{Amps}}) = {\it A}_{{\rm{eff}}} {{1.54 \times 10^{ - 6} } \over \varphi }{\rm{\beta }}^2 {\it E}_{{\rm{ext}}}^2 {\rm{ e}}^{ - {\rm{}}{{6.83 \times 10^{7} \varphi ^{3/2} } \over {{\rm{\beta }}{\it E}_{{\rm{ext}}} }}}\quad ,$$
where A
eff is the effective area (in cm2) of the fiber which is emitting, ϕ is the work function (in eV) of the emitting surface, β is the field enhancement factor, and E
ext is the externally applied electric field (in V/cm), i.e.,
 ${E_{{\rm{ext}}}} = {V \over d}$
, where V is the applied bias between anode and cathode (assumed to be same as that between the tip of the fiber and the anode since the potential drop along the fiber is negligible) and d is the distance between the anode and the base of the CNT cathode. Hereafter, to compare I–E data for different anode to cathode gap distances, we plot the FE data as a function of the applied external electric field.
C. Laser cut fiber results
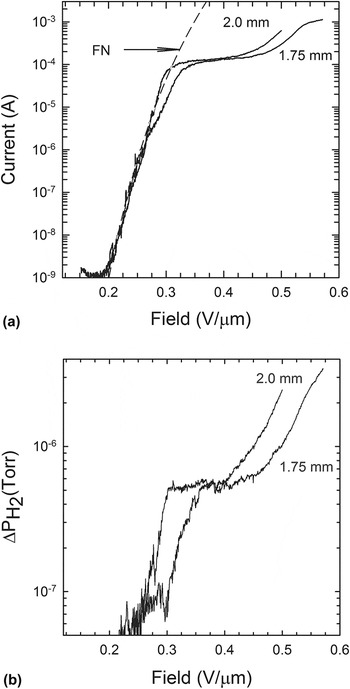
Figure 9(a) is a plot of the current versus applied electric field for two different gap distances of a laser cut fiber. This figure shows that the electric field threshold for substantial emitted current (∼1 μA) is around 0.2 V/µm. In the electric field range from 0.2 to 0.3 V/µm, the I–E data are in good agreement with the FN model of FE. A fit to the I–E data using the FN equation is shown as a dashed line for a gap distance of 2 mm. Beyond 0.3 V/µm, the I–E curve flattens out. We believe this is an indication of the onset of space-charge effects near the tip of the fiber. Even though not shown here, we found that the data in the flat region of the I–E curve are in agreement with the Child–Langmuir expression associated with space-charge limited current emission near the tip of the fiber. Reference Child31,Reference Langmuir32
(a) Current versus applied electric field of a laser cut fiber of 40 µm diameter for different values of the A–K gap distance indicated next to each curve. The dashed line is a FN fit to the I–-E data for a gap distance of 2 mm. (b) Incremental change of partial pressure of H2 compared to the background pressure as a function of applied electric field for the two values of the anode to cathode spacing shown in Fig. 9(a).

After the rather flat portion in the I–E data, the current rises again. We believe this is due to FE from the sides of the fiber until the current starts saturating again as space-charge effects limit FE from the sides. This is consistent with the observation of bright spots at points on the fiber below the tip [Fig. 4(b)]. We have also observed Reference Cahay, Murray, Back, Gruen, Fairchild, Boeckl, Bulmer and Koziol33 an increasing number of bright spots along the sidewall of the fiber, past the space charge regime of operation. On the forward sweep, the number of bright spots was found to increase and propagate down the fiber at large values of the applied bias. These observations are consistent with FE from the fiber sidewalls.
At the maximum applied voltage of 1000 V, the maximum emitted current for the 2-mm gap case was found to be 1.1 mA. We conjecture that this current is large enough to cause self-heating effects which can lead to partial destruction of CNTs forming the fiber. This assertion is supported by the fact that the two I–E curves start to differ around 0.26 V/µm as if a portion of the fiber had been damaged during the run at a gap distance of 2 mm prior to running the FE experiment at a gap distance of 1.75 mm. Partial destruction of the fiber also results in a smaller maximum emitted current (0.58 mA) for the 1.75 mm gap case at an applied bias of 1000 V. Even though not shown here, we found that the maximum emitted current reached a value of 2.2 mA when the gap distance was reduced to 1.25 mm but the fiber stopped emitting abruptly shortly after the maximum voltage of 1000 V was applied.
Figure 9(b) shows the RGA results for the incremental increase in the H2 partial pressure recorded simultaneously with the I–E data shown in Fig. 9(a). A comparison of Figs. 9(a) and 9(b) shows a strong correlation between the emission current and the desorbed H2 signal, including a E-field threshold value for a substantial increase in ΔP coinciding with a sharp rise in the FE current, a rather steep rise in the ΔP curves corresponding to the FE of operation of the fiber, and a rather slow change in ΔP with E in the range corresponding to space-charge limited operation of the fiber. Qualitatively similar results were observed when looking at CO emission during FE, but the incremental increase in the CO partial pressure was found to be one order of magnitude less than for H2. Adsorbate enhanced FE is commonly Reference Dean, Groening, Kuttel and Schlapbach25,Reference Dean, von Allmen and Chalamala34 manifested as hysteresis in I–E curves and, as we have shown recently, Reference Murray, Back, Cahay, Fairchild, Maruyama, Lockwood and Pasquali26 and RGA measurements are a valuable tool to assess the variation with applied bias of the fraction of surface dipoles due to adsorbed species and bare CNTs contributing the FE. There is also a strong correlation in the noise levels in the current and partial pressure data below and above the critical electric field E c = 0.26 V/µm. We conjecture that below the critical field E c, emission mostly comes from a large concentration of adsorbates. The emission from individual emitters depends strongly on the energy of the surface dipoles and the exact shape of the nanotube tips. The wide variety in the tip characteristics in addition to the dynamic nature of the adsorbate coverage on the surface accounts for the large noise in the I–E data. Above E c, the main contribution to FE comes from bare CNTs which are more stable in the applied electric field, and thus the noise in the I–E curve is much less. Reference Murray, Back, Cahay, Fairchild, Maruyama, Lockwood and Pasquali26
D. Laser cut film results
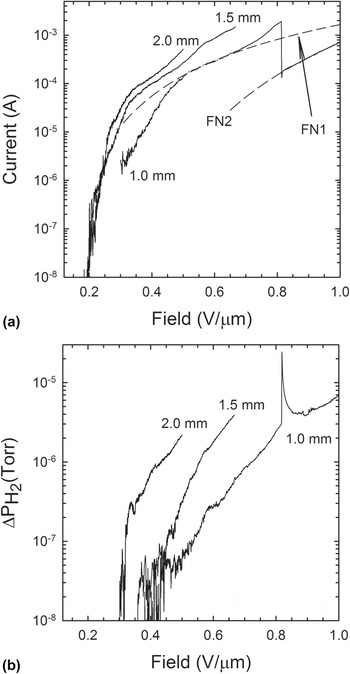
The FE and RGA experiments were repeated on a single triangle cut film cathode and the results are plotted in Figs. 10(a) and 10(b), respectively. For the smallest gap distance (1 mm), we found that the I–E data are well fitted by the FN expression given by Eq. (1) which we rewrite as
 $${\rm{ln}}\left( {{\raise0.7ex\hbox{$I$} \!\mathord{\left/ {\vphantom {I {E_{{\rm{ext}}}^2}}}\right.\kern-\nulldelimiterspace}\!\lower0.7ex\hbox{${E_{{\rm{ext}}}^2}$}}} \right) = {\rm{a}} + \left( {{\raise0.7ex\hbox{${\rm{b}}$} \!\mathord{\left/ {\vphantom {{\rm{b}} {{E_{{\rm{ext}}}}}}}\right.\kern-\nulldelimiterspace}\!\lower0.7ex\hbox{${{E_{{\rm{ext}}}}}$}}} \right)\quad ,$$
(a) I (amps)–electric field (V/μm) characteristics of a triangle cut CNT film for different anode to cathode gap distances. A good agreement with FN behavior is found over the range of the electric field of [0.5–0.65] and [0.81–1.0] V/μm. (b) RGA showing increase in partial pressure (Torr) of H2 versus electric field (V/microns) during FE from a triangle cut CNT film for different anode to cathode gap distances.

with
 $${\rm{a}} = {A_{{\rm{eff}}}}(1.54 \times {10^{ - 6}})({\raise0.7ex\hbox{${{{\rm{\beta }}^2}}$} \!\mathord{\left/ {\vphantom {{{{\rm{\beta }}^2}} \varphi }}\right.\kern-\nulldelimiterspace}\!\lower0.7ex\hbox{$\varphi $}})\quad ,$$
and
 $${\rm{b}} = (6.83 \times {10^7})({\raise0.7ex\hbox{${{\varphi ^{{\raise0.7ex\hbox{$3$} \!\mathord{\left/ {\vphantom {3 2}}\right.\kern-\nulldelimiterspace}\!\lower0.7ex\hbox{$2$}}}}}$} \!\mathord{\left/ {\vphantom {{{\varphi ^{{\raise0.7ex\hbox{$3$} \!\mathord{\left/ {\vphantom {3 2}}\right.\kern-\nulldelimiterspace}\!\lower0.7ex\hbox{$2$}}}}} {\rm{\beta }}}}\right.\kern-\nulldelimiterspace}\!\lower0.7ex\hbox{${\rm{\beta }}$}})\quad .$$
The parameters (a,b) were found to be equal to (−5.36, −1.046) and (−2.89, −4.37) over the range of electric field [0.5, 0.65] V/μm (region 1) and [0.81–1.0] V/μm (region 2), respectively. The corresponding FN fits are shown as dashed lines in Fig. 10(a). Assuming the work functions in the two ranges of electric field are the same, the ratio of the field enhancement factor in regions 2 and 1 is found to be, β2/β1 ∼ 0.24, and the ratio of the emission areas is found to be A eff2/A eff1 ∼ 200. The smaller value of β2 compared to β1 is in agreement with the destruction of the tallest emitting CNTs as a result of self-heating effects. The larger values of A eff2 indicate that a larger fraction of the remaining CNTs is emitting after the tallest ones have been destroyed. We conjecture that the smaller CNTs were not contributing before self-heating effects prevail, most likely because they were shielded by the taller CNTs.
The major difference between the I–-E data for the 1 mm gap and the 1.5 and 2 mm gaps is the abrupt drop in the current at a threshold of 0.8 V/μm. As shown in Fig. 10(a), there is a substantial deviation of the I–-E data from a FN behavior prior to that threshold. We interpret this as evidence of self-heating effects as the current density in the individual CNTs forming the triangle cut film increases. The maximum current emitted from the triangle cut film before partial destruction at 0.81 V/μm was found to be 1.8 mA. The sudden drop in current at 0.81 V/μm is evidence of a partial destruction of the emitter as a result of self-heating effects. As Fig. 10(a) shows, after the sudden drop in the I-–E data, the triangle cut film was still emitting and well characterized by a different FN fit which seems to indicate a change in the morphology of the previously emitting portion of the triangle cut film or emission from a different area. This is in sharp contrast with the CNT fiber results which quit abruptly, shortly after reaching a maximum current of 2.2 mA at 1000 V, as mentioned above.
Evidence of adsorbate-enhanced FE from the triangle cut film is supported by RGA which was carried simultaneously with the FE measurements. The RGA data showing the increase in partial pressure above the residual background of H2 species as a function of applied electric field is shown in Fig. 10(b). For the largest gap distance, the RGA data show a sharp threshold for H2 desorption at an external field strength that coincides with a breakpoint in the FE data, as reported previously for a CNT fiber. Reference Murray, Back, Cahay, Fairchild, Maruyama, Lockwood and Pasquali26 For the smallest gap distance, there is a sudden jump in the partial pressures of the H2 species at the same threshold field of 0.81 V/μm, where a discontinuity in the emitted current was measured. This is interpreted as evidence that more gaseous species were released during the partial destruction of the triangle cut film. In fact, qualitatively similar results were also observed for CO emission during FE but the incremental increase in the CO partial pressure was found to be one order of magnitude less than for H2, as in the case of the CNT fiber.
IV. SUMMARY
Both fiber and film cathodes showed stable emission in the current range of 1–2 mA with maximum cathode temperatures less than 1000 °C. A compound cathode made from four laser-patterned CNT films stacked together emitted greater than 8 mA of current. Film cathodes appear to have more localized heating at the triangular tips and higher maximum temperatures than the fibers. Since the fibers are condensed, they are likely to have higher thermal conductivity than the films which would allow for better heat distribution through the body of the emitter. In the optical images of the films, there is little evidence of emission other than from the edges, unlike that of the fibers that emit below the tip at higher E ext. The current emitted from triangular tips is from an area much smaller than the CNT fiber tip. Therefore, power dissipation near the triangular tips occurs over a smaller volume increasing self-heating effects in that region and leading to an increased temperature of the emission area.
FN analysis indicated a change in the morphology of the emitters at larger values of E ext. When field induced self-heating effects became significant, the single fiber cathode stopped emitting abruptly. For CNT films, even though self-heating effects can destroy a portion of the film, FE can still occur from other areas.
The CNT cathodes analyzed in this study showed considerable promise by demonstrating the potential for scalability into large area arrays that could be used to generate the high current densities required for advanced device development. Future work will concentrate on understanding cathode failure mechanisms (the nature of cathode damage), on isolating the effects of handling-induced defects from the inherent emission characteristic of the CNT material, and in resolving FE from cathode tips and that from edges. In addition, improvements are underway in the precision of the laser cutting of the CNT films and fibers and developing more consistent mounting techniques to ensure sample uniformity and repeatability with the goal of developing a cathode that can consistently operate at current levels greater than 10 mA at operating temperatures less than 1000 °C.
ACKNOWLEDGMENTS
This work was supported by Air Force contract FA8650-11-D-5401 at the Materials & Manufacturing Directorate (AFRL/RXAP) The authors thank John Luginsland at AFOSR and Scott Dudley and Victor Putz of EOARD for their support.