Linear models of the form y i =X i β+ε i estimated with least squares (LS) remain one of the most common statistical tools in political science research (Krueger and Lewis-Beck Reference Krueger and Lewis-Beck2008). Yet some confusion still exists about the conditions under which LS serves as a good estimator of the linear model. After assuming that the model y i =X i β+ε i is correct and that the matrix X is full rank, we need to make further assumptions about the errors ε i to obtain desirable properties for the LS estimator. We might use some of the following assumptions:
A1: Errors have mean equal to zero.
A2: Errors have a constant, finite variance.
A3: Errors are independent.
A4: Errors follow a normal distribution.
By assuming only A1, we obtain an unbiased, consistent estimator (e.g., Wooldridge Reference Wooldridge2013, 810, 385, 815–16). However, by assuming A1, A2, A3, and A4, we obtain the best unbiased estimator (BUE), which has the smallest possible variance among the class of unbiased estimators (e.g., Wooldridge Reference Wooldridge2013, 809–15).
However, political scientists tend to focus on a different property of LS. By the Gauss–Markov theorem, we can remove A4—the assumption of normal errors—and still obtain the best linear unbiased estimator (BLUE), which has the smallest possible variance among the class of unbiased, linear estimators (e.g., Wooldridge Reference Wooldridge2013, 809–12). Researchers have primarily justified LS using the Gauss–Markov theorem because it seems to impart desirable small-sample properties without the overly restrictive assumption of normal errors. For example, Berry and Feldman write:
[The assumption of normally distributed errors] is necessary only for tests of significance; its violation will have no effect on the estimation of the parameters of the regression model. It is quite fortunate that normality is not required for estimation, because it is often very difficult to defend this assumption in practice (Reference Berry and Feldman1985).Footnote 1
However, notice that a tradeoff occurs when relaxing the assumption of normal errors. To relax the assumption of normal errors (and keep desirable small sample properties), we must restrict ourselves to linear estimators. This raises a critical, but often overlooked question: under what conditions can a researcher safely restrict herself to linear estimators? We argue that a restriction to linear estimators makes sense only when the errors follow a normal distribution. If the errors do not follow a normal distribution, then LS is still the BLUE, but other, non-linear estimators may be more efficient. Our claim is that the restriction to linear estimators is artificial and can only be justified by assuming normal errors—an assumption that Berry and Feldman (Reference Berry and Feldman1985) note is very difficult to defend in practice.
The Gauss–Markov theorem has convinced researchers in political science that as long as A1, A2, and A3—the Gauss–Markov assumptions—are met, the distribution of the errors is unimportant. But the distribution of the errors is crucial to a linear regression analysis. Deviations from normality, especially large deviations commonly found in regression models in political science, can devastate the performance of LS compared to alternative estimators. Perhaps even more importantly, regression residuals offer detailed substantive information that researchers often ignore.
In our paper, we emphasize the importance of errors and residuals from a statistical and substantive perspective. We adopt and defend a skeptical perspective toward LS in favor of more robust estimators. We proceed as follows: we (1) clarify the crucial distinction between a linear model and a linear estimator; (2) explain that the BLUE is not the best estimator unless the errors are normally distributed; (3) highlight powerful, robust alternatives to LS estimators that are unbiased and more efficient for a wide range of substantively plausible error distributions; and (4) provide concrete, practical advice to substantive researchers using linear models.
Is the BLUE the best estimator?
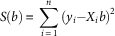
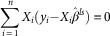
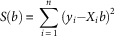
The linear model can be written as y=Xβ+ε. As usual, y is an outcome variable of interest (usually roughly continuous), X a n×(k+1) matrix containing a single column of ones and k columns holding k explanatory variables, β a (k+1)×1 matrix of model coefficients, and ε an n×1 matrix of errors. As usual, the statistical properties of these estimators depend on this model being correct and a full rank X. Researchers in political science commonly estimate this model with LS by minimizing the sum of the squared residuals, such that $\hat{\beta }^{{ls}} {\equals}{\rm arg}\,{\rm min}_{b} S(b)$ , where $S(b){\equals}\mathop \sum\limits_{i{\equals}1}^n {\rm \ztbnd }(y_{i} {\minus}X_{i} b)^{2} $
 . If we assume that the errors ε follow independent and identical normal distributions with mean zero and unknown variance, which we refer to as a “normal linear model,” then the LS estimator is the BUE (Casella and Berger Reference Casella and Berger2002, 334–42; Wooldridge Reference Wooldridge2013, 807–15). This is a powerful result. Under the assumption of normally distributed errors, LS is the most efficient unbiased estimator.
The unreasonable restriction to linear estimators
If we relax the assumption of normality and simply require that the errors have mean zero and constant variance, then the Gauss–Markov theorem guarantees that the LS estimator is the BLUE. While this result is often emphasized, it should provide little comfort to researchers because there is little statistical or substantive reason to restrict themselves to linear estimators.
At first glance, one might take the linearity restriction in the Gauss–Markov theorem to refer to the structure of the model (i.e., “linear in the parameters”). Indeed, this is the sense in which we use “linear” in the phrase “linear model.” However, the “linear” restriction in the Gauss–Markov theorem refers to a different concept—a linear estimator, which is a technical condition that has little connection to the substance of the problem. Linearity of the estimator requires that the estimates be a linear function of the outcome variable, so that $\hat{\beta }_{j} {\equals}\lambda _{1} y_{1} {\plus}\lambda _{2} y_{2} {\plus}...{\plus}\lambda _{n} y_{n} $ , where the weights λ i are allowed to depend on X, but not on y. In other words, the Gauss–Markov theorem assumes a linear model of the form E(y|X)=Xβ, but it also restricts researchers to linear estimators of the form $\hat{\beta }_{j} {\equals}\lambda _{1} y_{1} {\plus}\lambda _{2} y_{2} {\plus}...{\plus}\lambda _{n} y_{n} $
 .Footnote 2
However, restricting ourselves to linear estimators is neither necessary nor productive. We are not arguing against linear models (i.e., linear in the parameters), such as
 $$y_{i} {\equals}\beta _{0} {\plus}\beta _{1} {\rm log}(x_{i} ){\plus}{\epsilon}_{i} ,\hskip 3.1pc$$
 $$y_{i} {\equals}\beta _{0} {\plus}\beta _{1} x_{i} {\plus}\beta _{2} x_{i}^{2} {\plus}{\epsilon}_{i} ,\,{\rm or}\hskip 1.55pc$$
 $$y_{i} {\equals}\beta _{0} {\plus}\beta _{1} x_{i} {\plus}\beta _{2} z_{i} {\plus}\beta _{3} x_{i} z_{i} {\plus}{\epsilon}_{i} .$$
Indeed, we encourage the use of these models. This collection of linear models illustrates that the linear model can represent a wide range of theoretically relevant relationships, especially when it includes explanatory variables non-linearly. Crucially, though, there is no statistical reason to restrict ourselves to linear estimators for these linear models, except for mathematical convenience and computational ease. The only substantive reason to restrict ourselves to linear estimators is if we are willing to assume that we have normally distributed errors. Under the assumption of normal errors, linearity is a reasonable restriction—indeed, the linear estimator is the BUE when the errors are normal. Crucially, restriction to linearity does not get us away from the assumption of normality because the BLUE estimators are the BUE estimators only under the assumption of normal errors. If the errors are not normally distributed, then a researcher can usually do better than the BLUE.
The reasonable consideration of non-linear estimators
Because linearity serves only as an artificial restriction, other unbiased estimators might have smaller variance than the LS estimator. Indeed, in many cases, these alternative estimators possess strongly desirable substantive properties.
Many researchers assume a normal linear model for little or no substantive or empirical reason. Even while knowing that the assumed normal linear model is incorrect, researchers use this model as an approximation. But if the model is only an approximation, then the desirable statistical properties are no longer guaranteed (e.g., unbiasedness, minimum variance). With this in mind, it makes more sense to use a more robust estimator with the following qualitative properties for typical sample sizes:
1. When the normal linear model is exactly correct, the estimator should be approximately unbiased with efficiency comparable to, but less than, LS.
2. When the deviation from the normal linear model is small, the estimator should be approximately unbiased with efficiency comparable to, or perhaps greater than, LS.
3. When the deviation from the normal linear model is large, the estimator should have relatively little bias and be much more efficient than LS.
The “best” estimator for a social scientist might not be the optimal estimator for an assumed model, but an estimator that works reasonably well for the assumed model and many substantively plausible deviations.
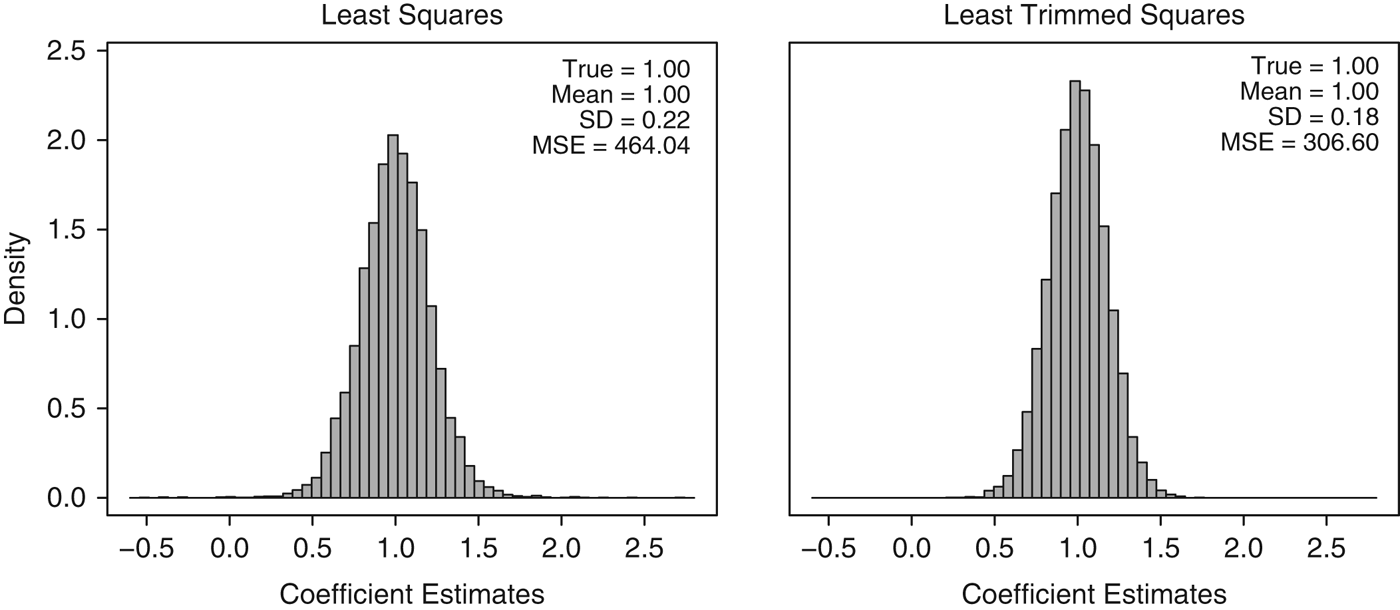
To see the importance of this idea in practice, we simulated 10,000 data sets of 50 observations of variables x and y, where the relationship between x and y is given by y=x+ε, where ε follows a t distribution with three degrees of freedom. The t 3 distribution is symmetric, bell-shaped, and resembles the normal distribution, except it has heavier tails. For each of these 10,000 data sets, we used LS to estimate the slope of the relationship between x and y, where the true value equals one. Because we simulated these data, we know that the Gauss–Markov assumptions hold. This means that LS is the BLUE. The left panel of Figure 1 shows the distribution of the estimated slopes using LS.
Histograms of the sampling distribution for the least squares estimator and the least trimmed squares estimator under the true model y=x+ε, where ε~t 3 Note: Despite least squares being the best linear unbiased estimator for the problem, the least trimmed squares estimator is a better estimator. MSE=mean squared error.
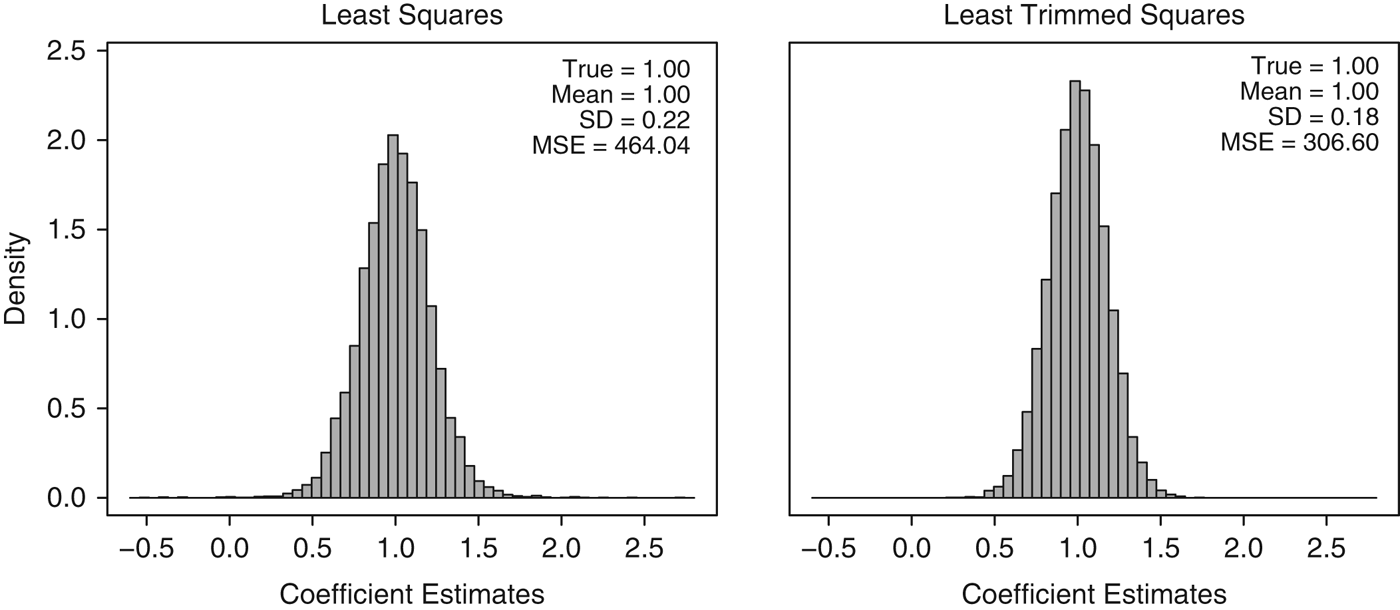
But we also consider a least trimmed squares (LTS) estimator in which we minimize the smallest 90 percent of the residuals. This method literally discards data. Though it lacks the elegant theory of the LS estimator, the right panel of Figure 1 shows that it is unbiased and more efficient that the LS estimator. The standard deviation of the estimates from the LTS estimator is about 18 percent smaller than the BLUE, and the mean squared error (MSE) is about 32 percent smaller. By any reasonable standard, the LTS estimator is a better estimator than the LS estimator in this example, yet the LS estimator is the BLUE. We obtain this improvement by expanding our focus to non-linear estimators, such as the LTS estimator. In this case, the LTS estimator is clearly non-linear because it places zero weight on the largest 10 percent of the residuals and unit weight on the smallest 90 percent of the residuals.
The relative emphasis on standard errors
There has been much attention in the methodological literature to the sensitivity of standard errors to violations from the assumed model—and substantive scholars have paid attention. White’s (Reference White1980) seminal paper developing heteroskedasticity-consistent standard errors has received over 20,000 citations, making it one of the most cited papers in economics. Beck and Katz’s (Reference Beck and Katz1995) development of panel corrected standard errors has received over 4300 citations, making it one of the most cited papers in political science.
On the other hand, there has been scant attention paid by substantive political scientists to the sensitivity of the estimates to similar violations. This is particularly problematic, since it makes little sense to find a good standard error for a poor estimate (Freedman Reference Freedman2006; King and Roberts Reference King and Roberts2014). Two papers in political science have addressed the issue of robust estimation. Western (Reference Western1995) introduces political scientists to robust estimators, but this work has been essentially ignored. Although published in the same year as Beck and Katz (Reference Beck and Katz1995), Western (Reference Western1995) has received only 99 citations, or about 2 percent of the citations that Beck and Katz have received. Similarly, Harden and Desmarais (Reference Harden and Desmarais2011) have received only one citation, and it comes from the authors themselves. Anderson’s (Reference Anderson2008) broad and accessible introduction to robust estimation methods has received only about 150 citations, most from outside political science.
The relative focus on obtaining reasonable standard errors at the expense of reasonable estimates can be seen in Gujarati’s (Reference Gujarati2004) popular econometrics text. Though the text deals with robust standard errors in some detail, Gujarati writes in a footnote:
In passing, note that the effects of departure from normality and related topics are often discussed under the topic of robust estimation in the literature, a topic beyond the scope of this book [italics ours] (Reference Gujarati2004, 339).
Angrist and Pischke (Reference Angrist and Pischke2009) devote an entire chapter to robust standard errors but ignore robust estimation of model coefficients. Wooldridge (Reference Wooldridge2013) does devote about two pages to robust estimation, though the tone is skeptical.
Dealing with skewness: transforming the outcome
Despite the lack of attention devoted by substantive scholars to non-normal errors, errors can deviate from normality in two ways, and both negatively affect inferences when using LS.
1. The error distribution might be skewed.
2. The error distribution might have heavy tails.
We suggest dealing with these two deviations differently, so we discuss each separately.
Skewed error distributions create two problems for the linear model. First, LS estimates the quantity E(y|X), and the mean is not a good summary of location for skewed variables. Symmetric error distributions are easier to understand.
Second, and perhaps most importantly, skewed residuals from a LS fit indicate model misspecification. While we cannot be certain of the correct model in this situation, we can have confidence that the normal linear model did not produce such data. Sometimes, it is theoretically intuitive that explanatory variables have increasing effects on non-negative outcome variables, such as an individual’s annual income. Rather than a college degree increasing one’s expected income by $10,000, perhaps a college degree increases it by 10 percent. If this intuition is correct and a researcher relies on the statistical model Income i =β 0+β 1College Degree i +ε i , then the errors will have a strong skew to the right. Simply logging the outcome, or using the model log(Income i )=β 0+β 1College Degree i +ε i , better captures the theoretical intuition.
Even if we remain indifferent toward the theoretical implications of skewed error distributions, we must remain cautious about the statistical implications. Indeed, the log-transformation in the example above improves the efficiency of the LS estimator by making the assumption of normally distributed errors more appropriate (not to mention the linearity of the model). The performance of LS estimators improves as the error distribution approaches a normal distribution.
It is quite common in disciplines such as economics, for example, to log-transform positive outcome variables by default. Since positive outcomes are bounded below by zero, then these variables are likely skewed to the right—they are squeezed from the left by zero. In this case, the model log(y)=Xβ+ε will likely provide a better approximation to the data.
When addressing skewed residuals, it is impossible to know whether (1) the skew is due to a misspecification of the outcome variable (i.e., failing to transform) or (2) the errors follow a heteroskedastic, skewed distribution. However, we can be confident that heavily skewed residuals are inconsistent with normal errors—the researcher must address the skew. Transforming the outcome variable is one effective method for making the model more consistent with the data.
The Box–Cox transformation
While we agree with the spirit of the suggestion to log-transform a positive outcome variable y, statisticians have created more precise empirical methods for choosing whether and how to do the transformation. Box and Cox (Reference Box and Cox1964) propose the Box–Cox transformation
 $$y^{{(\lambda )}} {\equals}{\rm BC}(y,\lambda ){\equals}\left\{ {\matrix{ {{{y^{\lambda } {\minus}1} \over \lambda }} \hfill & {{\rm for}\,\lambda \,\ne\,0} \hfill \cr {{\rm log}\,y} \hfill & {{\rm for}\,\lambda {\equals}0} \hfill \cr } } \right.,$$
where the transformation parameter λ is estimated with maximum likelihood. In this case, the model becomes y
(λ)=Xβ+ε. This is particularly convenient because $\hat{\lambda }\,\approx\,1$ suggests no transformation is needed and $\hat{\lambda }\,\approx\,0$
 suggests that only an intuitive log-transformation is needed.
Researchers can easily assess the skewness in the residuals using a simple histogram of the residuals or a QQ plot of the residuals compared to their normal quantiles. For a formal test of skewness, researchers might use a direct test for symmetry on residuals $\hat{e}$ , such as the Mira (Reference Mira1999) test, or test whether λ≠1 under the Box–Cox framework. However, we do not want to argue for a particular test, but to highlight that (1) asymmetries worsen the performance of LS and many robust methods, (2) researchers can easily detect asymmetries by carefully examining the residuals, and (3) researchers can address this problem with simple, easy-to-use transformations.
Mean or median?
Applying a non-linear transformation to the outcome variable y does raise an interpretational difficulty. The usual, untransformed linear model is given by y=Xβ+ε and the quantity of interest is usually E(y|X) or ${{\partial E(y\,\mid\,X)} \over {\partial x_{j} }}$ . For concreteness, consider the log-transformation. Using the same logic, then the model is log(y)=Xβ+ε and we might take the quantity of interest to be E[log(y)|X] or
${{\partial E[{\rm log}(y)\,\mid\,X]} \over {\partial x_{j} }}$
 . However, the substantive researcher is usually interested in y, not log(y), making ${{\partial E[{\rm log}(y)\,\mid\,X]} \over {\partial x_{j} }}$
 more difficult to understand than ${{\partial E(y\,\mid\,X)} \over {\partial x_{j} }}$
 . To make the results more interpretable, we need to “undo” the transformation. But E[log(y)|X]≠log[E(y|X)], which means that the log cannot be undone without additional computation.
These interpretational difficulties are not due to the choice to transform the data, but imbedded in the data themselves. The mean E(⋅) is not a good measure of the location of a skewed variable. While the mean often makes calculations easier, the median offers a better summary of location. The median also has an intuitive interpretation because one-half of the distribution lies above the median and one-half lies below. If a researcher uses med(y new |X new ) to predict the unknown outcome y new for a known case X new , then she has a 50 percent chance of being too high and a 50 percent chance of being too low.
In addition to the intuitive substantive interpretation of med(y|X), the median has another desirable property. Because the log-transformation is order-preserving, med[log(y)|X]=log[med(y|X)], which means that the log can easily be undone because e
med[log(y)|X]=e
log[med(y|X)]=med(y|X). Therefore, by adopting med(y|X) and ${{\partial {\rm med}(y\,\mid\,X)} \over {\partial x_{j} }}$ as the quantities of interest, the researcher eases the interpretation of the results and can easily move between transformed and untransformed outcomes (e.g., med[log(y)]→med(y)). This holds for the more general case of y (λ) as well.
Simulating quantities of interest under transformation
To obtain quantities of interest relating to med(y) when the estimated model has the generic form y (λ)=Xβ+ε, one can use the algorithm described by King, Tomz and Wittenberg (Reference King, Tomz and Wittenberg2000).
1. Estimate the Box–Cox transformation parameter $\hat{\lambda }$
 using maximum likelihood. (If the values 1 or 0 fall within the confidence interval, then one may wish to use those values to maintain the direct interpretability of the model coefficients.)
2. Estimate the transformed model $y^{{(\hat{\lambda })}} {\equals}X\beta _{{{\rm trans}}} {\plus}{\epsilon}$
and obtain the estimated model coefficients $\hat{\beta }_{{{\rm trans}}} $ and covariance matrix Σtrans.3. Choose a hypothetical case or set of cases X pred for which to calculate the quantity of interest. If one is interested in calculating a first difference, it is convenient to use X hi and X lo , where the first-difference Δ(y, X hi , X lo )=med(y|X hi )−med(y|X lo ).
4. Following King, Tomz and Wittenberg (Reference King, Tomz and Wittenberg2000), for i from one to a large (e.g., 1000) number of iterations n sims:
a. Simulate $\tilde{\beta }_{{{\rm trans}}} \,\sim\,N\left( {\hat{\beta }_{{{\rm trans}}} ,{\rm \Sigma }_{{{\rm trans}}} } \right)$
.b. If interested in the predicted value, then calculate and store $\tilde{Q}_{i} {\equals}{\rm med}(y\,\mid\,X_{{{\rm pred}}} ,\tilde{\beta }_{{{\rm trans}}} ){\equals}BC^{{{\minus}1}} (X_{{{\rm pred}}} \tilde{\beta }_{{{\rm trans}}} ,\hat{\lambda })$
. If interested in the first-difference, the calculate and store <tex-math><![CDATA[$\tilde{Q}_{i} {\equals}{\rm \Delta }(X_{{hi}} ,X_{{lo}} ,\tilde{\beta }_{{{\rm trans}}} ){\equals}{\rm BC}^{{{\minus}1}} (X_{{hi}} \tilde{\beta }_{{{\rm trans}}} ,\hat{\lambda }){\minus}{\rm BC}^{{{\minus}1}} (X_{{lo}} \tilde{\beta }_{{{\rm trans}}} ,\hat{\lambda })$.





5. Summarize the n sims simulations. The mean or median of <tex-math><![CDATA[$\tilde{Q}$
serves as an estimate of the quantity of interest and the standard deviation of <tex-math><![CDATA[$\tilde{Q}$ serves as an estimate of the standard error. The 5th and 95th percentiles of <tex-math><![CDATA[$\tilde{Q}$ serve as an estimate of the (likely asymmetric) 90 percent confidence interval for the quantity of interest.


Dealing with heavy tails: M-estimation
In spite of the scant attention paid to robust estimators in political science, statisticians have developed and refined many robust methods since the seminal work of Box (Reference Box1953) and Huber (Reference Huber1964). Huber and Ronchetti (Reference Huber and Ronchetti2009) provide a detailed review of these developments and Anderson (Reference Anderson2008) provides an accessible introduction. Adjudicating among the many robust alternatives to LS is beyond the scope of our paper, but, to fix ideas, we do introduce one robust estimator developed by Beaton and Tukey (Reference Beaton and Tukey1974) in detail which has several desirable properties—the M-estimator with Tukey’s biweight (BW) function. However, there are many other options: M-estimators with other objective functions (e.g., Huber Reference Huber1973), LMS- and LTS-estimators (Rousseeuw Reference Rousseeuw1984), S-estimators (Rousseeuw and Yohai Reference Rousseeuw and Yohai1984), and MM-estimators (Yohai Reference Yohai1987).Footnote 3
While LS yields the coefficients that minimize the sum of the squared residuals, so that <tex-math><![CDATA[$\hat{\beta }^{{ls}} {\equals}{\rm arg min}_{b} \mathop \sum\limits_{i{\equals}1}^n {\rm \ztbnd }(y_{i} {\minus}X_{i} b)^{2}$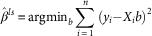 , M-estimators minimize an arbitrary (usually), less-rapidly increasing function of the residuals <tex-math><![CDATA[$\hat{\beta }^{\rho } {\equals}{\rm arg min}_{b} \mathop \sum\limits_{i{\equals}1}^n {\rm \ztbnd }\rho (y_{i} {\minus}X_{i} b)$
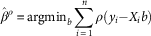 . The function ρ(⋅) is typically chosen to be non-negative, symmetric about zero, and increasing away from zero. For example, Harden and Desmarais (Reference Harden and Desmarais2011) recommend the least absolute deviation (LAD) estimator (Dodge Reference Dodge1987) such that ρ(⋅)=abs(⋅). However, other estimators offer better performance, particularly when the normal linear model is approximately correct. In particular, we recommend Tukey’s BW function (Beaton and Tukey Reference Beaton and Tukey1974), so that
 $$\rho _{{bw}} (r_{i} ){\equals}\left\{ {\matrix{ {{{k^{2} } \over 6}\left\{ {1{\minus}\left[ {1{\minus}\left( {{{r_{i} } \over k}} \right)^{2} } \right]^{3} } \right\}} \hfill & {{\rm for}\,\vert \,r_{i} \,\vert\leq k} \hfill \cr {{{k^{2} } \over 6}} \hfill & {{\rm for}\,\vert\,r_{i} \,\vert\,\gt\,k} \hfill \cr } } \right.,$$
where r i =y i −X i b and k is a tuning parameter usually set to 4.685 to ensure good performance under the normal linear model. We refer to the M-estimator using the BW objective function as the “BW estimator.” The BW estimator is a compelling alternative to the LAD estimator suggested by Harden and Desmarais (Reference Harden and Desmarais2011) for two reasons. First, the BW objective function is redescending, which means that it has the ability to weight unusual observations all the way down to zero. The absolute value objective function, on the other hand, does downweight unusual observations, but these always receive some weight. Second, the BW estimator is much more efficient than the LAD estimator when the errors are approximately normal.
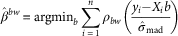
Two cautions are in order. First, the optimization problem is not convex, so standard minimization routines can produce a local rather than the global minimum. This concern might lead researchers to choose another objective function, such as the Huber objective function. However, researchers can usually address this problem in practice by using a good starting value, such as the LTS estimate. Second, because the solution is not scale invariant, the residuals <tex-math><![CDATA[$\hat{e}_{i} $ are standardized by a robust estimate of scale <tex-math><![CDATA[$\hat{\sigma }_{{{\rm mad}}} $
 , which must of course be estimated jointly, so that <tex-math><![CDATA[$\hat{\beta }^{{bw}} {\equals}{\rm arg min}_{b} \mathop \sum\limits_{i{\equals}1}^n {\rm \ztbnd }\rho _{{bw}} \left( {{{y_{i} {\minus}X_{i} b} \over {\hat{\sigma }_{{{\rm mad}}} }}} \right)$
 , where <tex-math><![CDATA[$\hat{\sigma }_{{{\rm mad}}} {\equals}{{{\rm med}\left( {\,\mid\,y{\minus}Xb\,\mid\,} \right)} \over {0.6745}}$
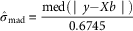 . Dividing by 0.6745 makes <tex-math><![CDATA[$\hat{\sigma }_{{{\rm mad}}}$
 a consistent estimator of the standard deviation of the normal distribution.
While the theory for M-estimators remains less complete than the theory for LS estimators, M-estimators do have desirable statistical properties. M-estimators are consistent as long as (1) ρ(⋅) is convex or (2) the errors follow a strongly unimodal distribution (i.e., decreasing away from zero). Because the BW objective function is not convex, we must assume that the errors follow a strongly unimodal distribution, which ensures that the estimates are consistent and distributed asymptotically normal.
M-estimators in general, and the BW estimator in particular, have the desirable substantive property that they allow unusual cases to stand out. LS, on the other hand, sacrifices fit on typical cases to better fit unusual cases. Allowing unusual cases to stand out, though, is extremely important because unusual cases can inform and improve subsequent analyses. Knowing what cases fall outside the explanatory power of the model enables the researcher to ask “Why?” and raise issues relating to concepts, theory, and measurement that might otherwise have been missed.
Estimation
The model parameters \hat{\beta }^{{bw}} $ and $\hat{\sigma }_{{bw}} $
 can be quickly estimated jointly using the following iterative algorithm.
1. Start with initial estimates of the coefficients $\hat{\beta }^{{(0)}} $
. The choice of initial estimator is not trivial. In the case of extreme outliers or many parameters, starting with LS might lead the algorithm to a local minimum. We recommend using the LTS method discussed earlier to obtain starting values.2. Extract the residuals $r^{{(0)}} {\equals}y{\minus}X\hat{\beta }^{{(0)}} $
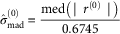
. Use these residuals to estimate the rescaled MAD (median absolute deviation) so that $\hat{\sigma }_{{{\rm mad}}}^{{(0)}} {\equals}{{{\rm med}\left( {\,\mid\,r^{{(0)}} \,\mid\,} \right)} \over {0.6745}}$.3. For i from one until convergence:
a. Using $\hat{\beta }^{{(i{\minus}1)}} $
and $\hat{\sigma }_{{{\rm mad}}}^{{(i{\minus}1)}} $ assign weights w according to the function ρ and denote diag(w)=W
(i).b. Calculate $\hat{\beta }^{{(i)}} {\equals}(X{\rm '}W^{{(i)}} X)^{{{\minus}1}} X{\rm '}W^{{(i)}} y$
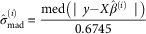
.c. Calculate $\hat{\sigma }_{{{\rm mad}}}^{{(i)}} {\equals}{{{\rm med}\left( {\,\mid\,y{\minus}X\hat{\beta }^{{(i)}} \,\mid\,} \right)} \over {0.6745}}$
d. The algorithm has converged when r (i−1)≈r (i).





If we assume that the errors are symmetrically distributed about zero, then any objective function ρ that is also symmetric about zero (including, e.g., the BW objective function) produces an unbiased estimate of the parameters. But this estimator is linear if and only if $\rho (r_{i} ){\equals}r_{i}^{2} $ . Other choices of ρ(⋅) might produce better estimators than the BLUE.
The theory for the variance for this broad class of unbiased M-estimators, though, is asymptotic. The required sample size for the asymptotic approximations to work well depends on the problem, but valid confidence intervals for small data can easily be computed by bootstrapping (Efron Reference Efron1981; Mooney and Duval Reference Mooney and Duval1993).
Monte Carlo simulations
To understand and illustrate how the performance of the BW estimator compares with the common LS estimator, we conducted a Monte Carlo study. For comparison, we included the LTS estimator discussed above and the LAD estimator suggested by Harden and Desmarais (Reference Harden and Desmarais2011). To conduct the study, we simulated from the linear model y=β 0+β 1 x 1+β 2 x 2+β 3 x 3+ε, where β 0=0 and β 1=β 2=β 3=1 and the x i ’s were generated from independent standard normal distributions. We used six different distributions for the errors, each symmetric and centered at zero.
∙ Laplace distribution. The Laplace distribution has tails that decrease exponentially, but behaves much differently from the normal distribution near zero. Rather than “shoulders,” the Laplace distribution has a sharp peak at zero and can be thought of as combining two exponential distributions, one in the positive direction and the other in the negative direction. The LAD estimator is the maximum likelihood estimator when the errors follow a Laplace distribution.
∙ t 2 distribution. The t distribution with two degrees of freedom has very heavy tails. Because the LS estimator weights all points equally (conditional on X), the extreme outliers produced by the t 2 distribution makes LS a very inefficient estimator.
∙ t 10 distribution. The t distribution with ten degrees of freedom has slightly heavier tails than the normal distribution. The t 10 and normal distributions are so similar that a Shapiro–Wilk test of normality only correctly rejects the null in about 65 percent of repeated samples if 500 observation are simulated from a t 10 distribution.Footnote 4 It is essentially impossible to spot the differences between the normal and t 10 density functions without plotting the two directly on top of each other.
∙ Logistic distribution. The logistic distribution has tails similar to the t 10 distribution—slightly heavier than the normal distribution. Researchers sometimes assume that latent errors in discrete choice models follow a logistic distribution (Train Reference Train2009).
∙ Uniform distribution. Simply for comparison, we include a uniform distribution from −1 to 1.
∙ Normal Distribution. The normal distribution yields the optimal conditions for the LS estimator. When the errors follow a normal distribution, the LS estimator has the smallest variance of all unbiased estimators.
For the six different error distributions, we simulated 10,000 data sets with 100 observations each and estimated β 1 using the LS estimator, the BW estimator, the LAD estimator, and the LTS estimator. For each condition, we calculated the MSE of the estimate of β 1. To simplify the presentation, we divided the MSE of the BW, LAD, and LTS estimators by the MSE of the LS estimator. Table 1 provides the results. These results show that the MSE varies considerably across the estimators for each error distribution.
The Mean Squared Error of the Biweight (BW), Least Absolute Deviation (LAD), and Least Trimmed Squares (LTS) Estimators Compared to the Least Squares (LS) Estimator for Six Different Error Distributions With a Sample Size of 100

Note: The BW has the best or nearly best performance in each condition, while the LAD and LTS estimators performs quite poorly for the t 10 and normal distributions, and the LS estimator performs quite poorly for the Laplace and t 2 distributions.
The LAD estimator is the MLE when the errors follow a Laplace distribution, so, as we might expect, the LAD performs well for Laplace errors, with an MSE about 30 percent lower than the LS estimate. However, the BW estimator also performs quite well for the Laplace distribution, with an MSE about 25 percent less than the LS estimator. The LTS estimator performs the worst of the robust estimators, but the MSE of the LTS estimator is still about 5 percent less than the MSE for the LS estimator.
The t 2 distribution is nearly a worst case for the LS estimator, so all three robust alternatives perform considerably better. The BW estimator has an MSE about 85 percent lower than the LS estimator and the LAD and LTS estimators have an MSE about 83 and 82 percent lower, respectively.
The t 10 distribution is a much more interesting case, because it is very similar to a normal distribution. In this case, the LAD and LTS estimators have a 33 and 44 percent larger MSE than the LS estimator, respectively. The BW estimator, on the other hand, shows a small improvement over the LS estimator, with an MSE about 2 percent smaller than the LS estimator. This is crucial because it shows that only a small deviation from normality is required before the BLUE estimator is no longer the BUE estimator.
The logistic and t 10 distributions are similar and produce similar results. The LAD and LTS estimators perform worse than the LS estimator, with the MSE 24 and 31 percent larger than the LS estimator, respectively. Again, though, the BW estimator shows a small improvement over the LS estimator, with an MSE about 5 percent smaller than the LS estimator.
For the uniform distribution, the LAD and LTS estimators perform much worse than the LS estimator, with an MSE 171 and 288 percent larger, respectively. However, the BW estimator performs similarly to the LS estimator with an MSE only 16 percent larger.
The normal distribution is the optimal scenario for the LS estimator and it outperforms the LAD and LTS estimator considerably when the errors are normal. In this situation, the MSE for the LAD and LTS estimator is 58 and 71 percent larger than the MSE for the LS estimator, respectively. However, the BW estimator performs nearly as well as the LS estimator for normal errors. The MSE for the BW estimator is only about 7 percent larger than the MSE for the LS estimator.
Among the estimators we consider, the BW estimator does not have the smallest variance for the Laplace, uniform, or normal distributions, but it is a close second. It does have the smallest variance for the t 2, t 10, and logistic distributions. It considerably outperforms the LS estimator for Laplace and t 2 errors and the LAD and LTS estimators for normal and t 10, logistic, and uniform errors. Thus, the BW estimator works quite well across a range of error distributions, whereas the LS, LAD, and LTS estimators work well only in particular situations. And even in particular situations where the LS, LAD, and LTS estimators work well, the BW estimator performs comparably.
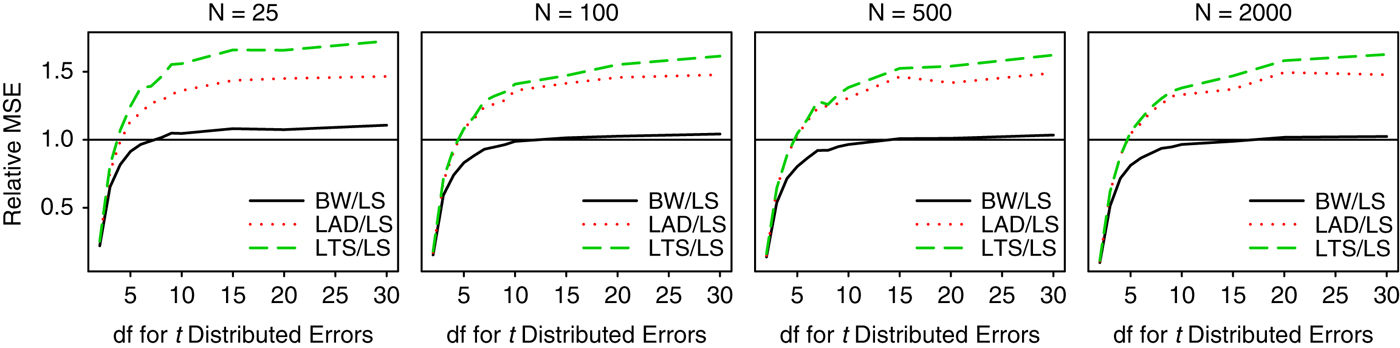
To better understand how the heaviness of the tails of the error distribution affects the efficiency of these estimators, we repeated these simulates for t distributions with degrees of freedom ranging from two to 30 and sample sizes of 25, 100, 500, and 2000. Figure 2 shows the MSE of the LAD and BW estimators relative to the LS estimator.
The relative mean squared error (MSE) for the biweight (BW), least absolute deviation (LAD), and least trimmed squares (LTS) estimators compared to the least squares (LS) estimator for t distributed errors as the degrees of freedom varies. Note: For very heavy-tailed distributions (e.g., 2–5 degrees of freedom), the BW, LAD, and LTS estimators significantly outperform the LS estimator. And while the performance of the LAD and LTS estimators significantly worsens as the distribution becomes more normal, the BW estimator remains comparable to the LS estimator.
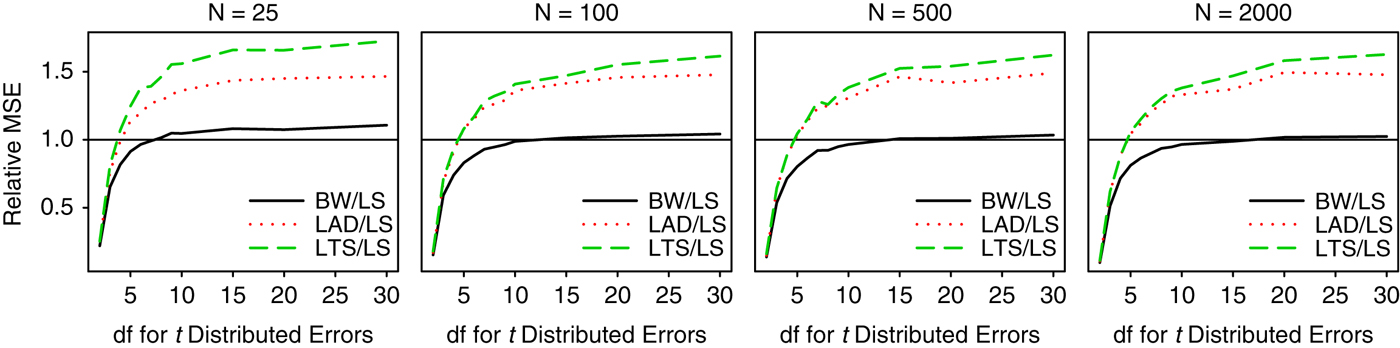
Notice that the BW, LAD, and LTS estimators perform quite well for very heavy-tailed distributions (i.e., degrees of freedom from two to four), but as the tails grow lighter, the LS estimator quickly begins to outperform the LAD and LTS estimator. For all but very heavy-tailed distributions, the LS estimator is considerably more efficient than the LAD and LTS estimators.
The BW estimator, on the other hand, is a much stronger competitor for the LS estimator. While the LS estimator is more efficient for lighter-tailed distributions (i.e., more than ten degrees of freedom), the difference is tiny except in very small samples. Indeed, for sample sizes of 100 or larger, the LS estimator is only about 5 percent more efficient than the BW estimator at best. This second simulation also suggests that the BW estimator works almost as well as the LS estimator under ideal conditions for the LS estimator and considerably better across a wide range of other, substantively plausible scenarios.
Recommendations for applied researchers
When using the linear model, we suggest that researchers take steps to ensure that the assumption of normal errors makes theoretical and empirical sense.
1. Initially fit the model using LS.
2. As a “robustness check,” re-fit the model using a robust alternative, such as the BW estimator.
3. If the inferences change (and even if not), carefully examine the residuals using histograms and QQ plots. Carefully check for skewness.
4. If the residuals are not symmetrically distributed, then consider a transformation. This transformation might be critical because it allows the model to represent non-linear relationships implied by the skewness and allows the statistical model to more closely approximate the data. The log-transformation has a nice substantive interpretation, so it makes sense as a first cut, especially for variables naturally bounded below by 0 or 1. If the log-transformation over- or under-corrects the skewness, then the Box–Cox transformation might create roughly symmetric residuals.
5. Once the residuals are roughly symmetric, re-fit the model using LS and a robust alternative. Especially if the residuals appear to have heavy tails, then the robust estimator might serve as a more efficient estimator. However, the robust estimator also allows for greater substantive interpretation as well, because it allows unusual cases to stand out.
6. Always pay close attention to the residuals from each model, especially differences, as these can be especially substantively informative.
7. To the extent that some cases seem unusual, especially with robust regression, give these cases careful review. Is it possible that these unusual outcomes are data entry errors? In light of these cases, can the measurement be improved? Might a subset of the cases be operating under a substantially different causal process that could be built into the statistical model?
To illustrate these recommendations, we include a reanalysis of Clark and Golder (Reference Clark and Golder2006) as an Online Appendix.
Conclusion
In our paper, we adopt and defend a skeptical perspective toward LS and explain the importance of carefully scrutinizing residuals. We first observe that the restriction to linear estimators, as required by the Gauss–Markov theorem, is unnecessary, artificial, and counterproductive. When the errors do not follow a normal distribution, restricting ourselves to linear estimators limits our ability to efficiently estimate the model coefficients. And as Berry and Feldman (Reference Berry and Feldman1985) claim, the assumption of normal errors is usually difficult to defend using either theory or data.
Second, we use Monte Carlo simulations to show that our preferred estimator, an M-estimator with a BW objective function, performs almost as well as LS for normal errors, slightly better than LS for small deviations from normality, and much better than LS for large deviations from normality. In our view, political scientists should prefer this robust behavior to the more fragile LS estimator.
Third, point out that a more robust estimator can constructively alter substantive conclusions. Robust estimators not only estimate the model coefficients more efficiently under deviations from normality, but more importantly, allow unusual cases to stand out as unusual. This, in turn, allows researchers to identify and carefully investigate these cases and improve the theoretical model, the statistical model specification, and the measurement of the concepts.
Supplementary materials
To view supplementary material for this article, please visit https://doi.org/10.1017/psrm.2018.34. Replication materials are available at https://doi.org/10.7910/DVN/WZSUS3
Acknowledgments
The authors thank Bill Clark and Matt Golder for making their data available to the authors. An audience at the 2015 Innovations in Comparative Political Methodology Conference at Texas A&M University provided valuable feedback on an earlier draft of this manuscript. The analyses presented here were conducted with R 3.2.2. All data and computer code necessary for replication are available at https://github.com/carlislerainey/heavy-tails